Pew Research Center

FOR RELEASE MAY 10, 2017

Americans’ Attitudes About the News Media Deeply Divided Along Partisan Lines

Democrats are 47 points more likely than Republicans to support news media’s watchdog role

BY Michael Barthel and Amy Mitchell

FOR MEDIA OR OTHER INQUIRIES:

Communications Department
202.419.4372
www.pewresearch.org

RECOMMENDED CITATION

Pew Research Center, May 2017, "Americans’ Attitudes About the News Media Deeply Divided Along Partisan Lines"

About Pew Research Center

Pew Research Center is a nonpartisan, nonadvocacy fact tank that informs the public about the issues, attitudes and trends shaping the world. It does not take policy positions. The Center conducts public opinion polling, demographic research, computational social science research and other data-driven research. It studies politics and policy; news habits and media; the internet and technology; religion; race and ethnicity; international affairs; social, demographic and economic trends; science; research methodology and data science; and immigration and migration. Pew Research Center is a subsidiary of The Pew Charitable Trusts, its primary funder.

© Pew Research Center 2026

Table of contents

  • About Pew Research Center
  • Americans’ Attitudes About the News Media Deeply Divided Along Partisan Lines
  • 1. Democrats, Republicans now split on support for watchdog role
  • 2. Interest in national news increases sharply among Democrats
  • Acknowledgments
  • Methodology
  • Appendix A: Detailed tables

Americans’ Attitudes About the News Media Deeply Divided Along Partisan Lines

Democrats are 47 points more likely than Republicans to support news media’s watchdog role

Democrats and Republicans, who already tend to place their trust in different news sources and rely on different outlets for political news, now disagree more than ever on a fundamental issue of the news media’s role in society: whether news organizations’ criticism of political leaders primarily keeps them from doing things they shouldn’t – or keeps them from doing their job.

Today, in the early days of the Trump administration, roughly nine-in-ten Democrats (89%) say news media criticism keeps leaders in line (sometimes called the news media’s “watchdog role”), while only about four-in-ten Republicans (42%) say the same. That is a 47-percentage-point gap, according to a new online survey conducted March 13-27, 2017, among 4,151 U.S. adults who are members of Pew Research Center’s nationally representative American Trends Panel. The gap stands in sharp contrast to January-February 2016, when Americans were asked the same question. Then, in the midst of the presidential primary season, nearly the same share of Democrats (74%) and Republicans (77%) supported the watchdog role.

Pew Research Center has asked this question since 1985. While Republicans have been more likely to support a watchdog role during Democratic presidencies and vice versa, the distance between the parties has never approached the 47-point gap that exists today. The widest gap up to now occurred during the George W. Bush administration, when Democrats were 28 points more likely than Republicans to support a watchdog role. It should be noted that prior to 2016, the question was asked by telephone rather than the web, which can elicit slightly different response patterns.1 Even taking possible mode effects into account, though, this year’s difference is so stark that it would still be the largest gap in the Center’s polling on this question.

This partisan split is found in other attitudes about the news media, though none in so dramatic a fashion as with the watchdog role. Compared with 2016, Democrats and Republicans are more divided on whether the press favors one side in its political coverage, on how much trust they have in national news media, and on how good a job national news organizations are doing in keeping them informed.

The divide in news media attitudes also extends to Americans’ behaviors around news. Most prominently, Americans are also paying closer attention to national news now than in 2016, with that increase driven by Democrats. Overall, four-in-ten Americans report following national news very closely, up from a third the year before. Among Democrats, about half (49%) say they follow it closely, also up from a third in 2016.

Democrats are also driving an increase in use of mobile devices for news. Nearly half of U.S. adults (45%) often get news on a mobile device. That is 9 percentage points above just a year ago, when 36% often got news this way, with significant growth occurring among Democrats but not Republicans. What’s more, an increasing share of Americans also prefer getting news on mobile over a desktop computer. Among those who get news on both types of devices, nearly two-thirds (65%) say they prefer mobile.

Finally, one aspect of news consumption is little changed in either party: the role of friends and family as sources of news. Fifteen percent of Americans have a lot of trust in news that comes to them from friends and family (slightly lower than the trust levels for local and national news organizations), and 16% of online news consumers often get news there from people close to them (about a third as many as do so from news organizations). These figures are on par with 2016 and show less partisan divide than other measures – just a 5-percentage-point gap, for instance, in trust of information from family and friends. There was a slight uptick in the share of Americans who say the political news they get from friends and family represents just one side rather than a mix (40%, up from 35% in 2016), with Democrats and Republicans equally likely to say this.

These findings are a part of Pew Research Center’s ongoing examination of Americans’ attitudes about the news media and consumption habits around news, including findings reported earlier this year that, even amid these partisan divides, strong majorities of both Republicans and Democrats feel the relationship between the press and the Trump administration is unhealthy and getting in the way of Americans’ access to political information.

1. Democrats, Republicans now split on support for watchdog role

Democrats and Republicans are widely divided in several of their views of the news media, a finding that is a sharp break from just a year ago.

The most striking divide is on the role of criticism by news organizations: whether it is worthwhile because it mostly keeps political leaders from doing things they shouldn’t do (the so-called “watchdog role”), or it gets in the way of leaders’ ability to do their job.2

Overall, seven-in-ten Americans feel news media criticism keeps politicians in line, down just slightly from last year. But Democrats are far more likely than Republicans to hold this view. Nearly nine-in-ten Democrats (89%) feel media criticism keeps leaders from doing the wrong thing – a sense shared by only about four-in-ten Republicans (42%). In contrast, a year ago about three-quarters of both Democrats (74%) and Republicans (77%) backed the news media’s watchdog role. Most of the year-to-year shift occurred among Republicans, whose support for the watchdog role dropped 35 points. At the same time, Democrats are now even more likely to express support for it, rising from 74% in 2016 to 89% today.

Among independents overall, views remained unchanged year to year (74% in 2016; 70% in 2017). However, independents who lean to the Democratic Party have become more likely to back the news media’s watchdog role (76% in 2016, 86% in 2017), while Republican-leaning independents have become less likely to do so (76% in 2016, 56% in 2017).

It is not unusual for Americans who align with the party in control of the presidency to be somewhat less likely to support the watchdog role (as Republicans are now). For instance, in prior, phone-based surveys conducted by Pew Research Center, Democrats were more likely to express support for the news media’s watchdog role during the George W. Bush administration, while Republicans were somewhat more likely to hold this view during Bill Clinton’s presidency and in the first year of Barack Obama’s administration. (There was no noticeable partisan divide later in Obama’s presidency, after the GOP won control of Congress.) Still, the current gap is far wider than at any prior point over the past three decades that the Center has been tracking this trend. Indeed, the largest gap in past polling was 28 percentage points in 2005, at the beginning of George W. Bush’s second term in office. While phone surveys show some different response patterns from web-based surveys (as the current and the 2016 polls are), the gap in 2017 is so large that, even if mode effects were taken into account, it would still be the largest in the Center’s history of polling on this question.3

Partisan divide also apparent in perceived fairness of news media

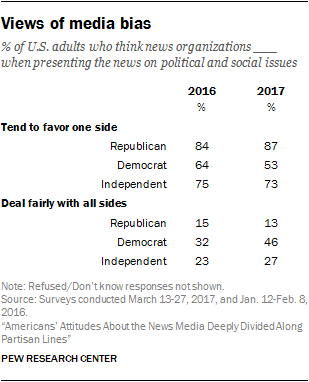
When it comes to the perceived fairness of the news media, a strong majority of Americans continue to say news organizations tend to favor one side in presenting news on political and social issues: 72%, on par with the 74% in 2016. Only a little over a quarter, on the other hand, say they deal fairly with all sides.

But the differences between Democrats and Republicans have grown wider over the last year.

Now, roughly half of Democrats say the news media tend to favor one side (53%), down from nearly two-thirds (64%) a year ago. The views of liberal Democrats in particular have shifted: 53% say the news media favor one side, a 20-percentage-point decline from 2016 (73%). Moderate and conservative Democrats showed no measurable movement.

Republicans, on the other hand, overwhelmingly think news organizations tend to favor one side (87%), in line with their 2016 view. Neither conservative Republicans nor moderate and liberal Republicans showed any movement.

Pew Research Center’s long trend of phone surveys on this question (which are not exact comparisons with the current and 2016 web-based surveys due to the potential for small mode effects) reveals that Republicans have consistently been more likely than Democrats to say the news media favor one side in their political coverage. Still, with the exception of the end of the George W. Bush administration in 2007, the current gap is far wider than at any other point in the trend.

Trust in news organizations divides on party lines; trust in social media very low for both parties

The new survey also finds growing partisan differences in the level of trust Americans have in the information coming from national news organizations.

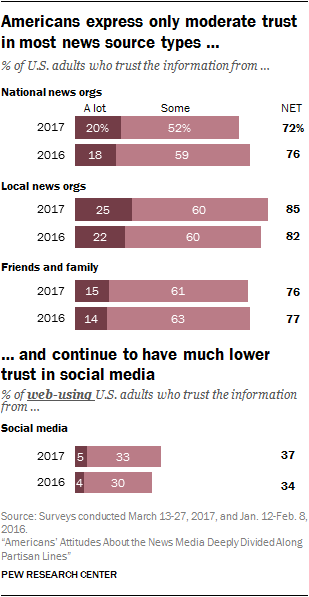
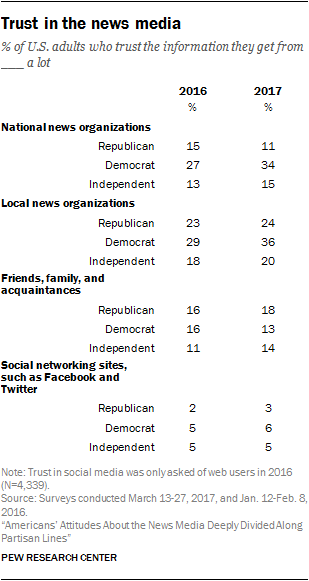
As in 2016, few Americans express high levels of trust in news they get from professional news organizations or from their social connections. Just one-fifth of adults say they trust information they get from national news organizations “a lot.” Slightly more (25%) say this of news from local news organizations, while slightly fewer (15%) place a lot of trust in the information they get from friends and family.

Lower than all three is social media. Even as we know Americans rely heavily on social media for their news – which is often at least partly filled by posts from friends and family – they continue to have very low trust in information from social networking sites. Just 5% of web-using U.S. adults have a lot of trust in the information they get there, nearly identical to the 4% who said so in 2016.

Among these four sources, trust of national news organizations has the largest partisan divide, and it grew substantially since 2016. Roughly a third of Democrats (34%) express a lot of trust in news they get from national news organizations, compared with just 11% of Republicans, a 23-point gap. In 2016, Democrats also reported higher rates of trust in the national news media, but the difference was more modest (27% compared with 15% among Republicans).

A party divide also exists in trust of local media, though to a lesser degree and without a sizable change in the party gap. About a third (36%) of Democrats trust local news media a lot, compared with nearly a quarter (24%) of Republicans – a 12-point gap. (Independents stayed roughly the same on both questions from 2016 to 2017.)

Democrats more likely than Republicans to give high job approval of national news organizations; more agreement on ratings of local news organizations

Similar to the level of trust in national news organizations, just 21% of Americans say the national news media do very well at keeping them informed. About half (54%) say they do fairly well, while the remainder say they do their job not too well (20%) or not well at all (4%).

These figures overall are consistent with 2016 but there is now some distance between the parties. A third of Democrats now say the national media do very well at informing them, compared with only 18% of Republicans who say the same, a 15-percentage-point gap. (There was no significant difference between the parties in 2016.) And it is driven by older members of both parties. The percentage of Republicans ages 50 and older that give the national news media top marks declined by 10 points from 2016 to 2017; among Democrats of this age group, approval rose 11 percentage points.

When it comes to local news media, the partisan split is much smaller and unchanged from 2016. Overall, 23% of adults say local news organizations do very well at keeping them informed. That sentiment is expressed by 29% of Democrats, only slightly higher than the 22% of Republicans who say so, with each party’s figures little changed since 2016 (21% overall, 25% of Democrats and 22% of Republicans).

2. Interest in national news increases sharply among Democrats

Partisan differences are evident not just in Americans’ news attitudes but also in their news practices.

Interest in national news increased over the past year, with four-in-ten Americans now saying they very closely follow national news, compared with a third in 2016. The growth occurred almost solely among Democrats, whose rate of interest jumped 16 points from 33% then to 49% today.

And it is older rather than younger Democrats who are paying closer attention. Sharp increases occurred among both Democrats ages 35 to 49 (from 26% who followed national news very closely in 2016 to 44% in 2017) and Democrats 50 and older (from 41% in 2016 to 63% in 2017), while there was no significant change among Democrats ages 18 to 34.

The heightened overall interest in national news does not carry through to local, neighborhood or international news. Interest in local news actually saw a slight decline (33% follow local news very closely, compared with 37% in 2016) while interest in international and neighborhood did not change significantly. There were also no party-line changes here other than among independents whose interest in local news fell 9 points from 2016 (35% saying they very closely follow local news) to 2017 (26%). (Topline numbers available here and party breakdowns can be found in the detailed tables.)

Use of mobile devices for news continues to grow

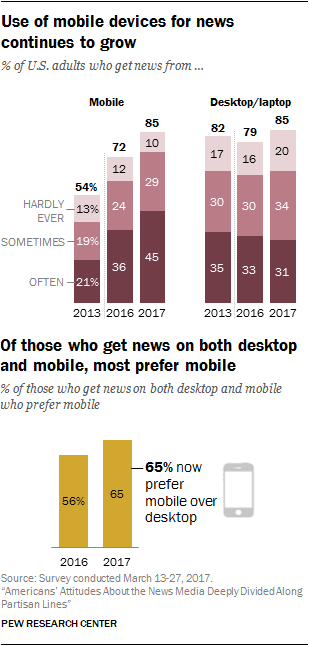
Today, fully 45% of U.S. adults often get news on a mobile device. That is up from 36% in 2016 and 21% in 2013. The use of desktop or laptop computers for news remains steady, with 31% saying they do so often.

In all, 85% of Americans ever get news on a mobile device, the same proportion who do so on a desktop computer. And, among those who get news both ways, mobile devices are increasingly preferred. Nearly two-thirds (65%) of U.S. adults who get news on both mobile and desktop prefer mobile. This is up from 56% in 2016. (The question was not asked in 2013.)

This increase in mobile news use occurred only among Democrats: While 37% of Democrats said they got news often on mobile devices in 2016, 52% say so today – a 15-point increase. (The gains here were not due to the fact that Democrats tend to be younger than Republicans; in fact, the largest gains were seen among Democrats 50 and older.)

Preference for mobile over desktop grew equally among both Democrats and Republicans.

News organizations are a larger part of online news consumption, especially among Democrats

To get a better sense of the flow of news online, we asked those who ever get news on a digital device (whether on a desktop computer or mobile device) how often they get digital news from news organizations, from people they are close with and from people they are not close with.

Among the three, news organizations sit at the top as a frequent source for online news and also experienced the largest increase from 2016.

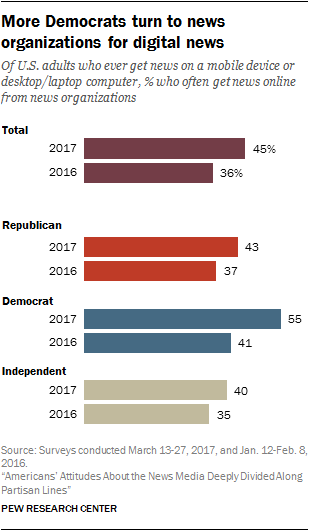
Nearly half of digital news users (45%) often get news from news organizations, up from 36% in 2016. As with interest in national news, this increase is driven primarily by Democrats (55% often get news this way today, up from 41% in 2016). No significant shifts occurred among Republicans or independents.

The share of online news consumers who often get news there from people they know well remained roughly the same as it was last year (16% today, 15% in 2016), including within both political parties. And there was only a small change in the proportion of Americans who say they often get news from people they don’t know well: 9% today compared with 6% in 2016, with small growth across Republicans, Democrats and independents. (Topline numbers are available here and party breakdowns can be found in the detailed tables.)

Online news consumers were next asked to rate the accuracy of the news they get from each of those three types of sources (news organizations, people you know well and people you don’t know well). Democrats, who as noted are turning to news organizations online at higher rates than Republicans, also give these outlets higher marks for accuracy. A third of digital-news-using Democrats who turn to news organizations for online news rate this news as very accurate, compared with 8% of Republicans who get online news that way.4 There was also a wide gap in 2016, though not to the same degree (22% of Democrats who got news online from these sources versus 10% of Republicans). Republicans and Democrats did not differ in their accuracy ratings of the other two source types. Overall, among those who get news from each source, there were no significant year-over-year changes in accuracy ratings (full data available in the topline).

The survey also asked about the degree of balance in the political news Americans get from family and friends online: Does it represent just one side, or multiple sides? Overall, 40% of Americans say their social circle posts primarily one-sided news. This represents a small rise from 2016, when 35% said this, with Republicans and Democrats equally likely to say this both years.

All in all, then, news from one’s personal circle remains one area in which Democrats and Republicans largely agree and which saw little year-to-year change.

In judging the trustworthiness of a story, Americans take a variety of considerations into account

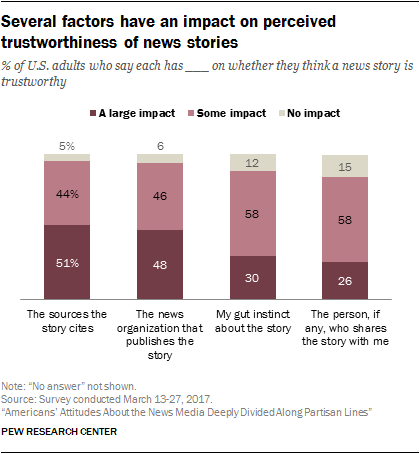
Among four possible considerations individuals could take into account when deciding whether or not a story is trustworthy, each has at least some impact among sizeable majorities of Americans. Two of the four, however, stand out as being more likely to have a large impact. About half of U.S. adults say the sources the story cites (51%) and the story’s publisher (48%) have “a large impact” on trust. Three-in-ten say their gut instinct about the story has a large impact, while about a quarter (26%) say they look to the person who shared the story as a major factor in determining whether they trust it.

Democrats are more likely to give the sources a story cites a lot of weight in judging its trustworthiness (58%, compared with 48% of Republicans) and the same holds true for what news organization publishes the story (56%, versus 47% of Republicans). Both parties, however, have these two factors at the top of their lists. On the other hand, Republicans are more likely than Democrats to cite their gut instinct: About four-in-ten Republicans (38%) say this has a large impact, compared with about a quarter of Democrats (26%). Republicans rank “gut instinct” higher than the person who shared the story, while Democrats cite both as large impacts at roughly the same rate.

Other data add nuance to these findings and suggest that who shares the story might sometimes be a larger factor in assessing accuracy than it appears here. Previous studies have shown that online news consumers are more likely to take a follow-up action (such as searching for more information) when a news story comes from a friend or family member than when it comes directly from a news organization, and that friends’ recommendations play a larger role than news outlets’ reputations in motivating someone to click on a link to a news story on Facebook.

Acknowledgments

Pew Research Center is a subsidiary of The Pew Charitable Trusts, its primary funder. This report was made possible by The Pew Charitable Trusts, which received support from the John S. and James L. Knight Foundation’s “Initiative on Trust, Media and American Democracy,” a collaboration between the Knight Foundation, the Ford Foundation, Bill & Melinda Gates Foundation and the Open Society Foundations.

This report is a collaborative effort based on the input and analysis of the following individuals.

Amy Mitchell, Director, Journalism Research Michael Barthel, Research Associate Elisa Shearer, Research Analyst Jeffrey Gottfried, Senior Researcher Katerina Matsa, Senior Researcher Kristine Lu, Research Assistant Allison Becker, Research Assistant Rachel Weisel, Communications Manager Hannah Klein, Communications Associate Margaret Porteus, Information Graphics Designer Shannon Greenwood, Associate Digital Producer

Methodology

The American Trends Panel (ATP), created by Pew Research Center, is a nationally representative panel of randomly selected U.S. adults who participate via monthly self-administered web surveys. Panelists were recruited from landline and cellphone random-digit-dial surveys. Panelists who do not have internet access are provided with a tablet and wireless internet connection. The panel is being managed by Abt SRBI.

Data in this report are drawn from the panel wave conducted March 13-27, 2017, among 4,151 respondents. The margin of sampling error for the full sample of 4,151 respondents is plus or minus 2.7 percentage points.

Members of the American Trends Panel were recruited from two large, national landline and cellphone random-digit-dial (RDD) surveys conducted in English and Spanish. At the end of each survey, respondents were invited to join the panel. The first group of panelists was recruited from the 2014 Political Polarization and Typology Survey, conducted Jan. 23 to March 16, 2014. Of the 10,013 adults interviewed, 9,809 were invited to take part in the panel and a total of 5,338 agreed to participate.5 The second group of panelists was recruited from the 2015 Survey on Government, conducted Aug. 27 to Oct. 4, 2015. Of the 6,004 adults interviewed, all were invited to join the panel, and 2,976 agreed to participate.6

The ATP data were weighted in a multi-step process that begins with a base weight incorporating the respondents’ original survey selection probability and the fact that in 2014 some panelists were subsampled for invitation to the panel. Next, an adjustment was made for the fact that the propensity to join the panel and remain an active panelist varied across different groups in the sample. The final step in the weighting uses an iterative technique that aligns the sample to population benchmarks on a number of dimensions. Gender, age, education, race, Hispanic origin and region parameters come from the U.S. Census Bureau’s 2015 American Community Survey. The county-level population density parameter (deciles) comes from the 2010 U.S. Decennial Census. The telephone service benchmark comes from the January-June 2016 National Health Interview Survey and is projected to 2017. The volunteerism benchmark comes from the 2015 Current Population Survey Volunteer Supplement. The party affiliation benchmark is the average of the three most recent Pew Research Center general public telephone surveys. The Internet access benchmark comes from the 2015 Pew Survey on Government. Respondents who did not previously have internet access are treated as not having internet access for weighting purposes. Sampling errors and statistical tests of significance take into account the effect of weighting. Interviews are conducted in both English and Spanish, but the Hispanic sample in the American Trends Panel is predominantly native born and English speaking.

The following table shows the unweighted sample sizes and the error attributable to sampling that would be expected at the 95% level of confidence for different groups in the survey:

Sample sizes and sampling errors for other subgroups are available upon request.

In addition to sampling error, one should bear in mind that question wording and practical difficulties in conducting surveys can introduce error or bias into the findings of opinion polls.

The March 2017 wave had a response rate of 80% (4,151 responses among 5,177 individuals in the panel). Taking account of the combined, weighted response rate for the recruitment surveys (10.0%) and attrition from panel members who were removed at their request or for inactivity, the cumulative response rate for the wave is 2.6%.7

The following table shows the dates for the phone trends for the watchdog and bias questions.

Appendix A: Detailed tables