Pew Research Center

FOR RELEASE MAY 5, 2016

Long-Form Reading Shows Signs of Life in Our Mobile News World

On cellphones, longer news stories get about twice the engaged time from readers as shorter pieces do. They also get roughly the same number of visitors.

BY Amy Mitchell, Galen Stocking and Katerina Eva Matsa

FOR MEDIA OR OTHER INQUIRIES:

Communications Department
202.419.4372
www.pewresearch.org

RECOMMENDED CITATION

Pew Research Center, May 2016, "Long-Form Reading Shows Signs of Life in Our Mobile News World"

About Pew Research Center

Pew Research Center is a nonpartisan, nonadvocacy fact tank that informs the public about the issues, attitudes and trends shaping the world. It does not take policy positions. The Center conducts public opinion polling, demographic research, computational social science research and other data-driven research. It studies politics and policy; news habits and media; the internet and technology; religion; race and ethnicity; international affairs; social, demographic and economic trends; science; research methodology and data science; and immigration and migration. Pew Research Center is a subsidiary of The Pew Charitable Trusts, its primary funder.

© Pew Research Center 2026

Table of contents

  • About Pew Research Center
  • Long-Form Reading Shows Signs of Life in Our Mobile News World
  • 1. Digital readership data and what it can tell us
  • 2. Analysis suggests some readers’ willingness to dig into long-form news on cellphones
  • 3. Users spend more time with content in the morning or late at night
  • 4. Cellphone news users spend the most time reading long-form content when arriving at an article from an internal link, least time when arriving via a social network
  • 5. On cellphones, return visitors spend more time with articles than visitors overall
  • 6. Most interactions begin within one week of publication
  • 7. Few cellphone readers of long- or short-form articles visit multiple articles on a site
  • 8. Engaged time with long-form news varies by topic
  • Acknowledgments
  • Methodology
  • Appendix A: Detailed Tables
  • Appendix B: Terminology

Long-Form Reading Shows Signs of Life in Our Mobile News World

On cellphones, longer news stories get about twice the engaged time from readers as shorter pieces do. They also get roughly the same number of visitors.

In recent years, the news media have followed their audience’s lead and gone mobile, working to make their reporting accessible to the roughly seven-in-ten American adults who own a smartphone. With both a smaller screen size and an audience more apt to be dipping in and out of news, many question what kind of news content will prevail.

U.S. public show signs of engaging with long-form articles on cellphones

One particular area of uncertainty has been the fate of long, in-depth news reports that have been a staple of the mainstream print media in its previous forms. These articles – enabled by the substantial space allotted them – allow consumers to engage with complex subjects in more detail and allow journalists to bring in more sources, consider more points of view, add historical context and cover events too complex to tell in limited words.

This is not to say that all long-form news accomplishes the above or that short-form does not have its own value. But, in a news environment so dramatically different from past forms, the question is worth exploring: Will people engage with lengthy news content on their phones?

A unique, new study of online reader behavior by Pew Research Center, conducted in association with the John S. and James L. Knight Foundation, addresses this question from the angle of time spent with long- versus short-form news. It suggests the answer is yes: When it comes to the relative time consumers spend with this content, long-form journalism does have a place in today’s mobile-centric society.

To understand how mobile users interact with news, the study utilized audience behavior metrics provided by the web analytics firm Parse.ly, a company that supplies real-time and historical analytics to a broad mix of digital publishers, including over 170 top media companies.

All told, Center researchers spent months digging deeply into the details of 117 million anonymized, complete cellphone interactions with 74,840 articles from 30 news websites in the month of September 2015.

The scope of Pew Research Center’s study of Parse.ly data

The analysis finds that despite the small screen space and multitasking often associated with cellphones, consumers do spend more time on average with long-form news articles than with short-form. Indeed, the total engaged time with articles 1,000 words or longer averages about twice that of the engaged time with short-form stories: 123 seconds compared with 57.1

This gap between short- and long-form content in engaged time remains consistent across time of day and the pathway taken to get to the news story. However, when looking solely within either short- or long-form content, engaged time varies significantly depending on how the reader got to the article, whether it is midday or evening, and even what topic the article covers, according to the study.

While 123 seconds – or just over two minutes – may not seem long, and a far cry from the idealized vision of citizens settling in with the morning newspaper, two minutes is far longer than most local television news stories today. And that print newspaper over which people linger contains many separate stories, not just one. In addition, our analysis indicates that this metric almost certainly underestimates the real time spent reading or watching a news story. Specifically, the Parse.ly metrics capture screen movements such as scrolling or clicking, within 5.5 second intervals. While more precise counts of actual user engaged time may still be out of reach with existing methods, what is of most value is the relative difference that emerges between long- and short-form stories. And here the conclusion across this dataset is consistent: People are spending more time on longer stories than on shorter ones, suggesting that engagement can expand to meet the demands of a more in-depth piece.

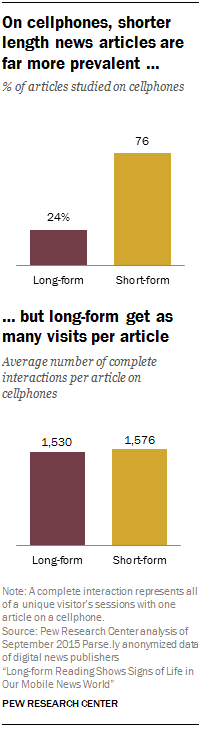
The data also reveal that while shorter news content is far more prevalent than long-form and thus draws more total traffic, long-form articles are accessed at nearly the same rate. Fully 76% of the articles studied were fewer than 1,000 words in length. But, article for article, long-form stories attract visitors at nearly the same rate as short-form: 1,530 complete interactions per long-form article and 1,576 per short-form.

Among the additional key findings:

  • Across all five distinct parts of the day, readers spend about twice the time with long-form news content on their cellphones as with short-form. For both story lengths, they spend the longest average engaged time in the late night and morning hours: 128 seconds late at night for stories 1,000 words or longer and 60 seconds for stories shorter than 1,000 words. In the morning, the figures are 126 seconds and 59 seconds, respectively.
  • The gap between long- and short-form engaged time also persists across all five ways visitors can arrive at news articles (such as through a link from an external website, social media, search etc.) – though those who follow a link on their phone from within the same website spend the greatest amount of time with an article. Long-form news readers spend an average of 148 seconds with a news article when arriving there from an internal link. That falls to 132 seconds for those who visit the article directly or follow an email link, 125 when arriving from an external website, 119 from search and 111 from social media. For short-form reading, the average times are lower but social media is again at the bottom. Nonetheless, social media sites drive the largest share of traffic overall – accounting for roughly 40% of cellphone visitors to both short- and long-form news.
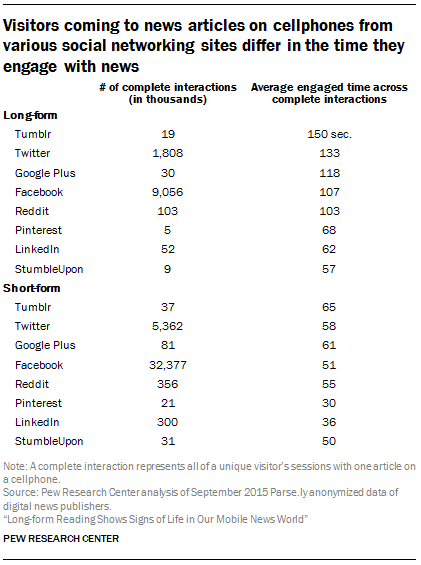
  • There are some noteworthy differences in the nature of the visits coming from two of the larger social networking sites – Facebook and Twitter. While Facebook drives more traffic, Twitter tends to bring in people who spend more time with content. For longer content, users that arrive from Facebook spend an average of 107 seconds, compared with 133 seconds when they come from Twitter. The same pattern emerges with shorter content: Those arriving from Twitter spend more time with that content (58 seconds) compared with those coming from Facebook (51 seconds). Yet, for both short- and long-form content, Facebook referrals drive about eight-in-ten initial visits from social media sources, while Twitter drives about 15%.
  • Just a small fraction of users who access either a short- (3%) or long-form (4%) news story on their phone return to it on that phone, but those who do tend to spend more time with it than users overall. Return visitors to long-form articles spent 277 seconds with the article compared with 123 seconds for users overall. For short-form content, return visitors spent an average of 110 seconds of engaged time with the article compared with 57 seconds for users overall.
  • Both long- and short-form news articles tend to have a very brief life span. Fully 82% of interactions with short-form articles begin within the first two days after publication, as did 74% of long-form interactions. By day three, that rises to 89% of short-form interactions and 83% of long-form interactions.
  • An overwhelming majority of both long-form readers (72%) and short-form readers (79%) view just one article on a given site over the course of a month on their cellphone. Users who visited at least one long-form article are somewhat more likely to view multiple articles on their cellphone than those who initially accessed a short-form article, but the numbers for both are small: 28% and 21% respectively.

Working with large, organic datasets like the one for this project require, at the outset, critical structural and methodological decisions, as well as data organization and cleaning. This includes developing an in-depth understanding of how the data are collected, recorded, and structured and what research questions the data speak to most clearly. An in-depth discussion of the methodology behind this study can be found here. There is also a glossary of the terms and measures referred to throughout this report. Readers can click a glossary term any time it appears to review the terminology.

Terminology

Short-form: Articles with a word count of 101 – 999 words. (Those with 100 or fewer words were removed due to their greater potential of containing anomalous data.)

Long-form: Articles with a word count of 1,000 words or more.

Cellphone: Defined by Parse.ly as a broad category encompassing mobile devices that are not desktop/laptop computers, tablets or other devices that can connect to the web. Cellphones are primarily comprised of smartphones, such as Apple’s iPhone, Samsung’s Galaxy S series or other manufacturers such as HTC, Motorola, Microsoft and Blackberry. All traffic analyzed in this study is based on visits to news websites via mobile browser apps on cellphones. It does not include interactions via “native” mobile news apps.

Unique visitors: Unique number of individuals visiting a web page on a cellphone. Parse.ly uses first-party cookies to track a user within a website on a particular device. Each individual is counted only once, though they may have visited the site more than once during September 2015.

Page activity: An individual’s interaction with the page, measured as screen movement such as scrolling, clicking or tapping.

Session: An individual’s page activity on an article over an indefinite time period, which expires when there has been no activity for 30 minutes. A session includes visits to multiple pages within the article, as well as instances when the user visits the page, leaves for another site or app, but returns within 30 minutes of his or her last activity. Thus, if a user visits one article, pauses for 10 minutes and then returns, that is still considered one session.

Complete interaction: All of a unique visitor’s sessions with one article on a cellphone. In some cases, such as time of the day, we looked at the combined sessions for that particular daypart. For example, if a user read an article over multiple sessions during the morning, we combined these sessions to analyze the activity that took place within that specific daypart.

Return visitors: Visitors who visit an article more than once on the same cellphone. This is tracked by using a web cookie, which uniquely identifies each user’s web browser. A visit is a return visit if it begins at least 60 minutes after the start of the preceding session.

Engaged time: An indicator of the time a user spends with content, as measured by page activity. In other words, this refers to any time that a user spends “engaged” – meaning scrolling, clicking or tapping – with a web page. In the current dataset, a pause in the accumulation of engaged time is set at 5.5 seconds of unengaged time on a page, with engaged time resuming if or when there is action again.

Mean (average) engaged time: An indicator of the overall time spent with a page, this is calculated by taking all visitors’ total engaged time, adding it together and then dividing by the number of visitors. Most analyses of engaged time use this metric.

Median engaged time: An indicator of the overall time spent with a page, this ranks all user activity with a page by engaged time and identifies the engaged time value that is the most typical or falls in the middle (the middle value).

Referral: The pathway a visitor takes to initially land upon a news article. In this study, there are five distinct types of referrals:

  • Direct: A visitor accesses an article by directly typing the URL address into the browser; selecting a bookmarked URL; or clicking on a URL in an email, instant message or other non-web based link.
  • Internal: A visitor accesses an article from an internal link, meaning a web page that has the same domain (i.e., a page that has the same base URL).
  • Search: A visitor follows a link from a search engine such as Google or Bing.
  • Social: A visitor follows a link from a social networking site such as Facebook, Twitter, Google Plus, LinkedIn, Pinterest Reddit or others.
  • External website: A visitor follows a link from other websites that do not fall under any of the previous categories.

Daypart: Each visitor’s activity was classified into one of five dayparts – or periods of the day –based on their local time zone, if identifiable to the zip code level by the user IP address. These dayparts are:

  • Morning (4:00 a.m. – 9:59 a.m.)
  • Midday (10:00 a.m. – 3:59 p.m.)
  • Evening (4:00 p.m. – 7:59 p.m.)
  • Nighttime (8:00 p.m. – 11:59 p.m.)
  • Late night (12:00 a.m. – 3:59 a.m.)

Lifespan: This refers to the time between an article’s publication date and each visitor’s visits to an article. In this study, we looked at articles with visits in September 2015.

Articles: Online news stories published by a mix of 30 news organizations that are Parse.ly clients. The data include all articles of 101 words or more published between April 1 and Sept. 30, 2015, that met a minimum threshold of U.S.-based page views in the month of September 2015. For short-form articles, the minimum threshold was 100 views on any device and with at least one cellphone view; the respective number for long-form was 25 views. Stories 100 words or fewer were removed due to the high number of photos, headlines and slideshows, which introduced errors into the engaged time metric.

Video and audio news content could be included if it met the minimum word threshold of 101 words and the user somehow activated the screen through a touch or a scroll before the 5.5 second cutoff. It is likely, though, that in most cases a user would hit that 5.5 seconds of inactivity, therefore ending the session. Thus, most of the measures here tell us more about time reading than time spent watching or listening to news.
1. Digital readership data and what it can tell us

One of the less high-profile benefits of the news media’s move to online content is the fact that it has provided media researchers with an important tool: Readers now leave a digital footprint, meaning that researchers no longer need to rely only on a reader’s self-reports of what they saw, heard or read that day. A typical news website, for example, can tell you how many people read any specific article, at what times of day, how long they spent there and from where in the digital world they arrived. Amid this avalanche of news data, audience metric companies arrived on the scene to help individual organizations make sense of their own data and to provide a consistent way of measuring and interpreting behavior across numerous websites. One of these companies is Parse.ly, which agreed to share anonymized September 2015 data from 30 of their diverse news media clients with Pew Research Center. With this data, the Center sought to help answer a specific question: Are mobile readers – those accessing stories on their smartphone – actually going to and spending time with the long-form journalism available on these news websites, or is short and sweet the hallmark of the new news?

Before delving deeply into the findings, it is worth acknowledging and laying out the specific metrics involved, what each represents and how we use them in this analysis.

The 30 news websites studied here, while not fully representative of all news organizations or of all digital news users, include a mix of general and subject-specific news sites, news organizations that have non-digital arms (such as a print newspaper), digital-only news entities and sites with large national audiences, as well as those with smaller, niche user bases. The study analyzed all articles longer than 100 words that were published on these sites and met a minimum threshold of page views in September 2015. 2 This resulted in 74,840 articles accessed by 71 million visitors on cellphones. Roughly a quarter of the articles, 24%, contain 1,000 words or more and are thus considered long-form for the purposes of this project.

These data include measures for unique visitors, sessions with an article and complete interactions with a given article, all key terms that are defined below.

The unique visitor metric (also referred to simply as visitor) reflects the total number of individuals that visited a particular website, as identified by first-party cookies, on a particular device during the month studied.3 This means that even if an individual visited multiple articles on a website, they are counted once.

The article count represents the full article, regardless of how many different pages that article might include.

A session rolls up all of the visits to a news article by an individual until the user hits 30 minutes of inactive time. Thus, if a user visits one article, pauses for 10 minutes and then comes back, that is still considered one session.

The complete interaction consists of all these different sessions with an article at the user level. Most of this analysis is based on the complete interaction with an article, i.e. all of a unique visitor’s sessions with one article on a cellphone. 4 In some cases, such as time of the day, researchers looked at the combined sessions for a particular daypart. For example, if a user read an article over multiple sessions during the morning, these sessions were combined to analyze the activity that took place within that specific daypart.

Another central metric in this analysis is engaged time. This captures how much time a user spends with content by tracking cursor movement, clicking and scrolling. The metric enables us to better understand the complexities of users’ behaviors with different types of news stories under different circumstances, such as time of day. Researchers conducted the analysis using two calculations: median and mean. The mean, or average, is calculated by taking all visitors’ engaged time, adding it together and then dividing by the number of visitors. By that accounting, extreme values of engaged time or length of the article might heavily influence the numbers. For that reason, we also looked at the median, which examines all the engaged time numbers in our data corpus and identifies which one is most typical or falls in the middle (the middle value). In some cases, the median is a better indicator of central tendency, such as when there are extremely high or low observations in the distribution. For this report, researchers made a number of methodological decisions to improve the structure of the data. What was found is that the differences between the mean and the median did not alter the pattern and findings of the data. Therefore, throughout the report, researchers are using the mean as the principal statistic for the analysis.

2. Analysis suggests some readers’ willingness to dig into long-form news on cellphones

Given the increasing use of mobile devices for online news and the physical challenge of engaging with long-form content on the relatively small screen size of most mobile devices, media analysts have wondered whether there is a future for heftier, more substantial pieces of journalism. One way to test this is to measure the length of time that mobile readers spend with shorter articles compared with longer ones: If the average engaged time for long- and short-form articles is about the same, then one might presume that there is some natural attention limit beyond which a typical newsreader on their cellphone is unwilling to go. If there is a difference, that suggests that readers may be willing to commit more time to a longer piece of work, up to some unknown threshold.

According to the new Pew Research Center study of anonymized data from 30 news websites as measured by the web analytics company Parse.ly, there is evidence that long-form content does garner lengthier attention. Across the 117 million complete cellphone interactions with news articles studied here, longer articles, those that are 1,000 words or more, display higher levels of overall visitor engagement than shorter articles (those between 101 and 999 words). 1 The average engaged time spent with long-form news stories on a cellphone is 123 seconds, about twice that of the 57 seconds for short-form content. 2

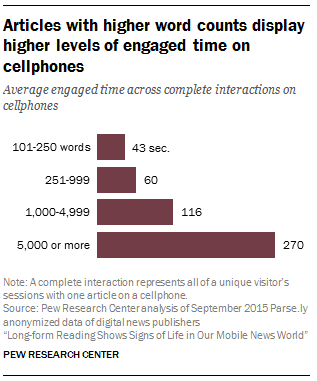
Articles with higher word counts display higher levels of engaged time on cellphones

What’s more, when we slice the word count more finely, engaged time increases steadily as word count of the articles increases, from a low of 43 seconds for news stories between 101 and 250 words to a high of 270 seconds for stories that are 5,000 words or more. Visitors, in other words, spend nearly three times longer with articles between 1,000 and 4,999 words than with articles that are 250 words or fewer (116 seconds compared with 43 seconds) and spend the most time with articles that are 5,000 words or more – 270 seconds.

Additional evidence of long-form’s more lasting appeal emerges when we look at the portion of users spending various lengths of time with long- and short-form news.

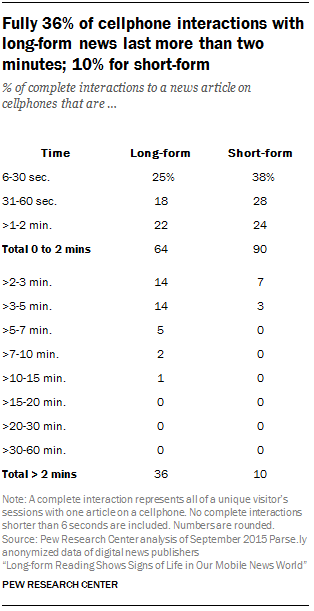
Fully 36% of cellphone interactions with long-form news last more than two minutes; 10% for short-form

For short-form articles, about four-in-ten complete interactions (38%) are 30 seconds or shorter; 90% are two minutes or shorter, while fewer than 1% last longer than five minutes.

Readers of long-form articles on cellphones tend to connect for a greater amount of time than readers of short-form. Just a quarter of these complete interactions are shorter than 30 seconds, while fully 36% extend beyond two minutes – compared with just 10% of short-form interactions. What’s more, 8% of complete long-form interactions are longer than five minutes, whereas virtually no short-form interactions persist this long.

What this suggests is that on small phone-sized screens, the public does not automatically turn away at a certain point in time – or reject digging into a longer-length news article. Rather, they tend to stay engaged past the point of where a short-form article would end.

On cellphones, shorter length news articles are far more prevalent …

One other related finding is that even though there is far more short-form content produced than long-form, visitors access long-form content on their phones at the same rate as they access short-form. Overall, short-form news stories represent 76% of the roughly 75,000 articles studied here (nearly 57,000 articles) and draw 76% of all complete interactions (89.5 million). Long-form articles account for 24% of all articles (about 18,000 articles) and attract 24% of all complete interactions (27.6 million). What this means is that although there are fewer long-form articles, they are visited at roughly the same rate as short-form articles: An average of 1,530 complete interactions per long-form article and 1,576 per short-form. In other words, article for article, long-form content attracts the same number of visitors as short-form content. This does not necessarily mean audiences are asking for more long-form content as there is a strong likelihood that most users are not aware of story length when they click on a link. Still, long-form articles do, whether through shares, bookmarks or other means, find their way to as many initial visitors as short-form.

3. Users spend more time with content in the morning or late at night

Mobile technology has allowed consumers to get news anywhere, and at any time, whether at work or home, while commuting or at a sports game. But are there certain times of day when Americans are more apt to engage with longer articles on their phones compared with shorter ones? And how does this match up with the times of day that articles get the most visits?

The public’s tendency to spend more time with articles 1,000 words or more than with shorter ones holds true across all parts of the day. In all five dayparts studied here, readers spend about twice as much time with long-form news content than with short-form.

For this part of the analysis, researchers first divided the day into five distinct time periods: morning (4 a.m. to 9:59 a.m.), midday (10 a.m. to 3:59 p.m.), evening (4 p.m. to 7:59 p.m.), nighttime (8 p.m. to 11:59 p.m.) and late night (midnight to 3:59 a.m.). We then examined the total time a user spent with an article within each time frame. This means that, for this analysis only, if a user interacts with an article at two different times in the morning and then comes back later in the evening, the total time of the two morning visits are counted as one interaction and the time for the evening visit as a separate interaction.

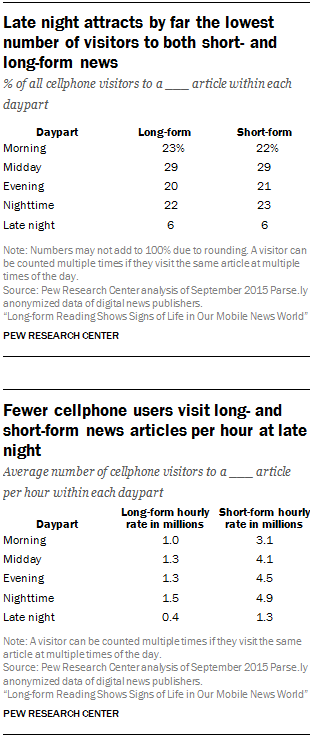
Late night attracts by far the lowest number of visitors to both short- and long-form news

For both story lengths, the longest average engaged time occurs in the late night and morning hours. For long-form reading, that amounts to 128 seconds late at night and 126 seconds in the morning, compared with 60 seconds and 59 seconds, respectively, for shorter stories. This stands out in particular, because late night attracts a smaller portion of visitors than any other daypart – just 6% of sessions with long-form news occur in the late night hours.

Looked at another way, which accounts for the different number of hours in each daypart, late night gets about 400,000 long-form readers per hour compared with 1 million or more per hour during every other daypart. Short-form visits are similarly less common during these late hours.

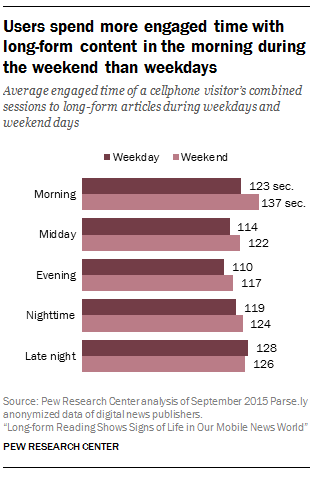
To help understand further the dynamics of long-form reading at different times of the day, we also looked at differences between weekend and weekday interactions. The data show that, overall, there is little difference in the time users spend with short or long news articles on weekends versus weekdays. On average, users spend 128 seconds with long-form content across Saturday and Sunday, 7 seconds longer than across the five days of the week. Time spent with short-form is nearly even between weekdays and weekends. On the weekend, then, the cellphone remains an enduring part of people’s long-form news consumption.

Users spend more engaged time with long-form content in the morning during the weekend than weekdays

When you break the analysis down further by time of day, a few subtle “weekend effect” differences do pop out for long-form reading. Mainly, on the weekend, morning time seems to have a little more staying power for long-form reading. Long-form readers spend 137 seconds of engaged time in the morning during the weekend, compared with 123 in the morning during weekdays. During the week, nighttime and late night average reading times are on par with morning.

4. Cellphone news users spend the most time reading long-form content when arriving at an article from an internal link, least time when arriving via a social network

Users can reach mobile news content through a variety of channels, including arriving at a given article by way of a link that shows up in their Facebook feed, via a Google search or clicking a bookmarked address. As the Center found in earlier research about desktop news behavior, it’s possible that for long-form content on cellphones, some pathways tend to lead to greater or lesser engaged time with an article.

In fact, the Pew Research Center analysis of Parse.ly data from 30 news sites finds that the greater time spent with long-form rather than short-form news articles on cellphones holds steady across the various ways individuals initially arrive at articles: whether through an internal link (a page that has the same base URL, i.e. a page within the same domain), by direct referral (typing in the URL, clicking a bookmark or following an email link), from an external website, from search or from social media sites.7

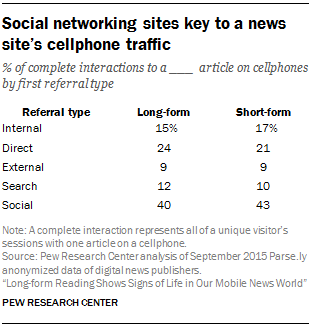
Social networking sites key to a news site’s cellphone traffic

For long-form news articles in particular, certain pathways on the phone yield greater engaged time than others. Those who arrive at a long-form article by following a link from another page within the same website – such as a homepage or a suggested link from another article – result in the greatest amount of time spent with the article, an average of 148 seconds. Those who follow a direct referral display the next greatest engaged time at 132 seconds. That is followed by an average of 125 seconds for those who came from a link to the article from another website (not including search or social sites), and 119 seconds for those coming from search engines. At the bottom are those coming from a social networking site, averaging 111 seconds per story – 25% shorter than those coming from an internal link.

There is less variation across pathways for short-form articles, with internal, direct, external, and search all averaging between 58 and 62 seconds. But, similar to long-form, visitors who first land on a news story from a social media site spend the least amount of total time with the article – an average of 52 seconds.

As was true for the analysis of engagement by time of day, the pathways that lead to users spending the most time with news articles are not always in sync with the pathways which drive the most overall traffic to news. For example, social media referrals generate the greatest number of visitors to a given news article – 40% for long-form and 43% for short-form – even though the analysis suggests those readers then spend the least time engaging with the content. That is followed by users arriving directly: 24% of visitors’ complete interactions to long-form and 21% of short-form. Those arriving from another place in the same domain account for 15% of cellphone visitors’ complete interactions to long-form articles and 17% to short-form. For both long and short content, the portion of visitors’ complete interactions that started from search and external websites range from 9% to 12%.

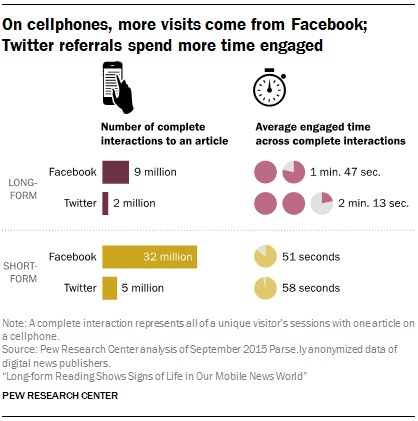
On cellphones, more visits come from Facebook; Twitter referrals spend more time engaged

When it comes to social media, there are some noteworthy differences in the way people coming from each of the two larger social networking sites – Facebook and Twitter – interact with news. While Facebook drives more traffic to news articles in this study, Twitter tends to bring in people who spend more time with the content.

Facebook, by far, sends a greater volume of readers to both short-form and long-form news. Overall, about eight-in-ten user complete interactions with a news article via a social networking site come from Facebook (82% long-form and 84% short-form), while a much smaller portion come from Twitter (16% long-form and 14% short-form). But, when it comes to time spent with the article, Twitter referrals outpace Facebook. For longer content, users that arrive from Facebook spend an average of 107 seconds, compared with 133 seconds when they come from Twitter, a 24% difference. In shorter content, the same pattern emerges. Those arriving from Twitter spend more time with that content (58 seconds) compared with those coming from Facebook (51 seconds).

Visitors coming to news articles on cellphones from various social networking sites differ in the time they engage with news

The remaining social networking sites account for only a small fraction of an article’s traffic. For both long-form and short-form content, LinkedIn, Google Plus, StumbleUpon, Reddit, Tumblr and Pinterest combined traffic yields 2% of the total social referrals. Despite the low traffic coming from these social networking sites, some send users who spend relatively high levels of engaged time. Referrals to long-form news from Tumblr, for example, yield an average of 150 seconds, surpassing both Facebook and Twitter. Google Plus, on the other hand, falls in between Facebook and Twitter at 118 seconds of engaged time on average.

5. On cellphones, return visitors spend more time with articles than visitors overall

Another question that arises in mobile digital news consumption is how often users return to an article – whether to finish reading it, re-read a portion, share it with a friend or for some other reason. This is again especially pertinent for long-form news, which requires more time to complete.

Due to the way users are tracked, these metrics are only able to track return visits to articles on the same device as the initial visits – in this case, the same cellphone. Even with this limitation, though, the data do help shed light on how often it occurs and what difference it tends to make in the total engaged time.

Of the nearly 71 million cellphone users in our corpus, only a small fraction returned to an article. Just 3% of short-form readers came back to a short-form article and 4% of long-form readers returned to a long-form article. But those that do return end up spending more time with an article than those whose full interaction occurs within one session – especially when reading long-form articles.8

Long-form readers who return to a long-form article spent about double the time with an article as users overall, 277 seconds compared with 123 seconds.9 This is a bit sharper of an increase than for short-form article returners, though their average engaged time was still nearly twice that of overall users, 110 seconds compared with 57 seconds.

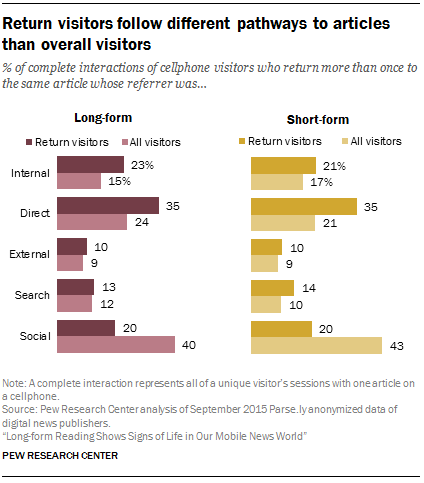
Return visitors follow different pathways to articles than overall visitors

The vast majority of these returns occurred on the same day as the interaction’s first visit: about eight-in-ten long-form and short-form returners (81% of each) came back to an article the same day they first visited it. Another 8% of each returned on the second day and 3% on the third day.

One stark difference between returners and overall visitors on cellphones is in the way these different groups of users first land upon an article.

Among both short and long-form return cellphone visitors, the greatest percentage of complete interactions from article returners, 35% each, begin with a user who come through a direct referral. About a quarter (23%) of complete interactions came from return long-form readers who arrived at an article through a link from elsewhere on that site (21% for short-form returners), while another 20% for both types arrived from a social networking site.

This is a very different distribution than the complete interactions by visitors overall, who, as discussed earlier in the report, most commonly arrive at both short- and long-form news stories by following a link on a social networking site (roughly four-in-ten of each). And users overall are less likely to arrive at an article directly. This suggests that while social drives much of the overall traffic, these users are less likely to keep an article in mind and develop a recurring interest in it. This may help explain why the average time spent with short-form articles for social media users is lower than for any other pathway, – social networks drive traffic, but don’t necessarily tap into deep-seated interests.

6. Most interactions begin within one week of publication

Among cellphone users, longer articles – those that are at least 1,000 words – tend to have a somewhat longer life span than shorter ones, though for both the life span is remarkably brief.

To examine this, we looked at the time between an article’s publication date (for articles published in September) and each cellphone user’s initial visit to that article.

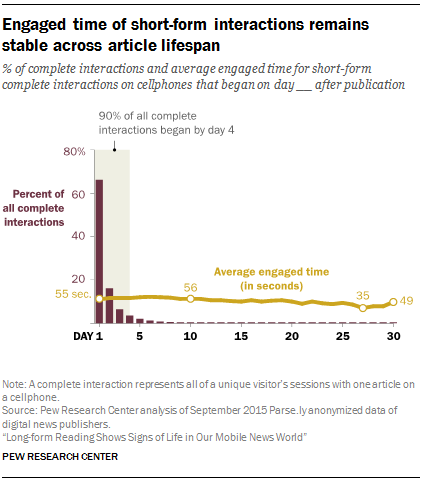
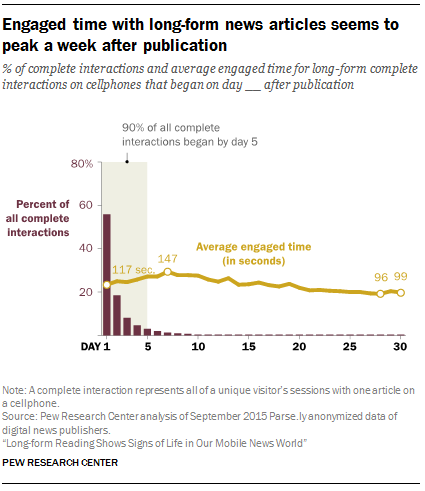
Fully 82% of interactions with short-form articles began within the first two days after publication, as did 74% of long-form interactions. By day three, that rises to 89% of short-form interactions and 83% of long-form interactions. Indeed, just 6% of short-form interactions and 10% of long-form interactions began more than five days after an article was published.

This small portion of users who find these articles later tend to spend about the same amount of time – and in some cases more time – with them.

Engaged time of short-form interactions remains stable across article lifespan

The total time spent with short-form news (fewer than 1,000 words) hovers around 58 seconds throughout the first 10 days after publication. After day 11, average engaged time slowly drops off until it reaches a low of 35 seconds on day 27 before a slight uptick through the remainder of the month (although there are fewer than 100,000 interactions during the last few days).

Engaged time with long-form news articles seems to peak a week after publication

Time spent with longer news stories on cellphones shows somewhat more fluctuation. In the first week after publication, the average time cellphone users spent with a given article steadily increased, from 117 seconds on the first day of publication to 147 seconds on day seven. But engaged time then steadily declined, falling to 96 seconds on day 28 before a slight uptick for the remainder of the month.

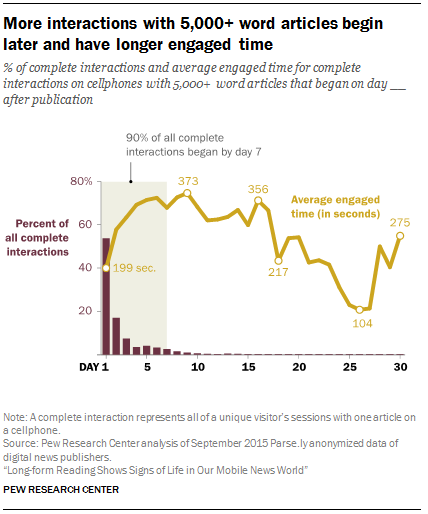
More interactions with 5,000+ word articles begin later and have longer engaged time

The trend of increased engaged time during the first week after publication is even more pronounced for articles that are 5,000 words or longer. For these news stories, average engaged time increases from 199 seconds the day of publication to 373 seconds 8 days later, an increase of 87%. After this point, average engaged time becomes more erratic, as the number of visitors drops below 10,000 each day.

The data do not speak to why average engaged time peaks later for long-form articles than for short-form articles. One possible explanation is that the small portion of users that visit an article much later may be highly interested in the article’s topic and thus spend more time with it.

7. Few cellphone readers of long- or short-form articles visit multiple articles on a site

News outlets are often interested in not just how well an individual article captures a user’s attention, but how likely a user is to continue to turn to their outlet for news. To answer this question, we looked at the number of cellphone users who viewed more than one article on a site – whether short- or long-form.

Visitors to long-form articles were somewhat more likely to view multiple articles on a site than visitors to short-form articles. However, this does not necessarily mean that long-form reading cultivates site loyalty. Nearly three-in-ten cellphone users who visited at least one long-form article viewed multiple articles on the site. On the other hand, about one fifth (21%) of users who viewed at least one short-form article did so.

8. Engaged time with long-form news varies by topic

Within longer news articles, Center researchers were interested in learning how engaged time on cellphones varies across different news topics.

To study this, researchers manually coded the news topic for a random sample of 17% of articles 1,000 words or longer with at least one cellphone visit. That resulted in 3,118 articles and nearly 4 million complete interactions.10

We also separated the articles into those that are 1,000 to 4,999 words and those that are 5,000 or more, to help get a more refined sense of engaged time as the word length increases.

The findings suggest some differences in the time people spend with different news topics on their phones, including which topics continue to build engaged time as the story length increases beyond 5,000 words. (For some of these topics the total number of stories over 5,000 words is quite small, though in every case the number of complete cellphone interactions analyzed totals more than 3,000. Still, the findings should be considered in context and more suggestive than definitive. The accompanying chart includes both the number of stories and number of complete interactions for each topic at both the 1,000 to 4,999 and 5,000+ levels.)

Among long-form stories between 1,000 and 4,999 words, average engaged time on cellphones ranges from a low of 97 seconds for economic and business stories to a high of 166 seconds for crime stories – which in most cases went beyond the general recounting of a crime event to discuss the nuances or background of a case in greater detail.

What is more striking, though, is how that average engaged time either increases, declines or stays roughly the same as the word count grows. In other words, how long are cellphone readers willing to stick around as a story lengthens, and does this differ by topic?

Most topic areas see at least some uptick in time spent, though to varying degrees. Crime again stands out with the highest average engaged time. While there are just three stories in this sample – each of which used specific criminal cases as a lens to explore broader political issues like the death penalty – they drew more than 20,000 complete interactions which averaged longer than 8 minutes (490 seconds). Readers also devoted more time to especially long foreign politics stories, though to a lesser degree than readers of crime stories: An average of 342 seconds or just over five and a half minutes across the 17,000 interactions with six stories. And average time with entertainment stories, of which there were far more both in the 1,000-4,999 range (over 1,000) and in the 5,000+ range (48), more than doubled from 131 seconds to 300.

On the other hand, there were two topic areas that saw little if any rise in average time spent as stories went beyond 5,000 words: U.S. politics and science and technology. Readers of long-form U.S. politics stories under 5,000 words were already on the low end of engaged time compared with other topics areas: 108 seconds. Among those 5,000 words or more, the average time of the roughly 9,000 complete interactions increased to 147 seconds – far lower than for most other topics and even below the average time spent with long-form crime stories below 5,000 words. And science and technology stories actually saw the average time decrease as stories grew in length: 109 seconds for those articles that are 1,000-4,999 words and 99 seconds among those articles 5,000 words or longer, which tended to be less about the latest gadgets and more about placing science or technology in the broader political, social or economic environment.

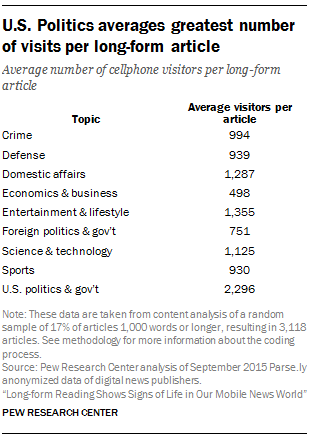
U.S. Politics averages greatest number of visits per long-form article

The data also reveal that the reach of a topic, or particular stories within a topic area, does not seem to be related to the level of engaged time spent with articles in this area. In this sample, for example, U.S. politics had the highest number of average cellphone visitors per article at 2,296, but is tied for the second lowest average engaged time at 108 seconds. At the same time, however, long-form economics & business articles, which had the lowest average engaged time, also had the lowest number of average visitors. For the remaining topic areas, the relationship of average engaged time and average visits per article falls in between.

Acknowledgments

This report was made possible by The Pew Charitable Trusts, which received support from the John S. and James L. Knight Foundation. Pew Research Center is a subsidiary of The Pew Charitable Trusts, its primary funder.

Parse.ly’s data experts provided valuable input during the course of the project, from assistance in understanding the structure of the anonymized data to consultation on methodological decisions.

This report is a collaborative effort based on the input and analysis of the following individuals:

Primary researchers

Amy Mitchell, Director, Journalism Research Galen Stocking, Research Associate Katerina Eva Matsa, Research Associate

Research team

Michael Barthel, Research Associate Kristine Lu, Research Assistant Elisa Shearer, Research Analyst Patrick vanKessel, Data Science Associate, Data Labs Andrew Small, News Content Coder Zachary Lingo, News Content Coder

Editorial and graphic design

Margaret Porteus, Information Graphics Designer Shannon Greenwood, Copy Editor

Communications and web publishing

Shannon Greenwood, Assistant Digital Producer Rachel Weisel, Communications Associate

Methodology

This study examined anonymized cellphone audience behavioral data collected by the web analytics firm Parse.ly through the lens of engaged time spent with long- versus short-form news articles. The data stem from activity on a mix of general and niche websites that are clients of Parse.ly.11

Parse.ly is a web analytics firm launched in 2012 that provides real-time and historical analytics to a broad mix of digital publishers, including over 170 top media companies.

All research was conducted on the original, raw data file by Pew Research Center staff. Pew Research Center retained control over editorial decisions, but consulted with Parse.ly data scientists to ensure the data were interpreted correctly. The report was produced in association with the John S. and James L. Knight Foundation.

The final data set consisted of all articles published across 30 news websites between April and September 2015, which met a minimum threshold of page views in September 2015 (see more on threshold levels below). The final dataset includes 74,840 articles accessed at least once by 71 million visitors. Roughly a quarter of the articles, 24%, are 1,000 words or more and are thus considered long-form. No site accounted for more than 20% of articles.

Working with large, organic datasets requires, at the outset, critical and often complex structural and methodological decisions, as well as a major time investment in data organization and data cleaning. This is particularly true for data that have been collected for other purposes. Researchers – who are coming to the data secondhand – must develop an in-depth understanding of how the data were collected, recorded and structured; determine how to identify and treat outliers; and decide how to structure the data for the respective analysis.

The steps and data decisions made to arrive at the final data set and analysis are described below.

Sample selection and data structure

Web sites

While Parse.ly represents more than 170 media companies, this study focuses on the subset of 30 news sites that researchers identified as being U.S.-based, non-local sites that produce original political or general interest news content.12 In the design phase of this project, Parse.ly supplied us with an initial list of their clients that they classify as news publishers. We further narrowed this list to a mix of 30 general and niche news sites across topic areas. To do so, researchers visited each site to determine if they were based in the U.S., had a geographically broad audience (were not a local site) and published original political, general interest, or topic-specific news content. While the 30 news websites studied here cannot be said to be fully representative of all news organizations or of all digital news users, they are a mix of general and subject-specific news sites; legacy media and digital-only news entities; and of sites with large national audiences as well as those with a smaller niche user base.

Engaged time measurement

Parse.ly records a number of metrics on how users interact with content published by these digital news organizations, including location, session start time, and engaged time. Note that engaged time is an indicator of time a user spends with content, as measured by Parse.ly. Parse.ly captures this through a tracking code that publishers place on each article’s webpage. This javascript code records all the time in which the user has moved the cursor, scrolled, clicked or pressed a key – any interaction with the page. The timer pauses when there has been 5.5 seconds of inactivity. After 30 minutes of inactivity, the user’s session is closed, and any new activity is added to a new session. This helps determine when visitors return to an article.

Device

The engaged time metric functions particularly well as an indicator of actual time spent reading an article on small screens, where the smaller amount of text that can be displayed at one time and the tactile nature of the device can lead to more frequent interactions. Additionally, in recent years, the use of mobile phones for mobile news consumption has grown dramatically. Earlier research by the Center found that 39 of the top 50 digital news websites now have more traffic to their sites and associated applications coming from mobile devices than from desktop computers. And, as of late 2015, about seven-in-ten American adults (68%) owned a smartphone. Moreover, 68% of smartphone users reported getting breaking news there as of April 2015. Accordingly, this study focused in on cellphone interactions with news.

News content

Parse.ly’s software can group all webpages within an article together. This is particularly helpful in analyzing long-form articles, which are often spread across several webpages. Thus, the data for this analysis is examined at the article level, regardless of the number of pages an article might contain.

Time spent watching video news content, or listening to audio content, could be included if it met the minimum word threshold of 101 words and the user somehow activated the screen through a touch or a scroll before the 5.5 second cutoff. It is likely, though, that in most cases a user would hit that 5.5 seconds of inactivity, therefore pausing the engaged time metric. Thus, most of the measures here tell us more about time reading than time spent watching or listening to news.
Visitors

The data we analyzed was collected by Parse.ly using first-party cookies, which track a user within a web site and on a particular device.13

For this analysis, then, unique user behavior is identified within a website, on a specific cell phone.

Data Cleaning

Upon investigation of the data, we took several steps to obtain the most reliable representation of user behavior. Several initial steps were taken on the entire corpus of data:

Removed short visits

In conversations with Parse.ly, we determined that visits in which the user was only on the page for 5 seconds or less were not valid visits. These were more likely page refreshes or people clicking on an article erroneously and then closing it. Accordingly, we limited this analysis to visits longer than 5 seconds.14

Removed overseas visits

In this analysis, we were interested only in visits by individuals in the U.S. Parse.ly uses IP-based geolocation using technology from MaxMind, which MaxMind estimates to be 99.8% accurate at the country level.

Removed articles of 100 words or less

After inspecting a sample of articles, we determined that articles with fewer than 100 words were often just photo captions, headlines or teasers of longer stories. Furthermore, articles this length require such a short time for the average user to read (really just scan) that we determined it would not provide an accurate engagement metric. We therefore removed all articles with a word count below 100 words.

Created a minimum traffic threshold

Another way to reduce outliers and ensure statistical power is to include articles that had at least a minimum number of sessions. After internal testing and consultation with Parse.ly, we created the following thresholds: For articles that are between 101 and 999 words, the minimum threshold was 100 views on any device, while for longer articles the minimum threshold was 25 views on any device. In addition, because this analysis focuses on cellphone activity, articles needed to have at least one cellphone view. Subsequent analysis revealed that there were negligible differences in the rate of complete interactions per article.

Limited to recent articles

Due to logging issues in early 2015, we included only news stories published on or after April 1, 2015, comprising six months of these articles.

Data Analysis

The data are analyzed at the level of complete interaction (unless otherwise specified) which comprises the sum of all time a user spends with an article, across all sessions. A user is defined as a unique cellphone connecting to the site. A user can visit an article over multiple sessions, which are defined as all activity between a user and a site until 30 minutes of inactivity occurs.

Most analyses here investigate the total engaged time according to an independent variable, such as word length, referral type or time of day. Because the large dataset leads to statistical significance even when the differences between tested groups are small, we only highlight findings in which there is at least a 5% difference between these groups.

Researchers conducted the analysis using two calculations: median and mean. The mean, or simply average, is calculated by taking all visitors’ engaged time, adding it together and then dividing by the number of visitors. Sometimes, by that accounting, extreme values of engaged time or length of the article might heavily influence the numbers. The median examines all the engaged time numbers in the corpus and identifies which one is most typical or falls in the middle (the middle value). It is often considered a better indicator of central tendency when there are extremely high or low observations in the distribution. After removing anomalous data, the differences between the mean and median did not alter the pattern of findings from the data. Therefore, throughout the report, researchers use the mean as the principal statistic for engaged time.

In a few analyses in which complete interactions are used, some qualifications need to be made.

For referral type, researchers used the pathway through which the user first visited the article, even if that individual used an alternate means of reaching the article in subsequent sessions. Accordingly, if a user first finds an article through a social media link, we sum the time spent over all visits as coming from social – as that is how the user first discovers the article, and the framing contained in the text surrounding the link shapes their view of and interest in the article.

For article lifespan, we similarly used the characteristics of the first visit in our analysis. In this case, we examine the number of days between the article publication date and when a user first visits that article. This is therefore a metric of how long an article continues to attract new visitors.

For time of day analysis, researchers included all interactions that occurred during the daypart studied. For example, if a user first visits an article during the morning, and then later in the afternoon, the engaged time for the first session would be included in the morning category and the engaged time for the latter session would be included in analysis of the afternoon session. If there are multiple sessions within the morning, the engaged time across those sessions would be summed to represent the total time that users spent with that article within that time period.

Before estimating any time-based metrics, however, we had to determine the local time at the user’s location, as the data are recorded in UTC/GMT time. For this, we identified the appropriate time zone from the user’s state or zip code (for users in the 14 states with multiple time zones). Parse.ly uses technology from MaxMind, which estimates that their IP-based geolocation is accurate at 90% on a state level. At the postal level, this software identifies the user within 50 km of their location with 84% accuracy.15

Return visitors are identified as those who returned to the same article across multiple sessions. Due to the difficulty in identifying when a visit begins and when it ends in some cases, we treat a visit as a return visit if it begins at least 60 minutes after the start of the preceding session. This ensures that we do not overestimate return visits.

Finally, we coded a sample of long-form articles for topic. To do so, we first randomly sampled 17% (3,118) of all long-form articles after data cleaning. Researchers then developed a codebook with 11 categories, listed below. Two of those, weather/traffic and miscellaneous, were removed from the final analysis because few articles fell into these categories. After training on this codebook, three coders tested the codebook by coding a sample of 360 stories (12% of the corpus) by visiting the associated URL and reading the article content. Through this process, the three pairs of coders achieved the following Cohen’s Kappa:

  • Coder 1 and coder 2: 0.76
  • Coder 1 and coder 3: 0.78
  • Coder 2 and coder 3: 0.78

The final number of stories in each category were as follows:

  • Entertainment or lifestyle: 1,160 articles
  • Science & technology: 434
  • S. Politics/government: 369
  • Domestic affairs: 337
  • Economics/business: 304
  • Foreign politics: 266
  • Sports: 115
  • Defense/military: 65
  • Crime incident: 45
  • Miscellaneous/other: 15
  • Weather/traffic: 8

Appendix A: Detailed Tables

Engaged time by daypart
Engaged time by weekend day and weekday
Engaged time by referrer type
Return visitors’ complete interactions and engaged time
Return visitors’ complete interactions and engaged time by referral type
Long-form news articles measures by topic

Appendix B: Terminology

Short-form: Articles with a word count of 101 – 999 words. (Those with 100 or fewer words were removed due to their greater potential of containing anomalous data.)

Long-form: Articles with a word count of 1,000 words or more.

Cellphone: Defined by Parse.ly as a broad category encompassing mobile devices that are not desktop/laptop computers, tablets or other devices that can connect to the web. Cellphones are primarily comprised of smartphones, such as Apple’s iPhone, Samsung’s Galaxy S series or other manufacturers such as HTC, Motorola, Microsoft and Blackberry. All traffic analyzed in this study is based on visits to news websites via mobile browser apps on cellphones. It does not include interactions via “native” mobile news apps.

Unique visitors: Unique number of individuals visiting a web page on a cellphone. Parse.ly uses first-party cookies to track a user within a website on a particular device. Each individual is counted only once, though they may have visited the site more than once during September 2015.

Page activity: An individual’s interaction with the page, measured as screen movement such as scrolling, clicking or tapping.

Session: An individual’s page activity on an article over an indefinite time period, which expires when there has been no activity for 30 minutes. A session includes visits to multiple pages within the article, as well as instances when the user visits the page, leaves for another site or app, but returns within 30 minutes of his or her last activity. Thus, if a user visits one article, pauses for 10 minutes and then returns, that is still considered one session.

Complete interaction: All of a unique visitor’s sessions with one article on a cellphone. In some cases, such as time of the day, we looked at the combined sessions for that particular daypart. For example, if a user read an article over multiple sessions during the morning, we combined these sessions to analyze the activity that took place within that specific daypart.

Return visitors: Visitors who visit an article more than once on the same cellphone. This is tracked by using a web cookie, which uniquely identifies each user’s web browser. A visit is a return visit if it begins at least 60 minutes after the start of the preceding session.

Engaged time: An indicator of the time a user spends with content, as measured by page activity. In other words, this refers to any time that a user spends “engaged” – meaning scrolling, clicking or tapping – with a web page. In the current dataset, a pause in the accumulation of engaged time is set at 5.5 seconds of unengaged time on a page, with engaged time resuming if or when there is action again.

Mean (average) engaged time: An indicator of the overall time spent with a page, this is calculated by taking all visitors’ total engaged time, adding it together and then dividing by the number of visitors. Most analyses of engaged time use this metric.

Median engaged time: An indicator of the overall time spent with a page, this ranks all user activity with a page by engaged time and identifies the engaged time value that is the most typical or falls in the middle (the middle value).

Referral: The pathway a visitor takes to initially land upon a news article. In this study, there are five distinct types of referrals:

  • Direct: A visitor accesses an article by directly typing the URL address into the browser; selecting a bookmarked URL; or clicking on a URL in an email, instant message or other non-web based link.
  • Internal: A visitor accesses an article from an internal link, meaning a web page that has the same domain (i.e., a page that has the same base URL).
  • Search: A visitor follows a link from a search engine such as Google or Bing.
  • Social: A visitor follows a link from a social networking site such as Facebook, Twitter, Google Plus, LinkedIn, Pinterest Reddit or others.
  • External website: A visitor follows a link from other websites that do not fall under any of the previous categories.

Daypart: Each visitor’s activity was classified into one of five dayparts – or periods of the day –based on their local time zone, if identifiable to the zip code level by the user IP address. These dayparts are:

  • Morning (4:00 a.m. – 9:59 a.m.)
  • Midday (10:00 a.m. – 3:59 p.m.)
  • Evening (4:00 p.m. – 7:59 p.m.)
  • Nighttime (8:00 p.m. – 11:59 p.m.)
  • Late night (12:00 a.m. – 3:59 a.m.)

Lifespan: This refers to the time between an article’s publication date and each visitor’s visits to an article. In this study, we looked at articles with visits in September 2015.

Articles: Online news stories published by a mix of 30 news organizations that are Parse.ly clients. The data include all articles of 101 words or more published between April 1 and Sept. 30, 2015, that met a minimum threshold of U.S.-based page views in the month of September 2015. For short-form articles, the minimum threshold was 100 views on any device and with at least one cellphone view; the respective number for long-form was 25 views. Stories 100 words or fewer were removed due to the high number of photos, headlines and slideshows, which introduced errors into the engaged time metric.

Video and audio news content could be included if it met the minimum word threshold of 101 words and the user somehow activated the screen through a touch or a scroll before the 5.5 second cutoff. It is likely, though, that in most cases a user would hit that 5.5 seconds of inactivity, therefore ending the session. Thus, most of the measures here tell us more about time reading than time spent watching or listening to news.