Pew Research Center

FOR RELEASE OCTOBER 21, 2014

Political Polarization & Media Habits

Liberals and conservatives turn to and trust strikingly different news sources. And across-the-board liberals and conservatives are more likely than others to interact with like-minded individuals.

BY Amy Mitchell, Jeffrey Gottfried, Jocelyn Kiley and Katerina Eva Matsa

FOR MEDIA OR OTHER INQUIRIES:

Communications Department
202.419.4372
www.pewresearch.org

RECOMMENDED CITATION

Pew Research Center, October 2014, "Political Polarization & Media Habits"

About Pew Research Center

Pew Research Center is a nonpartisan, nonadvocacy fact tank that informs the public about the issues, attitudes and trends shaping the world. It does not take policy positions. The Center conducts public opinion polling, demographic research, computational social science research and other data-driven research. It studies politics and policy; news habits and media; the internet and technology; religion; race and ethnicity; international affairs; social, demographic and economic trends; science; research methodology and data science; and immigration and migration. Pew Research Center is a subsidiary of The Pew Charitable Trusts, its primary funder.

© Pew Research Center 2026

Table of contents

  • About Pew Research Center
  • Political Polarization & Media Habits
  • Section 1: Media Sources: Distinct Favorites Emerge on the Left and Right
  • Section 2: Social Media, Political News and Ideology
  • Section 3: Talking Politics: Leaders vs. Listeners and the Views People Hear
  • Appendix A: Web vs. Total Sample
  • Appendix B: The News Sources
  • Appendix C: Trust and Distrust of News Sources by Ideological Group
  • About the Study

Political Polarization & Media Habits

Liberals and conservatives turn to and trust strikingly different news sources. And across-the-board liberals and conservatives are more likely than others to interact with like-minded individuals.

When it comes to getting news about politics and government, liberals and conservatives inhabit different worlds. There is little overlap in the news sources they turn to and trust. And whether discussing politics online or with friends, they are more likely than others to interact with like-minded individuals, according to a new Pew Research Center study.

The project – part of a year-long effort to shed light on political polarization in America – looks at the ways people get information about government and politics in three different settings: the news media, social media and the way people talk about politics with friends and family. In all three areas, the study finds that those with the most consistent ideological views on the left and right have information streams that are distinct from those of individuals with more mixed political views – and very distinct from each other.

These cleavages can be overstated. The study also suggests that in America today, it is virtually impossible to live in an ideological bubble. Most Americans rely on an array of outlets – with varying audience profiles – for political news. And many consistent conservatives and liberals hear dissenting political views in their everyday lives.

Yet as our major report on political polarization found, those at both the left and right ends of the spectrum, who together comprise about 20% of the public overall, have a greater impact on the political process than do those with more mixed ideological views. They are the most likely to vote, donate to campaigns and participate directly in politics. The five ideological groups in this analysis (consistent liberals, mostly liberals, mixed, mostly conservatives and consistent conservatives) are based on responses to 10 questions about a range of political values. That those who express consistently conservative or consistently liberal opinions have different ways of informing themselves about politics and government is not surprising. But the depth of these divisions – and the differences between those who have strong ideological views and those who do not – are striking.

Overall, the study finds that consistent conservatives:

  • Are tightly clustered around a single news source, far more than any other group in the survey, with 47% citing Fox News as their main source for news about government and politics.
  • Express greater distrust than trust of 24 of the 36 news sources measured in the survey. At the same time, fully 88% of consistent conservatives trust Fox News.
  • Are, when on Facebook, more likely than those in other ideological groups to hear political opinions that are in line with their own views.
  • Are more likely to have friends who share their own political views. Two-thirds (66%) say most of their close friends share their views on government and politics.

By contrast, those with consistently liberal views:

  • Are less unified in their media loyalty; they rely on a greater range of news outlets, including some – like NPR and the New York Times– that others use far less.
  • Express more trust than distrust of 28 of the 36 news outlets in the survey. NPR, PBS and the BBC are the most trusted news sources for consistent liberals.
  • Are more likely than those in other ideological groups to block or “defriend” someone on a social network – as well as to end a personal friendship – because of politics.
  • Are more likely to follow issue-based groups, rather than political parties or candidates, in their Facebook feeds.

Those with down-the-line conservative and liberal views do share some common ground; they are much more likely than others to closely follow government and political news. This carries over to their discussions of politics and government. Nearly four-in-ten consistent conservatives (39%) and 30% of consistent liberals tend to drive political discussions – that is, they talk about politics often, say others tend to turn to them for information rather than the reverse, and describe themselves as leaders rather than listeners in these kinds of conversations. Among those with mixed ideological views, just 12% play a similar role.

How We Define “Ideological Consistency”

Throughout this report we utilize a scale composed of 10 questions asked on Pew Research Center surveys going back to 1994 to gauge people’s ideological worldviews. The questions cover a range of political values including attitudes about size and scope of government, the social safety net, immigration, homosexuality, business, the environment, foreign policy and racial discrimination.

The scale is designed to gauge the extent to which people offer liberal or conservative views across these various dimensions of political thinking (what some refer to as ideological ‘constraint’). Where people fall on this scale does not always align with whether they think of themselves as liberal, moderate or conservative.

Respondents answered these questions on an earlier survey, the basis for the Pew Research Center’s June 2014 report on Political Polarization in the American Public. The full details about this scale can be found in Appendix A of that report.

The Pew Research Center’s American Trends Panel

Earlier this year, the Pew Research Center released a major analysis of changes in the American electorate titled Political Polarization in the American Public. The study, based on interviews with more than 10,000 adults nationwide, tracked the growing ideological consistency and partisan antipathy expressed by Americans, and how these views correlate with people’s willingness to compromise, relationships with friends and family, and even preferences about where to live.

This report is based on a follow-up survey, about where people get political news and information, conducted among the 88% of panel members with online access. While the picture drawn might be slightly different if those without internet access had been included, this report provides a thorough look at political information consumption by the large online population.

It is important to note, though, that those at either end of the ideological spectrum are not isolated from dissenting views about politics. Nearly half (47%) of across-the-board conservatives – and 59% of across-the-board liberals – say they at least sometimes disagree with one of their closest political discussion partners.

For those closer to the middle of the ideological spectrum, learning about politics, or discussing it with friends and family, is a less of a focus. When they do follow politics, their main news sources include CNN, local TV and Fox News, along with Yahoo News and Google News, which aggregate stories from a wide assortment of outlets; these U.S. adults see more of a mix of views in social media and are less likely to be aware of their friends’political leanings.

This study, the latest in a series of reports on political polarization, is based on an online survey conducted March 19-April 29, 2014 with 2,901 members of the Pew Research Center’s new American Trends Panel — a panel recruited from a telephone survey of 10,013 adults conducted earlier this year.

Among the key findings:

Media Sources: Nearly Half of Consistent Conservatives Cite Fox News

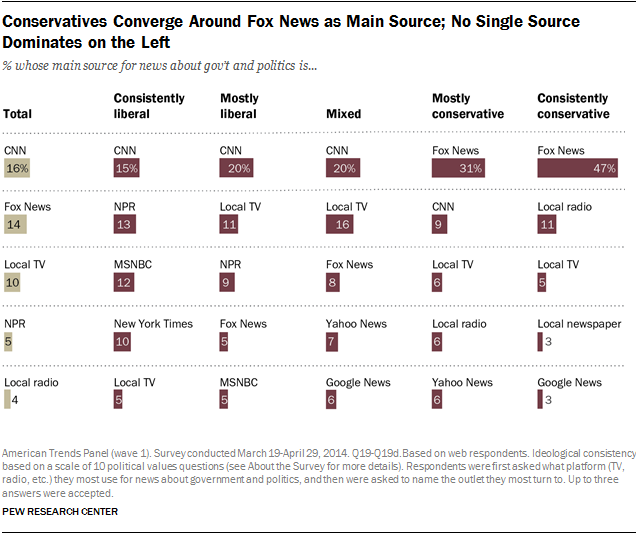
When it comes to choosing a media source for political news, conservatives orient strongly around Fox News. Nearly half of consistent conservatives (47%) name it as their main source for government and political news, as do almost a third (31%) of those with mostly conservative views.  No other sources come close.

Consistent liberals, on the other hand, volunteer a wider range of main sources for political news – no source is named by more than 15% of consistent liberals and 20% of those who are mostly liberal. Still, consistent liberals are more than twice as likely as web-using adults overall to name NPR (13% vs. 5%), MSNBC (12% vs. 4%) and the New York Times (10% vs. 3%) as their top source for political news.

PI_2021.11.22_2035-Digital-Public-Sphere_FINAL

Main Source of Government and Political News
Interactive: Audience Profiles & Media Habits

Among the large group of respondents with mixed ideological views, CNN (20%) and local TV (16%) are top sources; Fox News (8%), Yahoo News (7%) and Google News (6%) round out their top five sources.

Trust and Distrust: Liberals Trust Many, Conservatives Trust Few

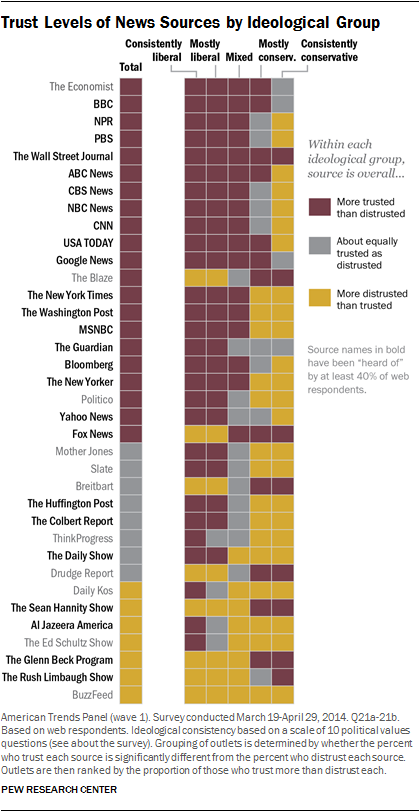
Trust Levels of News Sources by Ideological Group

At least as important as where people turn for news is whose news they trust. And here, the ideological differences are especially stark.

Respondents were asked whether they had heard of  each of the 36 outlets listed in the accompanying graphic. For those they had heard of, they were asked about their trust – or distrust – in each source.

Liberals, overall, trust a much larger mix of news outlets than others do. Of the 36 different outlets considered, 28 are more trusted than distrusted by consistent liberals. Just eight earn higher shares of distrust than trust. Still, among those eight, the levels of distrust can be high: fully 81% of consistent liberals distrust Fox News, and 75% distrust the Rush Limbaugh Show.

Among consistent conservatives, by contrast, there are 24 sources that draw more distrust than trust. The same is true for 15 sources among those with mostly conservative views. And, of the eight outlets more trusted than distrusted by consistent conservatives, all but one, on balance, are distrusted by consistent liberals.

Also at play here is the degree to which people are more familiar with certain news sources than others. Some outlets such as CNN, ABC News and Fox News, are recognized by at least nine-in-ten respondents, meaning that more respondents offer a view of these outlets one way or the other. Outlets currently occupying more niche markets, such as Politico, the Economist or BuzzFeed, are known by only about a third of respondents. Thus, while they may elicit strong views in one direction, the share of respondents weighing in is relatively small.

This section of the report looks in detail at news audiences and trust and distrust of outlets across ideological groups. For more on how the news sources were selected, see Appendix B.

Social Media: Conservatives More Likely to Have Like-Minded Friends

Consistent Conservatives See More Facebook Posts in Line With Their Views; Consistent Liberals More Likely to Block Others Because of Politics

Consistent liberals who pay attention to politics on Facebook are also more likely than others to “like” or follow issue-based groups: 60% do this, compared with 46% of consistent conservatives and just a third (33%) of those with mixed views. And both the left and the right are more likely than others to follow political parties or elected officials: 49% of consistent conservatives and 42% of consistent liberals do so, compared with 29% of Facebook users overall.

Talking Politics: Dissenting Views Penetrate, but Less Frequently for the Ideologically Consistent

Consistent Conservatives More Likely to Have Close Friends Who Share Their Political Views, But Consistent Liberals More Likely to Drop a Friend

In personal conversations about politics, those on the right and left are more likely to largely hear views in line with their own thinking.

While only a quarter (25%) of respondents with mixed ideological views say most of their close friends share their own political views, that is true of roughly half (52%) of consistent liberals and two-thirds (66%) of consistent conservatives.  And, when those who talk about politics are asked to name up to three people they most often talk to about politics, half (50%) of consistent conservatives name only individuals they describe as also being conservative – outpacing the 31% of consistent liberals who name only liberals.

At the same time, consistent liberals are more likely to stop talking to someone because of politics. Roughly a quarter (24%) have done so, compared with 16% of consistent conservatives and around 10% of those with more mixed political views.

Still, a solid portion of even the most ideologically-aligned respondents encounter some political disagreement with their close discussion partners. Nearly half (47%) of consistent conservatives who talk about politics name one or more discussion partners with whom they disagree at least some of the time. This figure rises to more than half (59%) of consistent liberals and even larger shares of those with mostly liberal and ideologically-mixed political views (79% each).

Media Outlets by the Ideological Composition of Their Audience

PI_2021.11.22_2035-Digital-Public-Sphere_FINAL

Ideological Placement of Each Source’s Audience
Sortable Tables: Audience Profiles & Media Habits

Ideological differences in media source preferences result in distinct audience profiles for many media outlets. Many sources, such as the Wall Street Journal, USA TODAY, ABC News, CBS News and NBC News have audiences that are, on average, ideologically similar to the average web respondent.

Reflecting liberals’ use of a greater number of media sources, there are more outlets whose readers, watchers and listeners fall to the left of the average web respondent than to the right. At the same time, a handful of outlets have audiences that are more conservative than the average respondent.

Fox News sits to the right of the midpoint, but is not nearly as far right as several other sources, such as the radio shows of Rush Limbaugh or Glenn Beck. A closer look at the audience breakdowns reveals why: While consistent conservatives get news from Fox News at very high rates, many of those with less conservative views also use Fox News. By contrast, the audiences for Limbaugh and Beck are overwhelmingly conservative.

By comparison, the average consumer of the Wall Street Journal sits very close to the typical survey respondent, but the range of Journal readers is far broader because it appeals to people on both the left and the right. As a result, while respondents overall cluster toward the center of the ideological spectrum, the Journal’s audience is relatively evenly distributed across the continuum: 20% are consistent liberals, 21% mostly liberal, 24% mixed, 22% mostly conservative and 13% consistent conservative.

For a more detailed look at the ideological composition of each source’s audience, see the Pew Research Center’s interactive database.
Section 1: Media Sources: Distinct Favorites Emerge on the Left and Right

When it comes to getting news about government and politics, there are stark ideological differences in the sources that online Americans use, as well as in their awareness of and trust in those sources.

CNN, Fox News Top List of Main Sources

Overall, when respondents are asked what outlet they turn to most often for news about government and politics, the most frequent mentions are two cable networks: CNN (named by 16%) and Fox News (14%). But wide ideological differences exist both in the sources that top the list for those on the left and right and in the degree to which there is reliance on a single source.

Those with consistently conservative political values are oriented around a single outlet—Fox News—to a much greater degree than those in any other ideological group: Nearly half (47%) of those who are consistently conservative name Fox News as their main source for government and political news. Far fewer choose any other single source: Local radio ranks second, named by 11%, with no other individual source named by more than 5% of consistent conservatives. Those with mostly conservative views also gravitate strongly toward Fox News – 31% name it as their main source, several times the share who name the next most popular sources, including CNN (9%), local television (6%) and radio (6%) and Yahoo News (6%).

On the left of the political spectrum, no single outlet predominates. Among consistent liberals, CNN (15%), NPR (13%), MSNBC (12%) and the New York Times (10%) all rank near the top of the list. CNN is named by just 20% of those with mostly liberal views, but still tops their list, followed by local television (11%) and NPR (9%). Both MSNBC and Fox News are mentioned by 5% of those who are mostly liberal. Those in other ideological groups name the New York Times, NPR and MSNBC less frequently as top news sources.

Respondents with a roughly equal mix of liberal and conservative values also have a diffuse mix of news providers. CNN (20%) and local television (16%) are the most frequently-named top sources, with a long list of other news sources named by fewer than one-in-ten. Fox News (8%) is among the most-named sources in this “long tail,” along with Yahoo News (7%) and Google News (6%), both of which primarily aggregate and highlight news produced by other outlets.

Conservatives Converge Around Fox News as Main Source; No Single Source Dominates on the Left


In News Sources We Trust—Or Distrust

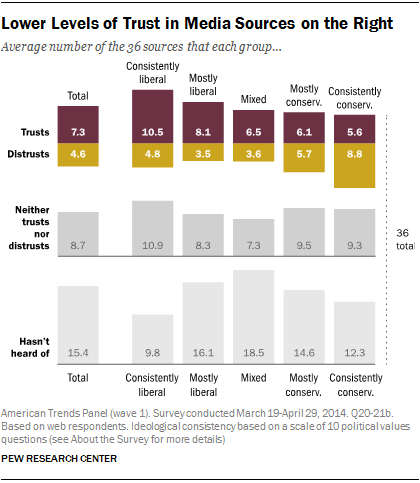
Lower Levels of Trust in Media Sources on the Right

The public’s understanding of government and politics is also influenced by the extent to which they trust – or distrust – the information they hear from various news sources. In other words – how open people are to the political news and information put forth by various outlets, including those they do not actively consume.

In general, the survey finds that there is more trust than distrust of news sources. But there are substantial differences in trust and distrust across the ideological spectrum.

Respondents were asked first whether they had heard of 36 individual news sources. If they had heard of the outlet, they were then asked if they trusted it, and if they did not indicate that trust, they were next asked if they distrusted the outlet. The average web panelist has heard of about 21 of the 36 sources and trusts more of them than they distrust: 7.3 vs. 4.6, with another 8.7 that they neither trust nor distrust. There is variance, though, by ideology.

Those with consistently liberal political values have, on average, heard of more sources than any other ideological group – on average, about 26 out of the 36 – and trust about twice as many as they distrust (10.5 vs. 4.8). Respondents with mostly liberal views or with about an equal mix of conservative and liberal views have heard of fewer sources, on average, but still trust more sources than they distrust.

By contrast, those with mostly conservative political values, on average, trust and distrust about the same number of sources, about six each, while the average consistent conservative distrusts more media sources than they trust (8.8 vs. 5.6).

The ideological differences also stand out when it comes to the specific outlets in which people place their trust.

Public opinion about facial recognition_topline

Interactive: Audience Profiles & Media Habits

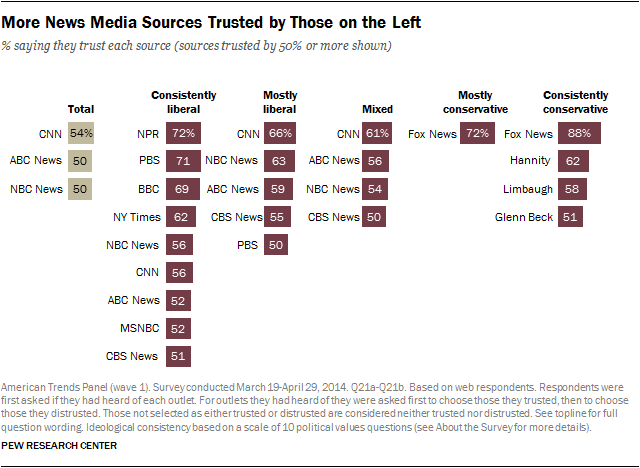
While consistent liberals trust CNN, NBC News and ABC News at levels similar to — or slightly higher than —respondents overall, these news sources are not the top most trusted among this group. Instead, three public news organizations – NPR (72%), PBS (71%) and the BBC (69%) – are the most trusted sources among those with consistently liberal political values. The New York Times also enjoys a high level of trust from this group (62%). In total, more sources (nine of 36) are trusted by 50% or more of consistent liberals than by any other ideological group.

The most trusted sources among those with mostly liberal political values are similar to those of web panelists overall – but they trust these sources at higher rates. About two-thirds of those with mostly liberal political values trust CNN (66%), and majorities also trust NBC News (63%), ABC News (59%) and CBS News (55%).

Conservatives, on the other hand, demonstrate strong allegiance to Fox News. Among those with mostly conservative values, Fox is the only source trusted by a majority (72%). And among those who are consistently conservative, nearly nine-in-ten (88%) trust it as a source — by far the highest level of trust by any ideological group of any single source. The other outlets trusted by the greatest proportion of consistent conservatives are the radio shows of Sean Hannity (trusted by 62% of consistent conservatives), Rush Limbaugh (58%) and Glenn Beck (51%), which each have a much narrower audience reach overall than Fox News.

Levels of distrust in media sources also reveal pronounced ideological divides. Consistent conservatives are more likely to distrust these 36 media sources than are liberals or those with mixed political views.

Public opinion about facial recognition_topline

Interactive: Audience Profiles & Media Habits

Among respondents overall (as well as those with mixed or mostly conservative views), no news source is distrusted by a majority. But those at both ends of the ideological spectrum stand out for their high levels of distrust in individual sources; consistent conservatives and consistent liberals are the only groups in which majorities distrust multiple sources. The outlets distrusted the most by consistent conservatives and consistent liberals are entirely different, but the high levels of distaste for the sources at the top of the lists are similar: Fox News is the most distrusted source among consistent liberals (81% distrust), while MSNBC is the most distrusted source among consistent conservatives (75%).

Along with MSNBC, sibling network NBC is distrusted by 62% of consistent conservatives, slightly more than the share of consistent conservatives who distrust the two other network news sources (52% ABC News, 51% CBS News). CNN is also distrusted by about six-in-ten consistent conservatives (61%), while 50% say they distrust the New York Times. Notably, four of the sources distrusted by majorities of consistent conservatives are among the most trusted sources overall.

Among consistent liberals, the radio programs of Rush Limbaugh (75% distrust), Glenn Beck (59%) and Sean Hannity (54%) round out the list of those distrusted by majorities. These same sources are the most trusted by consistent conservatives.

Smaller Audience, But Strong Trust

Public opinion about facial recognition_topline

Interactive: Audience Profiles & Media Habits

Another way to examine attitudes across media sources is to look at the relationships between awareness and trust (or distrust) for news about government and politics. Some media outlets are better known than others and thus amass trust or distrust across a larger share of panelists. There are simply more people who know of them and have a view one way or another.

Other outlets elicit high levels of both trust and distrust, making it useful to look at the two measures side by side. And many outlets asked about here are only recognized by subsets of the public, but derive some trust or distrust from those who do recognize them.

One example is the Economist. Only 34% of panelists have heard of the outlet, but within that group there is far more trust (12%) than distrust (2%), when it comes to news about government and politics. The BBC is recognized by a greater portion of respondents (76%), but is similarly more trusted (36%) than distrusted (7%).

Trust Levels of News Sources by Ideological Group

By contrast, the Glenn Beck Program is more distrusted than trusted. About half of panelists (48%) have heard of Beck’s radio program, and by about two-to-one, more panelists distrust than trust it (24% vs. 10%).

An example of an outlet with very little awareness overall is Mother Jones: Only 22% have heard of it, and those who have heard of it are fairly evenly split between trust and distrust.

And then there is Fox News, recognized by almost all respondents (93%), and with strong levels of both trust (44%) and distrust (37%). Only 12% do not offer a view on the outlet either way.

Looking at the media landscape overall, there are a few areas of agreement in a sea of ideological disagreement. Only one source is more trusted than distrusted by all five ideological groups: The Wall Street Journal. Among consistent conservatives, 30% trust the Wall Street Journal for news about government and politics and 17% distrust it; among consistent liberals, 35% trust it and 14% distrust it.

Among consistent liberals, fully 28 of the 36 sources are more trusted than distrusted. And though only eight sources are more distrusted than trusted by consistent liberals, six of them are overwhelmingly more distrusted than trusted: Fox News, the Drudge Report, Breitbart, the Glenn Beck Program, the Rush Limbaugh Show and the Sean Hannity Show.

All six of the sources overwhelmingly distrusted by consistent liberals are overwhelmingly trusted by consistent conservatives. And they are among the only sources that consistent conservatives trust more than distrust (along with the Wall Street Journal and the Blaze). (See Appendix C for detailed tables on trust, distrust and awareness of all 36 sources across all groups)

The Long Tail

NPR, CNN Most Consumed on the Left, Fox News on the Right; Local TV Spans Ideological Divide

The list of popular sources these panelists turn to for political and government news often parallels the list of sources they are most likely to trust. Panelists were asked whether they got news from each of the 36 sources (plus local television news) over the past week, and while these data do not speak to the number of hours spent on each outlet, they do reveal distinct orientations that segment along ideological lines.

While Fox News has a large audience overall, the other outlets that consistent conservatives turn to do not have much reach beyond this conservative base. Fewer than 10% of digitally connected U.S adults got news about government and politics from any of these sources in the previous week.

Even among those with mostly conservative political values, there is a drop-off in usage of sources like the Rush Limbaugh show, the Sean Hannity Show and the Glenn Beck Program. For instance, just 19% of those who are mostly conservative got news about government and politics from Sean Hannity’s radio show in the past week (compared with 45% of consistent conservatives). Far more in this group got news from sources such as ABC News (32%) and CNN (32%).

Consistent conservatives, then, are both united around a single source in a way no other ideological group is, and when they turn to other sources, they opt for those not consumed by many others.

Consistent liberals, on the other hand, show signs of a more diffuse network of news sources. Ten of the 37 sources (local television was included in this consumption measure) were used by at least a third of this group for news about government and politics in the past week; by comparison, only five sources were used by a third or more of consistent conservatives in the past week.

Still, several of the most popular sources among consistent liberals differ from other groups.

Consistent Liberals Turn to More Sources

Roughly a third of consistent liberals also got news from other sources that are less popular, such as PBS, the BBC and the New York Times. MSNBC was watched by 38% of consistent liberals, along with 32% of the mostly liberal and about a quarter of both the ideologically mixed (25%) and those who are mostly conservative (23%).

Those with mixed ideological views (who also tend to follow political and government news less closely than those in other groups) gravitate to both broadcast and cable television sources.

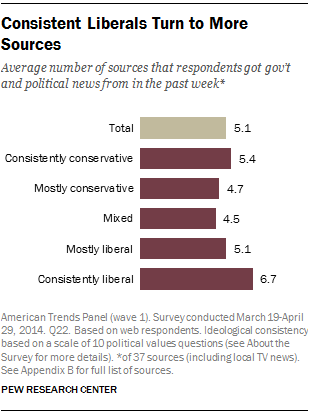
On average, consistent liberals turn to more sources for news about politics and government than do those in other groups. Those with consistently liberal political values say they got news about government and politics in the past week from 6.7 of the 37 news outlets the survey examined. Consistent conservatives turn to somewhat fewer sources (5.4), but more than those with mixed ideological views (4.5).

News Audience Profiles

The different ideological preferences detailed above result in distinct audience profiles for each news source. Each source is placed on the line graph below according to the average ideological composition of those who use the source for news about politics and government. The dashed vertical line shows the ideological placement of the average respondent (just slightly to the left of someone holding an equal mix of liberal and conservative positions).

Public opinion about facial recognition_topline

Interactive: Audience Profiles & Media Habits

For example, ABC News’s audience, on average, is very close to the average survey respondent. The New Yorker on the other hand is placed further to the left because its audience is, on average, more liberal.

Ideological Composition of News Sources’ Audiences

Overall, more of these outlets’ audiences fall to the left of the average respondent than to the right (and many cluster near the middle). But the overall audience distributions can differ even for outlets that are similarly placed.

To help readers understand why sources are placed where they are, Pew Research has created interactive visuals for each outlet. Here are a few examples.

On the continuum above, Fox News sits to the right of the midpoint but not nearly as far right as sources such as the Rush Limbaugh Show or the Glenn Beck Program. Looking at the audience breakdown helps explain why.

While Fox News is a dominant source for conservatives, it also draws a significant portion of its audience from across the ideological spectrum: Those with mixed ideological views make up 37% of its audience (they make up 36% of all panelists), and those to the left of center account for 18% of its audience (14% mostly liberal, 4% consistently liberal).

Though those to the right of center make up a far greater proportion of the Fox News audience than of all respondents (46% vs. 26%, respectively), still less than half of those who turn to Fox News for political news in the course of a week are conservatives.

MSNBC follows a pattern that is somewhat the reverse, though it has a smaller audience overall. Those with mixed political views make up a third (33%) of its audience, and about half of its audience is either mostly liberal (26%) or consistently liberal (22%); by comparison, 38% of all panelists are left of center. Conservatives account for 18% of those who turn to MSNBC for political news (14% mostly conservative and 4% consistent conservative).

The Wall Street Journal’s overall placement, on the other hand, is at roughly the same spot as the average respondent, driven by the mostly even distribution of its audience across the continuum: 20% are consistent liberals, 21% mostly liberal, 24% mixed, 22% mostly conservative and 13% consistent conservatives. Notably, this distribution reflects the relatively low levels of usage of the Journal among the ideologically mixed (they are just 24% of Journal consumers, but 36% of all panelists).

For other, smaller outlets, the audiences are concentrated much more on one ideological side or the other. The Daily Show’s audience for political news in the past week, for example, skews heavily to the left. Nearly three-quarters of those who get political news from the Daily Show in a given week hold liberal views: 45% are consistently liberal and another 27% are mostly liberal. By contrast, just 7% fall on the conservative side of the spectrum (6% mostly conservative and 1% consistently conservative). The remaining 21% have roughly an equal mix of liberal and conservative political values.

The audience for the Rush Limbaugh Show, on the other hand, is decidedly conservative: About eight-in-ten (83%) of those who listened to Rush Limbaugh’s talk radio show in the past week have political values that are right of center. By comparison, a small proportion (3%) is left of center and 14% are in the middle.

See our interactive to connect directly with this data and examine all the outlets in the survey.

Section 2: Social Media, Political News and Ideology

The advent of social media has opened up new ways for people with similar interests to find, share and talk about news – including news about politics – with friends and colleagues.

Facebook is now a widely-used source for news about government and politics. Nearly half (48%) of the panelists say they accessed news about politics and government on Facebook in the past week, about as many as got news about these topics from local TV (49%). (Note that this survey is representative of the 89% of Americans who have access to the internet. Based on the full population, somewhat fewer—39%—get news from Facebook in a typical week.)

As a platform that links to content from many different sources, Facebook draws about twice as many political news consumers among web users as the aggregation sites Yahoo News (24% in the past week) or Google News (22%). And Facebook far surpasses other social media sites, such as YouTube and Twitter, as a source for news about politics and government. Just 14% say they got political news in the past week from YouTube, 9% from Twitter, 6% from Google Plus and 3% from LinkedIn.

Facebook Has Much Broader Reach Than Other Social Media Sites

In part, this stems from Facebook’s broad reach; it is by far the largest social media platform. Fully 77% of web panelists use Facebook. That compares with 63% who use YouTube and much smaller shares who use Twitter (21%), Google Plus (24%) or LinkedIn (25%).

But even holding its more widespread use constant, a greater portion of Facebook’s audience gets political news there than is true for other social networks – 62%. That compares with 40% of all Twitter users, about a quarter of those on YouTube (22%) or Google Plus (25%) and just 12% of LinkedIn users .

As Pew Research found in a 2013 study of the role of news on Facebook,  not all of these users are specifically seeking out political news when they log on to the site, but they nonetheless come across it in the mix of posts shared by those in their feed.

One unique feature of social media is how the political news you see is impacted by your choice of friends and your past behavior on the site. Each individual sees a different mix of content, depending on who is in his or her feed, as well as the kinds of posts he or she has responded to in the past. So when it comes to politics, a common question to ask is the degree to which people create circles of friends that reflect their own ideological views. The evidence suggests that while nearly all users get a mix of views, those with stronger ideological tendencies are more likely to surround themselves with like-minded opinions.

More Consistent Liberals Than Consistent Conservatives Get Political News on Twitter, Somewhat More on Facebook

Overall, consistent conservatives are somewhat less likely than consistent liberals to get government and political news on Facebook or Twitter, primarily because they are somewhat less likely to use the sites in the first place. About half (49%) of consistent liberals (and a similar share of those with mixed ideological views) say they got news about government and politics in the past week from Facebook, compared with 40% of consistent conservatives. And while 13% of consistent liberals say they got political news on Twitter in the past week, just 5% of consistent conservatives (and 8% of groups in between) say the same.

The data also find that those who use social networking sites for news about government and politics are also getting this news through other channels at the same time. Respondents who got political news on at least one social networking site in the past week got such news from an average of 4.8 other news sources as well (out of the list of 37 asked about), similar to their peers who don’t learn about politics through social networks. (For further evidence of this phenomenon, see 2013 Facebook and News report.)

Looking Deeper at Facebook Habits by Ideology

Consistent Liberals, Conservatives Pay Most Attention to Political Posts

At the same time that consistent conservatives are less likely to use Facebook than other groups, those who do use it are highly engaged with political news.1 Two-thirds of consistent conservatives who see political posts on Facebook pay “a lot” of (19%) or “some” attention (47%) to those posts. Similarly, six-in-ten consistent liberals who see political posts on Facebook pay “a lot” of (14%) or “some” (46%) attention.

But as with interest in political news from traditional media sources, there is a “U-shaped” pattern in how ideological groups engage with political news on Facebook. Smaller shares of those who are less ideologically consistent pay attention to Facebook posts about government and politics than those with stronger ideological ties. These middle groups are about half as likely to pay a lot of attention to political posts.

Many Facebook Users See Political Views That Differ From Their Own

Overall, those who see posts about politics on Facebook are exposed to a variety of views. Only about a quarter of those who pay attention to these posts say the posts they see are nearly always (2%) or mostly (21%) in line with their own political views. A 62% majority of these users see political content in line with their views “some of the time,” while just 13% say they see such posts “not too often.”

Nearly Half of Consistent Conservatives Mostly See Posts That Match Their Politics

But consistent conservatives and, to a lesser extent, consistent liberals are much more likely to be exposed to views similar to their own. Among those who pay attention to posts about politics, nearly half of consistent conservatives (47%) say the opinions they see are mostly or always in line with their own views; among consistent liberals, about one-in-three (32%) say the same.

Among mostly conservative Facebook users who pay attention to political posts, 28% say the posts they see are always or mostly in line with their own political views. Those with mostly liberal views (13%) and mixed ideological views (17%) are the least likely to see like-minded posts about politics.

Consistent Liberals Most Likely to Block Others Based on Political Content

And how do different groups respond to political views with which they disagree? About one-in-four (26%) Facebook users have hidden, blocked, defriended or stopped following someone on a social networking site based on disagreements over political posts. While consistent conservatives are the most likely to see Facebook posts in line with their political views, consistent liberals are the most likely to block others on social networking sites because they disagree with their content.

More than four-in-ten consistent liberals who use Facebook (44%) say they have blocked someone on a social networking site because of a political post. Consistent conservatives are less likely to have done this (31%), as are those with more mixed ideological views (about two-in-ten).

Beyond personal friends and colleagues, what kinds of groups and organizations do these news consumers on Facebook follow? Among those who pay at least some attention to politics on Facebook, about three-in-ten (29%) “like” or otherwise follow political parties, candidates or elected officials. A somewhat greater share of users follows news organizations, reporters or commentators (36%), and about four-in-ten (41%) follow issue-based groups on Facebook.

“Liking” and Following Groups and Organizations on Facebook

Of those paying attention to political posts, the two most ideologically consistent groups are about twice as likely as those with mixed views to follow political parties, candidates or elected officials. About half of consistent conservatives (49%) and 42% of consistent liberals “like” or follow parties, candidates or officials, compared with three-in-ten or fewer of those with more mixed ideologies.

Consistent liberals on Facebook are the ideological group most likely to follow issue-based organizations: 60% of those who pay some attention to political posts follow such a group, compared with 46% of consistent conservatives.

Section 3: Talking Politics: Leaders vs. Listeners and the Views People Hear

Conversations with others remain an integral part of how we learn about government and politics. As one respondent stated, “Word of mouth is a large part of how political views are formed.” Said another, “Talking with other residents in our area is a useful way to keep up with local politics.”

Consistent Conservatives, Liberals Talk About Politics More, Enjoy It More

In general, most adults talk about politics with people of varying political views, some of which are in line with their own views and others which run counter. But, as these data reveal, discussing politics with people of varying viewpoints becomes less frequent among those with strong ideological ties.

To begin with, those with stronger ideological ties are more drawn to political discussions in the first place. The vast majority (81%) of those with consistently conservative political values enjoy talking about politics, as do 69% of those with consistently liberal political values. That compares with just 44% of those with more mixed political views.

This greater enjoyment translates to more frequent discussions.  Roughly seven-in-ten consistent conservatives (68%) and six-in-ten consistent liberals (57%) talk about politics at least a few times a week – about twice that of those with mixed views (31%).

Shared Political Views More Common Along the More Ideological

On Left and Right, More Say Friends Share Their Political Views

Respondents overall are fairly split between mostly having friends who share their views about government and politics (36%) and having a mix of friends – some who share their political views and some who do not (41%). Additionally, nearly a quarter (23%), say they don’t know their friends’ political views.2

“I actually get a lot of information from my friends who read other sources of info than I do.”

Just a quarter of respondents with mixed ideological views say that most of their close friends share their views about government and politics. More (44%) say they have many friends who do not share their views. Three-in-ten (30%) say they don’t really know what most of their close friends think about government and politics.

Those whose political views are solidly on the left or right – and especially those on the right – have a much greater tendency than others to have politically like-minded friends. Two-thirds (66%) of consistent conservatives say most of their friends share their political views, more than twice the number who say only some of their friends do (29%). A mere 5% don’t know the political views of their close friends.

Consistent Liberals More Likely to Drop a Friend Because of Politics

Consistent liberals are somewhat less likely than consistent conservatives to have politically like-minded friends. About half (52%) say most of their friends share their views – though that is still twice that of those in the middle. And 12% are not aware of their close friends’ political views.

Similar to what the data reveal about people’s circle of friends on Facebook,  consistent liberals might have close friends that span a wider mix of political views than consistent conservatives, but they are the most likely to stop talking to or being friends with someone because of politics.

Though only about one-in-ten respondents (12%) say they have stopped talking to or being friends with someone because of politics, about a quarter (24%) of consistent liberals have done this. This compares with 16% of consistent conservatives and 10% or less among those who are less ideologically consistent.

When It Comes to Talking Points, Conservatives More Likely to Stick Together

Whom Do You Talk With Most Often About Politics?

To gain a more granular understanding about politics in people’s everyday lives, panelists who at least occasionally talk about politics were asked to list up to three people with whom they most frequently discuss the topic.

Respondents were then asked what they thought each person’s party affiliation and political ideology was, as well as whether they agree with that person when they talk about politics. (For details on how the question was asked, see survey topline.)

People likely talk about politics to more than the three individuals they were asked about here. Indeed, 70% of respondents who name at least one person say there are others they talk to as well. Nevertheless, a look at the three people that panelists name again shows the greater tendency among those with strong ideological alignments to affiliate with like-minded people. And again, these data suggest that this tendency is stronger among those with conservative political views.

Half of Consistent Conservatives Say the People They Most Often Talk Politics With Are All Conservative

Half (50%) of consistent conservatives, along with 28% of those with mostly conservative political values only name individuals they describe as also conservative. Consistent liberals are on par with those who hold mostly conservative views. About three-in-ten (31%) consistent liberals name only fellow liberals. That was the case for just one-in-ten (9%) of those with mostly liberal views.

It is worth noting, though, that for about half of consistent conservatives and the clear majority of consistent liberals, the three people they most often talk to about politics include people who do not share their ideological views.

Consistent Conservatives and Consistent Liberals More Likely to Say People They Talk to About Politics Are Only of One Party

Respondents were also asked about the political party affiliation of each of their discussion partners. On this measure, 39% of consistent liberals only name Democrats, while 43% of consistent conservatives only name Republicans. The slightly different pattern in the discussion partners by perceived ideology and perceived partisanship may, to some extent, reflect that more of the public self-identifies as conservative, rather than liberal, but at the same time more of the public identifies with the Democratic Party rather than the Republican Party.

Consistent Conservatives More Likely than Others to Agree With the People They Most Often Talk to About Politics

Even Many on the Right and Left Hear Dissenting Voices

In political conversations, most people encounter some disagreement; even with those they consider their closest discussion mates. But that experience is less common for those at either end of the ideological spectrum.

Overall, about two-thirds of panelists who talk about politics (69%) name at least one discussion partner with whom they disagree with at least some of the time, while 31% only name individuals with whom they agree with all or most of the time. Among those with mixed and mostly liberal political views, there is even more exposure to differing views: nearly eight-in-ten (79%) disagree at least sometimes with at least one of their closest discussion partners, and just two-in-ten (21%) only name people with whom they agree.

At the political edges, though, and particularly on the right, there is less disagreement and greater reinforcement of one’s political views. About half, 53%, of consistent conservatives who talk about politics agree all or most of the time with all of their top discussion partners – more than double that of those with mixed political views. The same is true of 41% of consistent liberals.

Consistent Liberals, Conservatives More Likely to Take the Lead When It Comes to Talking Politics

Along with discussing politics to a greater degree, the more ideologically consistent also tend guide political discussions. And here, liberals and conservatives take the lead at roughly the same rate.

Leading Political Discussions and Having Others Turn to You For Political Information

The Pew Research Center asked panelists who talk about politics at least a few times a month whether they tend to lead or listen to these conversations, and if people tend to turn to them for information about politics.

Overall, those who discuss politics at least a few times a month are fairly evenly split on both measures. But majorities of both consistent conservatives and consistent liberals describe themselves as leaders (61% and 57%, respectively) and as having others turn to them for information about politics (69% and 64%, respectively).

Consistent Conservatives, Liberals More Likely to Drive Political Discussions

Those who frequently talk about politics, lead political conversations and have others come to them for political information can be said to be at the forefront of political discourse. In other words, they are political discussion influentials.

Again, the data reveal the heavier role played by those with stronger ideological leanings. Just a small minority (19%) of respondents overall fall into this category, but this number rises to nearly four-in-ten (39%) consistent conservatives and about three-in-ten (29%) consistent liberals. Again, mostly conservatives, mostly liberals and the mixed lag behind.

One respondent with mixed ideological views sums up this trend:

“I get information from talking to my brother… He is big on following the news. I’m not and don’t watch the news unless I am flipping through the channels and see something that catches my attention.”

Appendix A: Web vs. Total Sample

This survey was conducted using the American Trends Panel, a nationally representative panel of randomly selected U.S. adults. As with the American public overall, the vast majority of panel members has web access and has opted to take the surveys online. Indeed, data from the survey for the first report in this polarization series, and from which the American Trends Panel was recruited show that as of March 2014, 89% of American adults use the Internet.  Similarly, 88% of this Wave 1 of the American Trends Panel completed the survey online; the remainder was surveyed by telephone.

Political Demographics of Web and Total Respondents

The online format of the American Trends Panel provided the Pew Research Center with a unique opportunity to get both a depth and breadth of information about the media habits of our panelists in a way that could not have been accomplished through another mode, such as telephone or mail. Several of the questions used visual elements that could not have been administered over the phone. In addition, the survey length would have made telephone administration very difficult. For these reasons, most of this report is based on web respondents.

We did however ask the 12% of panel members who opted for a phone survey a smaller portion of the questionnaire. This allowed us to compare the web respondents with the total sample (including the phone respondents) on several important characteristics, including political ideology, interest in politics and demographic characteristics.

Politically, there are minimal differences between the web respondents and the total sample. Web respondents are very similar to the total sample in political party affiliation, ideological consistency, political engagement, interest in politics and engagement in political discussion.

2012 Media Consumption Internet Users vs. Total sample

Furthermore, much of this report focuses on a key series of questions asked only of web respondents. These deal with specific news media sources, including whether respondents have heard of, trust or distrust, and consume each of the sources. To understand the potential impact of omitting the non-web respondents, we examined data from the Pew Research Center’s 2012 media consumption survey. It shows that Internet users are nearly indistinguishable from all adults in their media consumption habits. This lack of substantial differences is in large part due to the fact that the Internet-using sample is such a substantial portion of the survey’s total sample. The media consumption habits of web respondents are similar to those of the total sample.

That said, the one area where we expect to see a difference between the web users and the total sample is the usage of social media, which by definition is limited to Internet users. As we note in that section, estimates of the usage of these sites is somewhat larger than if the non-web users were included. For example, among web users 48% reported getting news about government and politics in the last week on Facebook. When that is extrapolated to the total population (assuming that no one who took the survey by telephone gets news on Facebook), the percentage falls to 39%. By the same logic, other web-only sources would have a lower incidence of usage among the general public than among the Internet-using population.

Demographically, there are a few differences worth noting in the web and non-web samples. The web respondents are somewhat younger, more educated and wealthier than the total sample. The web sample is fairly similar to the total sample in sex and race.

Key Demographics of Web and Total Respondents

Appendix B: The News Sources

In Wave 1 of the American Trends Panel questionnaire, web respondents were asked a series of questions about news sources for information about government and politics. Respondents were first asked whether they have heard of 36 sources. Icons for the sources were arrayed on two screens of 18 sources each, randomized within each screen, as shown below.3 Respondents first clicked on the icons of the sources they have heard of. Of the sources that they had heard of, respondents were then asked whether they trust each source – again indicated by clicking on the icons. They then got another screen which showed the sources they had heard of but had not indicated that they trusted, and were asked if they distrust any of those remaining sources. If a respondent had heard of a source but did not indicate trust or distrust of it, the response was considered “neither.” Finally, respondents were asked if they got news about government and politics in the past week from any of the sources that they heard of, in addition to local television news.

The News Sources

These sources (37 total, including local television news) were specifically chosen so as to ask respondents about a range of news media, both in terms of platform and audience size, including some sources with large mass audiences as well as some niche sources. Most of the sources are drawn from those asked about in past Pew Research Center surveys on media consumption. Many of these sources are widely known and have large audiences. From this initial list, researchers went through an iterative process to add additional sources to provide a greater range in the news media environment – including adding more international, radio and primarily digital sources. The final list is based on results of a pilot test by the Pew Research Center, along with audience estimates and whether the outlets are sources for government and politics.

[along with the Economist and the Wall Street Journal]

In addition to this series of questions about these specific sources, respondents were also asked in an open-ended question to volunteer their main source for news about government and politics. This allowed respondents to name any source, not limiting them to the specific ones asked about. Any outlet that was named by at least .5% of respondents is listed individually in the topline. All sources that were mentioned by less than .5% of respondents are grouped together as “other.”

Appendix C: Trust and Distrust of News Sources by Ideological Group

Views of News Sources Among Those with Mostly Liberal Political Values
Views of News Sources Among Those with Ideologically Mixed Political Values
Views of News Sources Among Those with Mostly Conservative Political Values
Views of News Sources Among Those with Consistently Conserv. Political Values

About the Study

This report is part of a series by the Pew Research Center aimed at understanding the nature and scope of political polarization in the American public, and how it interrelates with government, society and people’s personal lives. Data in this report are drawn from the first wave of the Pew Research Center’s American Trends Panel, conducted March 19-April 29, 2014 among 2,901 web respondents. The panel was recruited from a nationally representative survey, which was conducted by the Pew Research Center in early 2014 and funded in part by grants from the William and Flora Hewlett Foundation and the John D. and Catherine T. MacArthur Foundation and the generosity of Don C. and Jeane M. Bertsch. For more in this series, see: pewresearch.org/packages/political-polarization/.

The data in this report are based on two independent survey administrations with the same randomly selected, nationally representative group of respondents. The first is the center’s largest survey on domestic politics to date: the 2014 Political Polarization and Typology Survey, a telephone survey of just more than 10,000 Americans. A subset of these respondents was then impaneled into the newly created American Trends Panel (ATP) and most of the analysis in the survey is based on the first wave of the ATP, a survey conducted by web and telephone.

About the American Trends Panel

The American Trends Panel (ATP), created by the Pew Research Center, is a nationally representative panel of randomly selected U.S. adults living in households. Respondents who self-identify as internet users (representing 89% of U.S. adults) participate in the panel via monthly self-administered Web surveys, and those who do not use the internet participate via telephone or mail. The panel is being managed by Abt SRBI.

Data in this report are drawn from the first wave of the panel, conducted March 19-April 29, 2014 among 2,901 web respondents. The margin of sampling error for the web sample of 2,901 respondents is plus or minus 2.3 percentage points. Please see Appendix A for information regarding the decision to field the survey only with the web-based portion of the panel, rather than including the additional 11 percent of Americans that report not having internet access.

All current members of the American Trends Panel were originally recruited from the 2014 Political Polarization and Typology Survey, a large (n=10,013) national landline and cellphone random digit dial (RDD) survey conducted January 23rd to March 16th, 2014, in English and Spanish. At the end of that survey, respondents were invited to join the panel. The invitation was extended to all respondents who use the internet (from any location) and a random subsample of respondents who do not use the internet.4

Of the 10,013 adults interviewed, 9,809 were invited to take part in the panel. A total of 5,338 agreed to participate and provided either a mailing address or an email address to which a welcome packet, a monetary incentive and future survey invitations could be sent. Panelists also receive a small monetary incentive after participating in each wave of the survey.

The ATP data were weighted in a multi-step process that begins with a base weight incorporating the respondents’ original survey selection probability and the fact that some panelists were subsampled for invitation to the panel. Next, an adjustment was made for the fact that the propensity to join the panel varied across different groups in the sample. The final step in the weighting uses an iterative technique that matches gender, age, education, race, Hispanic origin and region to parameters from the U.S. Census Bureau’s 2012 American Community Survey. Population density is weighted to match the 2010 U.S. Decennial Census. Telephone service is weighted to estimates of telephone coverage for 2014 that were projected from the January-June 2013 National Health Interview Survey.  It also adjusts for party affiliation using an average of the three most recent Pew Research Center general public telephone surveys, and for internet use using as a parameter a measure from the 2014 Survey of Political Polarization. Sampling errors and statistical tests of significance take into account the effect of weighting. The Hispanic sample in the American Trends Panel is predominantly native born and English speaking. In addition to sampling error, one should bear in mind that question wording and practical difficulties in conducting surveys can introduce error or bias into the findings of opinion polls.

The Web component of the first wave had a response rate of 61% (2,901 responses among 4,753 Web-based individuals enrolled in the panel. Taking account of the response rate for the 2014 Survey of Political Polarization (10.6%), the cumulative response rate for the first ATP wave is 3.6%.

The accompanying table shows the unweighted sample sizes and the error attributable to sampling that would be expected at the 95% level of confidence for selected groups discussed in the report.

Sample Size and Margin of Error for American Trends Panel (Wave 1)

Ideological Consistency Scale

Ideological consistency used throughout this report is based on a scale composed of 10 questions asked on Pew Research Center surveys going back to 1994 to gauge people’s ideological worldviews. The questions cover a range of political values including attitudes about size and scope of government, the social safety net, immigration, homosexuality, business, the environment, foreign policy and racial discrimination. These questions were asked in the initial 10,013 respondent telephone survey.

The scale is designed to measure how consistently liberal or conservative people’s responses are across these various dimensions of political thinking (what some refer to as ideological ‘constraint’). Note that where people fall on this scale does not always align with whether they think of themselves as liberal, moderate or conservative. (See here for more details on the relationship between self-identification and placement on this scale). Full details on the scale, including full question wording for all items, can be found in Appendix A of the June 12, 2014 report “Political Polarization in the American Public.”

© Pew Research Center, 2014