Growing shares of U.S. adults say they are using Instagram, TikTok, WhatsApp and Reddit, but YouTube still rises to the top
BYJeffrey Gottfried and Eugenie Park
About Pew Research Center
Pew Research Center is a nonpartisan, nonadvocacy fact tank that informs the public about the issues, attitudes and trends shaping the world. It does not take policy positions. The Center conducts public opinion polling, demographic research, computational social science research and other data-driven research. It studies politics and policy; news habits and media; the internet and technology; religion; race and ethnicity; international affairs; social, demographic and economic trends; science; research methodology and data science; and immigration and migration. Pew Research Center is a subsidiary of The Pew Charitable Trusts, its primary funder.
Growing shares of U.S. adults say they are using Instagram, TikTok, WhatsApp and Reddit, but YouTube still rises to the top
How we did this
To better understand which social media platforms Americans use, Pew Research Center surveyed 5,022 U.S. adults from Feb. 5 to June 18, 2025. SSRS conducted this National Public Opinion Reference Survey (NPORS) for the Center using address-based sampling and a multimode protocol that included web, mail and phone. This way nearly all U.S. adults have a chance of selection. The survey is weighted to be representative of the U.S. adult population by gender, race and ethnicity, education, and other categories.
Surveys fielded before 2023 were conducted via phone. For more on the mode shift in 2023, read our Q&A.
We also surveyed 5,123 U.S. adults from Feb. 24 to March 2, 2025, to understand how frequently Americans use four specific platforms: YouTube, Facebook, TikTok and X (formerly known as Twitter). Everyone who took part in this survey is a member of the Center’s American Trends Panel (ATP), a group of people recruited through national, random sampling of residential addresses who have agreed to take surveys regularly. This kind of recruitment gives nearly all U.S. adults a chance of selection. Interviews were conducted either online or by telephone with a live interviewer. The survey is weighted to be representative of the U.S. adult population by gender, race, ethnicity, partisan affiliation, education and other factors. Read more about the ATP’s methodology.
Even as debates continue about the role of social media in our country, including on censorship and its impact on youth, Americans use a range of online platforms, and many do so daily.
Which online platforms do Americans most commonly use?
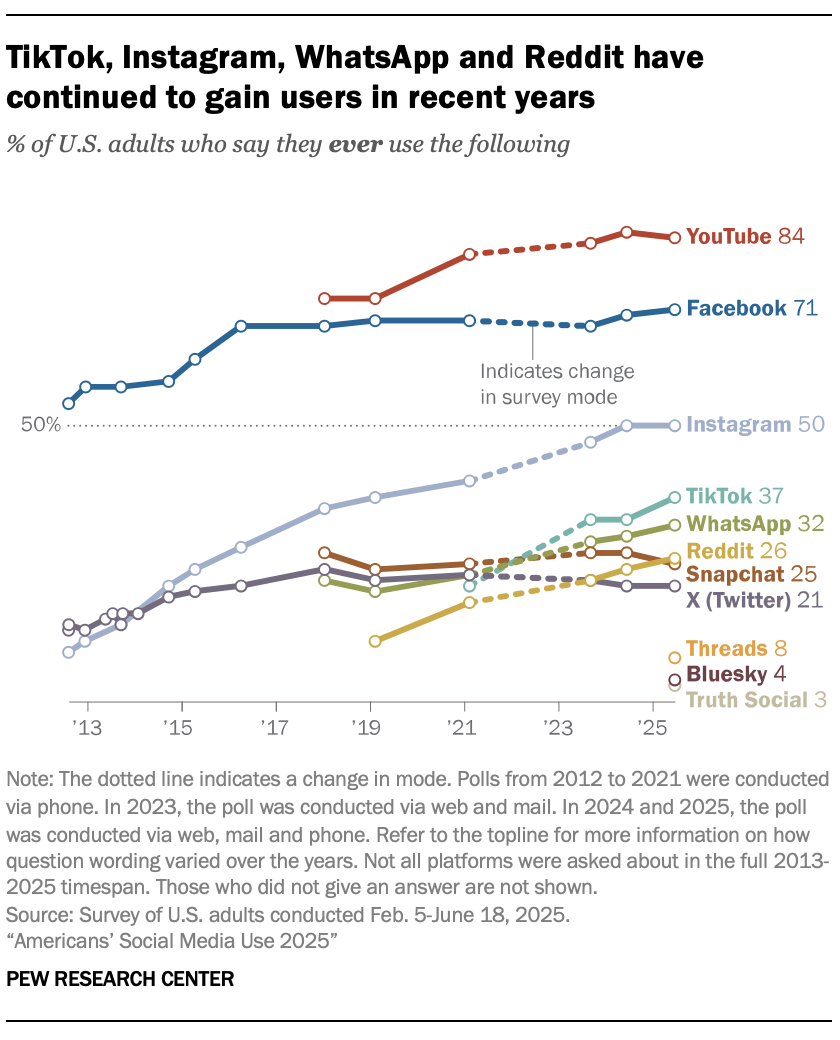
YouTube and Facebook remain the most widely used online platforms. The vast majority of U.S. adults (84%) say they ever use YouTube. Most Americans (71%) also report using Facebook. These findings are according to a Pew Research Center survey of 5,022 U.S. adults conducted Feb. 5-June 18, 2025.
Half of adults say they use Instagram, making it the only other platform in our survey used by at least 50% of Americans.
Smaller shares use the other sites and apps we asked about, such as TikTok (37%) and WhatsApp (32%). Somewhat fewer say the same of Reddit,Snapchat and X (formerly Twitter).
This year we also asked about three platforms that are used by about one-in-ten or fewer U.S. adults: Threads, Bluesky, and Truth Social.
The Center has long tracked use of many of these platforms. Over the past few years, four of them have grown in overall use among U.S. adults – TikTok, Instagram, WhatsApp and Reddit.
TikTok: 37% of U.S. adults report using the platform, which is slightly up from last year and up from 21% in 2021.
Instagram: Half of U.S. adults now report using it, which is on par with last year but up from 40% in 2021.
WhatsApp and Reddit: About a third say they use WhatsApp, up from 23% in 2021. And 26% today report using Reddit, compared with 18% four years ago.
While YouTube and Facebook continue to sit at the top, the shares of Americans who report using them have remained relatively stable in recent years.1
Large age gaps in use of many platforms
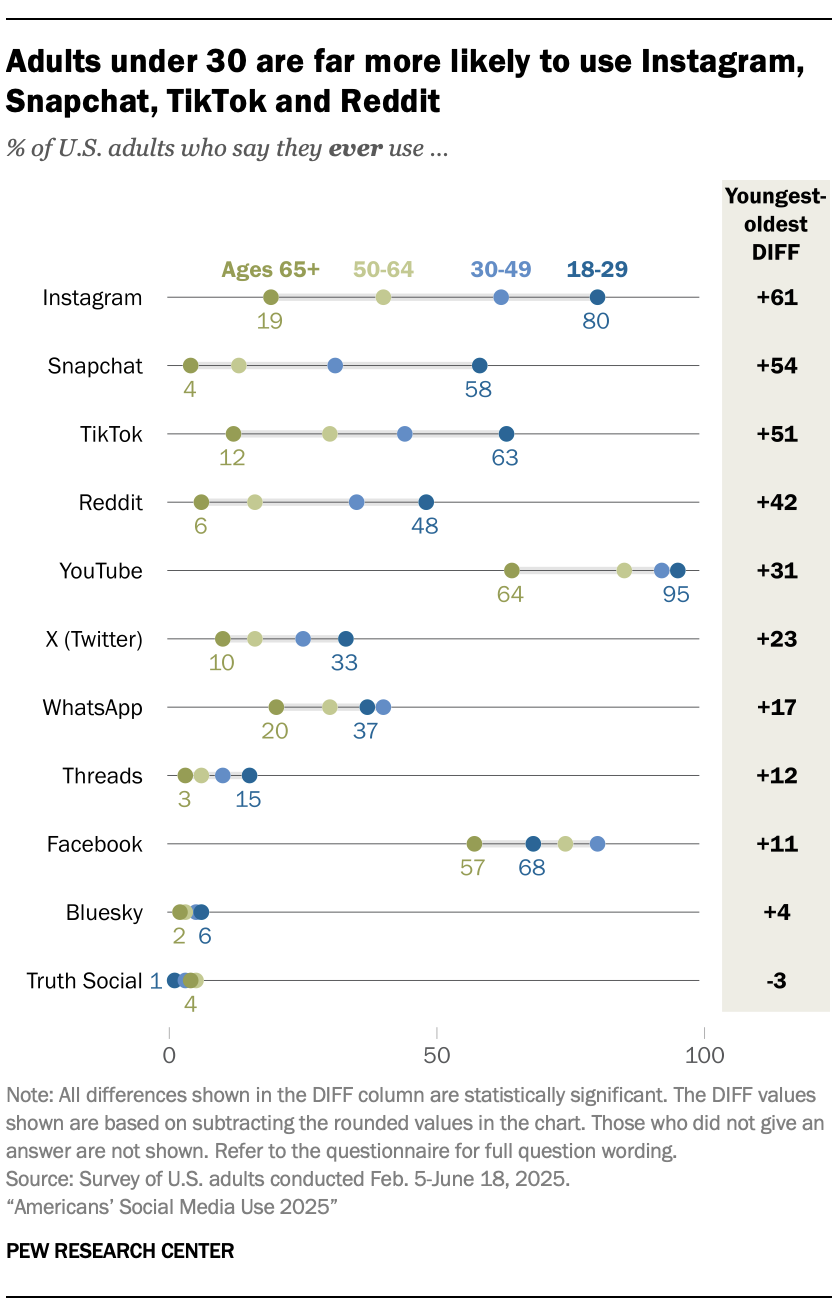
Adults under 30 are more likely than older adults to use most of these platforms. Consistent with previous Center data, the survey finds that the youngest adults particularly stand out in their use of Instagram, Snapchat, TikTok and Reddit.
For instance, eight-in-ten adults ages 18 to 29 say they use Instagram. This is higher than the shares seen among older age groups – especially adults ages 65 and older (19%).
YouTube and Facebook are the only sites asked about that a majority in all age groups use, though for YouTube, the youngest adults are still the most likely to do so. This differs from Facebook, where 30- to 49-year-olds most commonly say they use it (80%).
Differences by gender, race and ethnicity, education, and party
While some of the biggest demographic differences in social media use are across age groups, use also varies by other factors.
By gender
Women stand out in their use of several platforms, including Facebook, Instagram and TikTok. For instance, more than half of women report using Instagram (55%), compared with under half of men (44%). Alternatively, men are more likely to report using platforms such as X and Reddit.
By race and ethnicity
White adults are less likely than Black and Hispanic adults – and sometimes Asian adults – to use online platforms such as Instagram, TikTok and WhatsApp. For instance, 45% of White adults report using Instagram, compared with larger shares among Hispanic (62%), Asian (58%) and Black adults (54%).
By education
Americans with higher levels of formal education are more likely to report using some sites and apps, including Reddit, WhatsApp and Instagram. With Reddit, for example, about four-in-ten adults with at least a college degree say they use the platform. Smaller shares of those with some college education (28%) or a high school diploma or less education (15%) say this.
By contrast, those with some college or less education are more likely to use TikTok than those with at least a college degree.
By party
Democrats and Democratic-leaning independents are more likely than Republicans and Republican leaners to report using WhatsApp, Reddit, TikTok, Bluesky and Threads.
By comparison, Republicans are more likely to say they use X and Truth Social. For instance, 24% of Republicans now report using X, compared with 19% of Democrats. However, just two years ago Democrats were more likely to report using the platform than Republicans (26% vs. 20%).
Frequency of social media use
In addition to understanding if people use a particular site or app, we also asked Americans how frequently they do so. These questions were asked in a separate survey of 5,123 U.S. adults conducted from Feb. 24 to March 2, 2025.
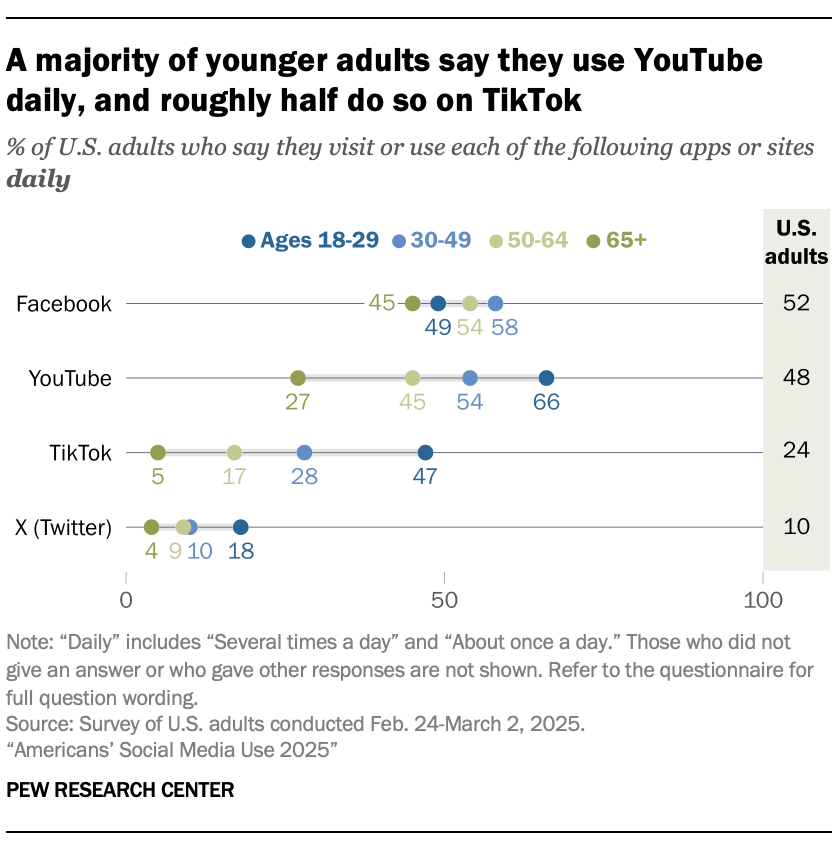
Greater shares of Americans visit Facebook and YouTube daily than other sites. About half of U.S. adults say they visit each of these platforms at least once a day. This includes 37% who visit Facebook several times a day, and 33% who say the same of YouTube.
About a quarter (24%) say they are daily users of TikTok. Fewer (10%) report daily use of X.
Daily use of social media, by age
Younger adults are far more likely than older adults to report using YouTube and TikTok daily.
Roughly half of 18- to 29-year-olds say they go on TikTok at least once a day, compared with just 5% of adults ages 65 and older.
There is also an age gap for X, though it’s more modest.
For Facebook, the two middle age groups are most likely to report going on it daily: 58% of 30- to 49-year-olds and 54% of 50- to 64-year-olds say this.
Appendix
Acknowledgments
This report is a collaborative effort based on the input and analysis of the following individuals. Find related reports online at pewresearch.org/internet.
Primary researchers
Jeffrey Gottfried, Associate Director, Internet and Technology Research Eugenie Park, Research Assistant
Research team
Monica Anderson, Director, Internet and Technology Research Colleen McClain, Senior Researcher William Bishop, Research Associate Michelle Faverio, Research Associate Olivia Sidoti, Research Analyst
Editorial and graphic design
Rebecca Leppert, Editorial Specialist Kaitlyn Radde, Associate Information Graphics Designer
Communications and web publishing
Haley Nolan, Communications Manager Maya Pottiger, Communications Associate Sara Atske, Digital Producer
In addition, the project benefited greatly from the guidance of Pew Research Center’s methodology team: Andrew Mercer, Courtney Kennedy, Scott Keeter, Ashley Amaya, Dorene Asare-Marfo, Anna Brown, Arnold Lau and Dana Popky.
Methodology
2025 National Public Opinion Reference Survey methodology
Summary
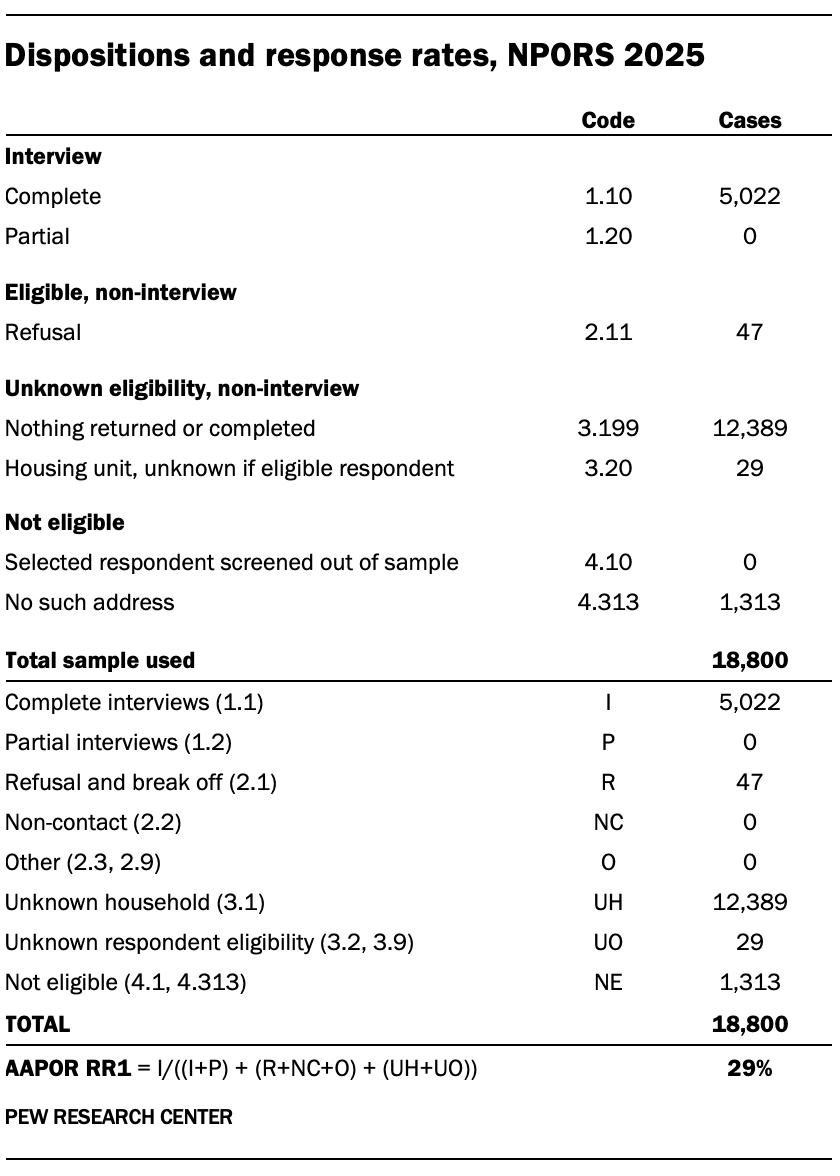
SSRS conducted the National Public Opinion Reference Survey (NPORS) for Pew Research Center using address-based sampling and a multimode protocol. The survey was fielded from Feb. 5, 2025, to June 18, 2025. Participants were first mailed an invitation to complete an online survey. A paper survey was later mailed to those who did not respond. Additionally, the mailings invited participants to call a toll-free number to take the survey over the phone with a live interviewer. In total, 2,349 respondents completed the survey online, 2,331 respondents completed the paper survey, and 342 respondents completed the survey over the phone (total n=5,022). The survey was administered in English and Spanish. The AAPOR Response Rate 1 was 29%.
Sample definition
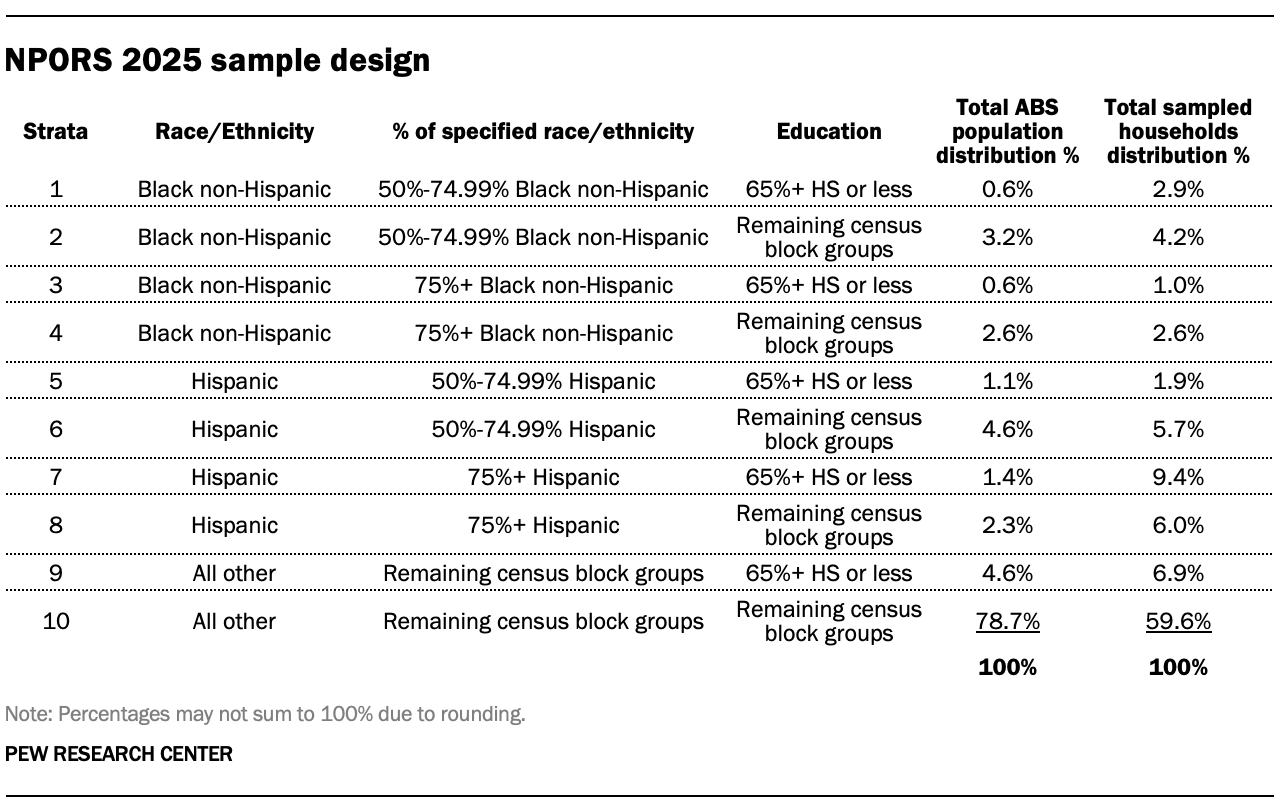
The sample was drawn from the U.S. Postal Service Computerized Delivery Sequence File and was provided by MSG (Marketing Systems Group). Occupied residential addresses (including “drop points”) in all U.S. states (including Alaska and Hawaii) and the District of Columbia had a nonzero chance of selection. The draw was a national, stratified random sample, with differential probabilities of selection across the mutually exclusive strata. SSRS designed the sample plan as shown in the table above.
Mailing protocol
SSRS sent initial mailings in a 9-by-12-inch window envelope via first-class mail to the 18,800 sampled households. These packets included two $1 bills (visible from the outside of the envelope) and a letter that asked a member of the household to complete the survey. The letter provided a URL for the online survey; a toll-free call-in number; a password to enter on the online survey’s landing page, or tell the telephone interviewers if they chose to call in; and a FAQ section printed on the reverse side. If two or more adults were in the household, the letter asked the adult with the next birthday to complete the survey. Nonresponding households were later sent a reminder postcard and then a reminder letter via first-class mail.
After the web portion of the data collection period had ended, SSRS sent nonresponding households with a deliverable address a 9-by-12-inch Priority Mail window envelope. The Priority envelope contained a letter with a FAQ section printed on the reverse side, a visible $5 bill, a paper version of the survey and a postage-paid return envelope. The paper survey was one 11-by-17-inch page folded booklet-style. The within-household selection instructions were identical to those used in the earlier online survey request. The same households were later sent a second envelope containing another copy of the paper questionnaire by first-class mail.
The initial mailing was sent out in two separate launches: soft launch and full launch. The soft launch made up 5% of the sample and was sent out several days earlier than the full launch. The full launch consisted of the remaining sample.
Households in Hispanic-dominant census block groups received all materials in English and Spanish. All other households received materials in English only. Those who completed the survey online or returned the completed paper survey were sent a $10 post-paid incentive.
Questionnaire development and testing
Pew Research Center developed the questionnaire in consultation with SSRS. The online questionnaire was tested on both desktop and mobile devices. The test data was analyzed to ensure the logic and randomizations were working as intended before the survey was launched.
Weighting
The survey was weighted to support reliable inference from the sample to the target population of U.S. adults. The weight was created using a multistep process that includes a base weight adjusting for differential probabilities of selection and a raking calibration that aligns the survey with the population benchmarks. The process starts with the base weight, which accounted for the probability of selection of the address from the U.S. Postal Service Computerized Delivery Sequence File frame, as well as the number of adults living in the household, and incorporated an adaptive mode adjustment for cases that responded in an offline mode.
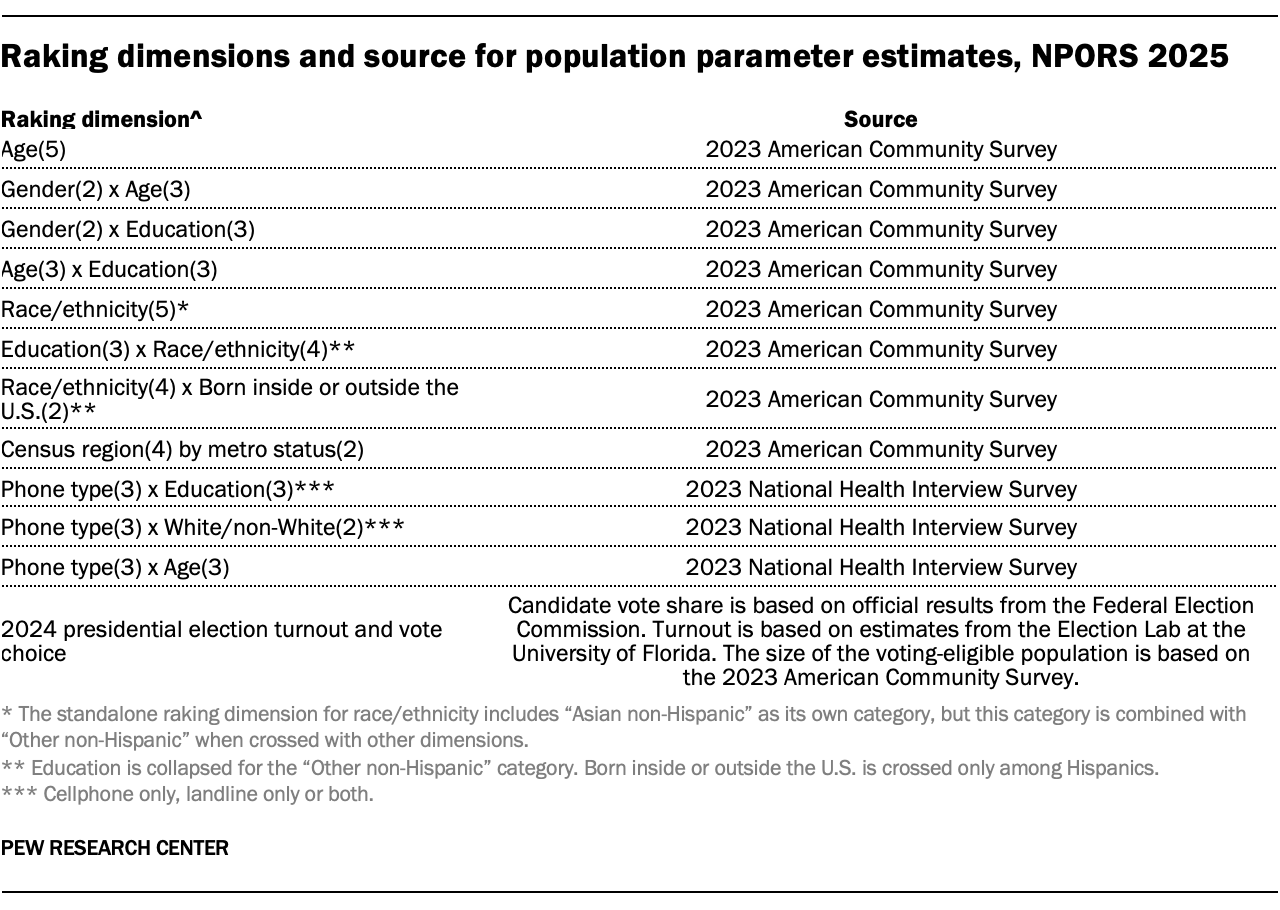
Then the base weights are calibrated to population benchmarks using raking, or iterative proportional fitting. The raking dimensions and the source for the population parameter estimates are reported in the table below. All raking targets are based on the noninstitutionalized U.S. adult population (ages 18 and older). These weights are trimmed at the 1st and 99th percentiles to reduce the loss in precision stemming from variance in the weights.
Design effect and margin of error
Weighting and survey design features that depart from simple random sampling tend to result in an increase in the variance of survey estimates. This increase, known as the design effect, or “deff,” should be incorporated into the margin of error, standard errors and tests of statistical significance. The overall design effect for a survey is commonly approximated as 1 plus the squared coefficient of variation of the weights.
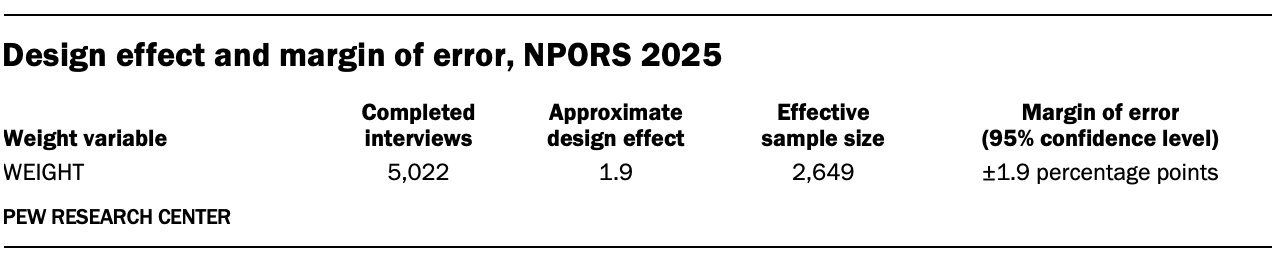
For this survey, the margin of error (half-width of the 95% confidence interval) incorporating the design effect for full sample estimates at 50% is plus or minus 1.9 percentage points. Estimates based on subgroups will have larger margins of error. It is important to remember that random sampling error is only one possible source of error in a survey estimate. Other sources, such as question wording and reporting inaccuracy, may contribute additional error. A summary of the weights and their associated design effect is reported in the table below.
Dispositions
The table below reports the disposition of all sampled households for the survey.
2025 National Public Opinion Reference Survey sample sizes and margins of error
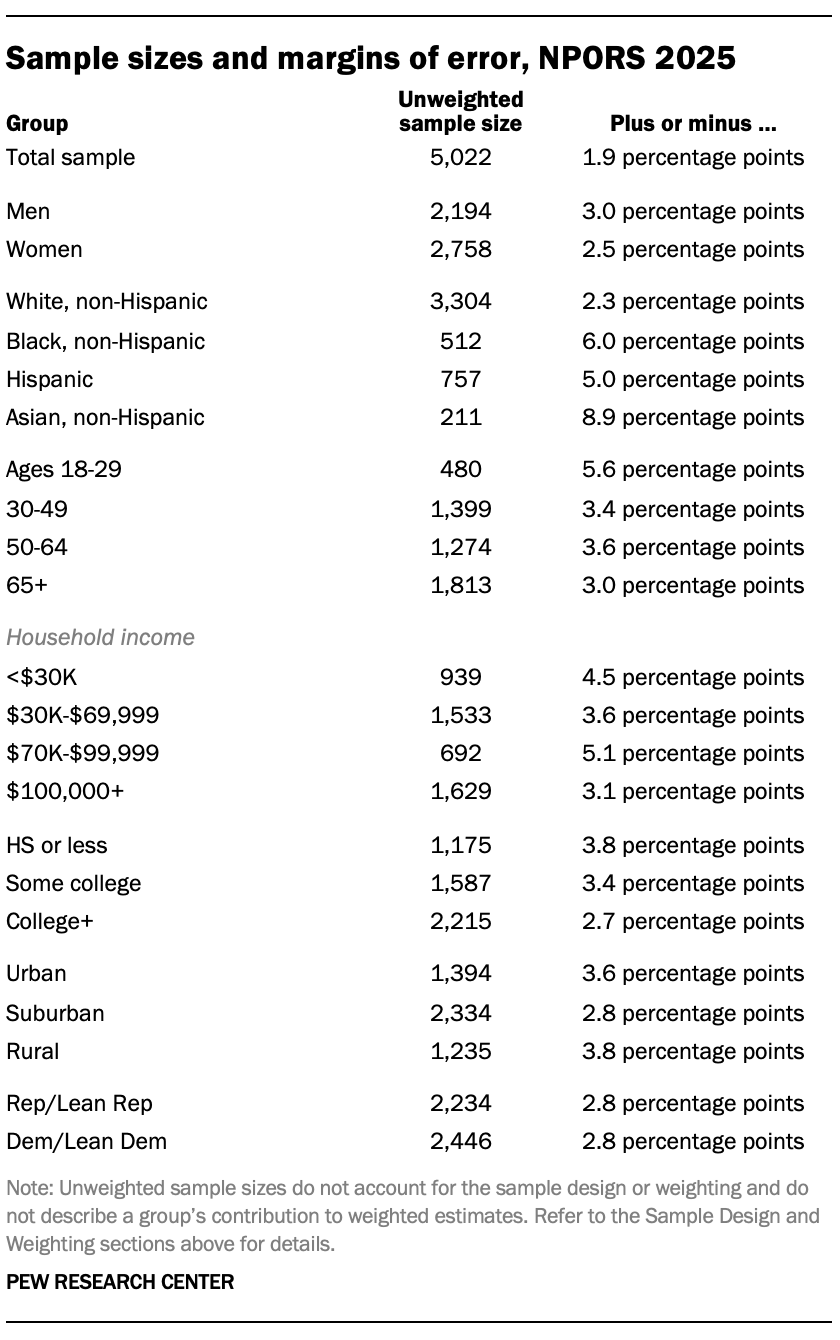
The following table shows the unweighted sample sizes and the error attributable to sampling that would be expected at the 95% level of confidence for different groups in the 2025 National Public Opinion Reference Survey (NPORS).
Sample sizes and sampling errors for other subgroups are available upon request. In addition to sampling error, one should bear in mind that question wording and practical difficulties in conducting surveys can introduce error or bias into the findings of opinion polls.
The American Trends Panel survey methodology
Overview
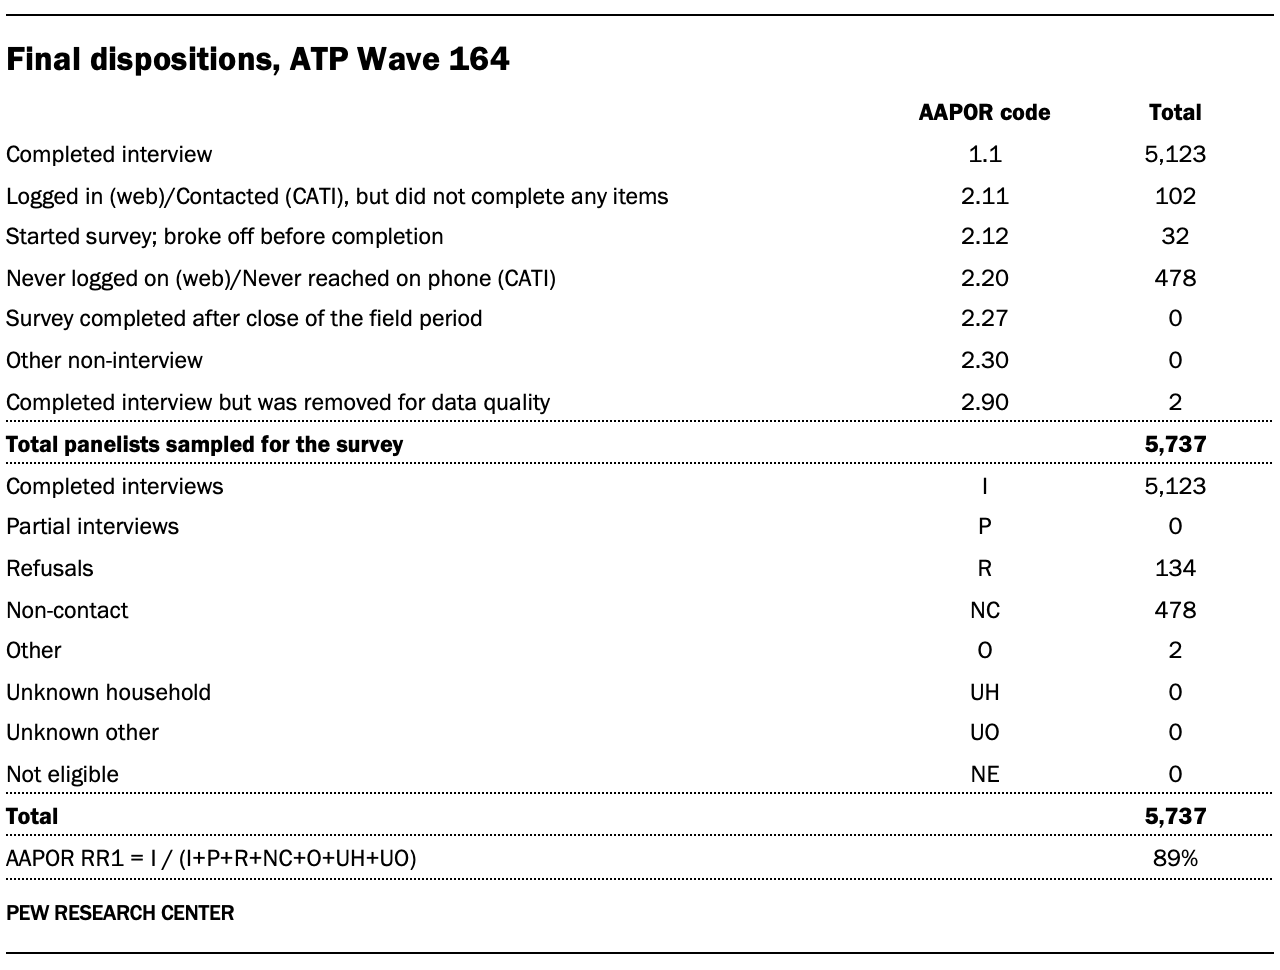
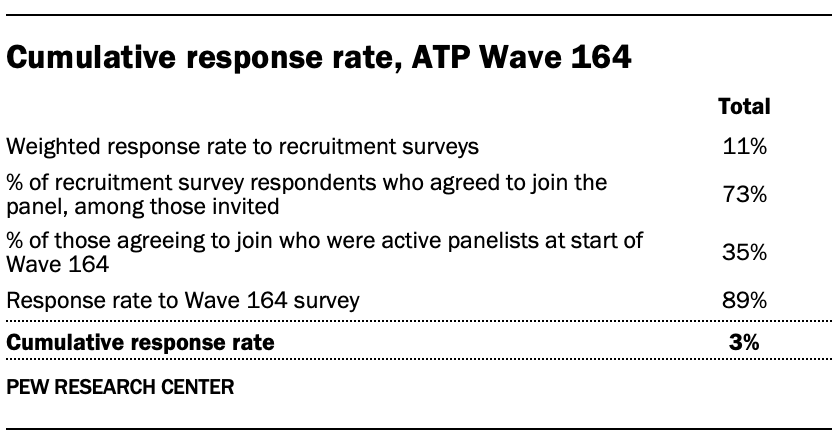
Data in this report comes from Wave 164 of the American Trends Panel (ATP), Pew Research Center’s nationally representative panel of randomly selected U.S. adults. The survey was conducted from Feb. 24 to March 2, 2025. A total of 5,123 panelists responded out of 5,737 who were sampled, for a survey-level response rate of 89%.
The cumulative response rate accounting for nonresponse to the recruitment surveys and attrition is 3%. The break-off rate among panelists who logged on to the survey and completed at least one item is 1%. The margin of sampling error for the full sample of 5,123 respondents is plus or minus 1.6 percentage points.
The survey includes an oversample of non-Hispanic Asian adults in order to provide more precise estimates of the opinions and experiences of these smaller demographic subgroups. These oversampled groups are weighted back to reflect their correct proportions in the population.
SSRS conducted the survey for Pew Research Center via online (n=4,939) and live telephone (n=184) interviewing. Interviews were conducted in both English and Spanish.
Since 2018, the ATP has used address-based sampling (ABS) for recruitment. A study cover letter and a pre-incentive are mailed to a stratified, random sample of households selected from the U.S. Postal Service’s Computerized Delivery Sequence File. This Postal Service file has been estimated to cover 90% to 98% of the population.2 Within each sampled household, the adult with the next birthday is selected to participate. Other details of the ABS recruitment protocol have changed over time but are available upon request.3 Prior to 2018, the ATP was recruited using landline and cellphone random-digit-dial surveys administered in English and Spanish.
A national sample of U.S. adults has been recruited to the ATP approximately once per year since 2014. In some years, the recruitment has included additional efforts (known as an “oversample”) to improve the accuracy of data for underrepresented groups. For example, Hispanic adults, Black adults and Asian adults were oversampled in 2019, 2022 and 2023, respectively.
Sample design
The overall target population for this survey was noninstitutionalized persons ages 18 and older living in the United States. It featured a stratified random sample from the ATP in which non-Hispanic Asian adults were selected with certainty. The remaining panelists were sampled at rates designed to ensure that the share of respondents in each stratum is proportional to its share of the U.S. adult population to the greatest extent possible. Respondent weights are adjusted to account for differential probabilities of selection as described in the Weighting section below.
Questionnaire development and testing
The questionnaire was developed by Pew Research Center in consultation with SSRS. The web program used for online respondents was rigorously tested on both PC and mobile devices by the SSRS project team and Pew Research Center researchers. The SSRS project team also populated test data that was analyzed in SPSS to ensure the logic and randomizations were working as intended before launching the survey.
Incentives
All respondents were offered a post-paid incentive for their participation. Respondents could choose to receive the post-paid incentive in the form of a check or gift code to Amazon.com, Target.com or Walmart.com. Incentive amounts ranged from $5 to $20 depending on whether the respondent belongs to a part of the population that is harder or easier to reach. Differential incentive amounts were designed to increase panel survey participation among groups that traditionally have low survey response propensities.
Data collection protocol
The data collection field period for this survey was Feb. 24 to March 2, 2025. Surveys were conducted via self-administered web survey or by live telephone interviewing.
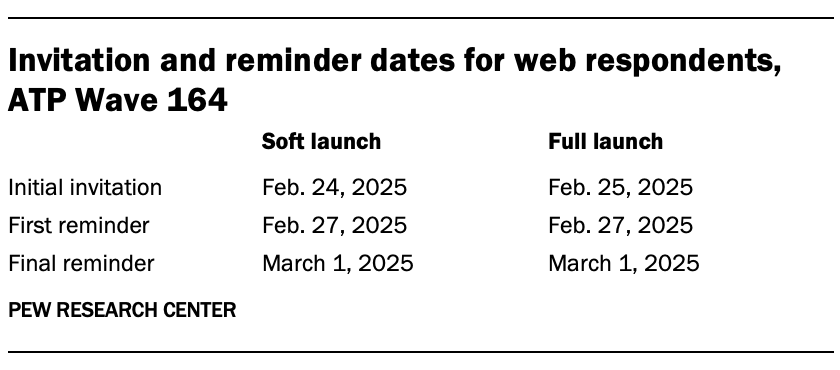
For panelists who take surveys online: Postcard notifications were mailed to a subset on Feb. 24.4 Survey invitations were sent out in two separate launches: soft launch and full launch. Sixty panelists were included in the soft launch, which began with an initial invitation sent on Feb. 24. All remaining English- and Spanish-speaking sampled online panelists were included in the full launch and were sent an invitation on Feb 25.
Panelists participating online were sent an email invitation and up to two email reminders if they did not respond to the survey. ATP panelists who consented to SMS messages were sent an SMS invitation with a link to the survey and up to two SMS reminders.
For panelists who take surveys over the phone with a live interviewer: Prenotification postcards were mailed on Feb. 21, 2025. Soft launch took place on Feb. 24, 2025, and involved dialing until a total of three interviews had been completed. All remaining English- and Spanish-speaking sampled phone panelists’ numbers were dialed throughout the remaining field period. Panelists who take surveys via phone can receive up to six calls from trained SSRS interviewers.
Data quality checks
To ensure high-quality data, Center researchers performed data quality checks to identify any respondents showing patterns of satisficing. This includes checking for whether respondents left questions blank at very high rates or always selected the first or last answer presented. As a result of this checking, two ATP respondents were removed from the survey dataset prior to weighting and analysis.
Weighting
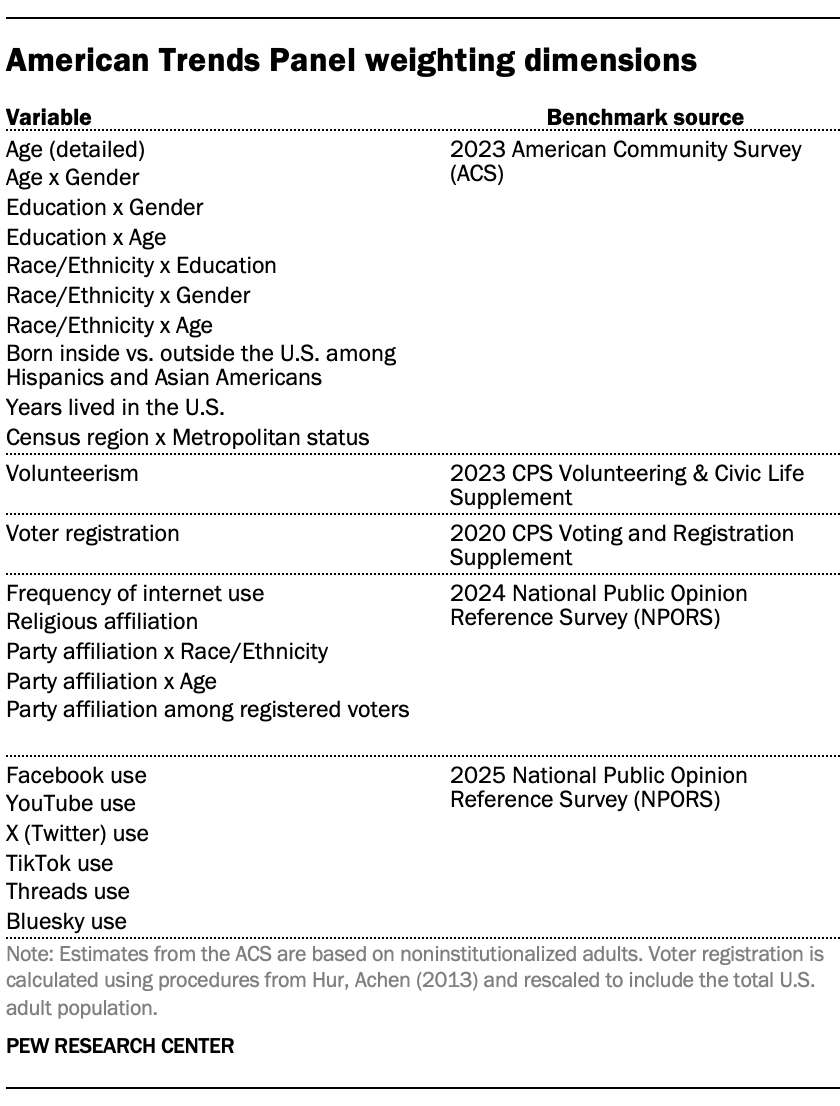
The ATP data is weighted in a process that accounts for multiple stages of sampling and nonresponse that occur at different points in the panel survey process. First, each panelist begins with a base weight that reflects their probability of recruitment into the panel. These weights are then calibrated to align with the population benchmarks in the accompanying table to correct for nonresponse to recruitment surveys and panel attrition. If only a subsample of panelists was invited to participate in the wave, this weight is adjusted to account for any differential probabilities of selection.
Among the panelists who completed the survey, this weight is then calibrated again to align with the population benchmarks identified in the accompanying table and trimmed at the 1st and 99th percentiles to reduce the loss in precision stemming from variance in the weights. Sampling errors and tests of statistical significance take into account the effect of weighting.
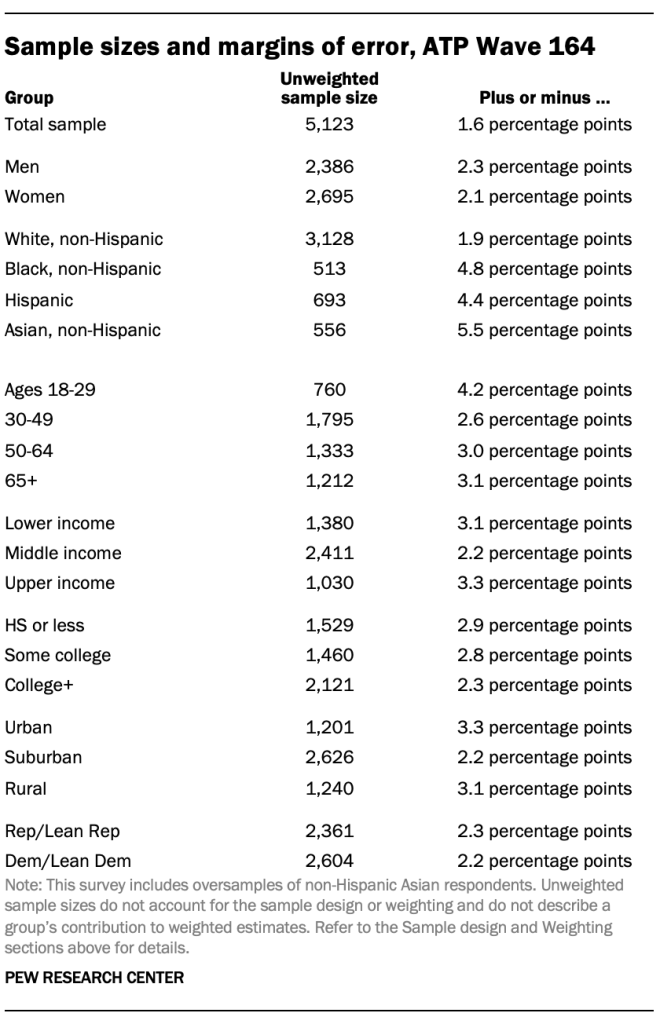
The following table shows the unweighted sample sizes and the error attributable to sampling that would be expected at the 95% level of confidence for different groups in the survey.
Sample sizes and sampling errors for other subgroups are available upon request. In addition to sampling error, one should bear in mind that question wording and practical difficulties in conducting surveys can introduce error or bias into the findings of opinion polls.
Dispositions and response rates
How family income tiers are calculated
Family income data reported in this study is adjusted for household size and cost-of-living differences by geography. Panelists then are assigned to income tiers that are based on the median adjusted family income of all American Trends Panel members. The process uses the following steps:
First, panelists are assigned to the midpoint of the income range they selected in a family income question that was measured on either the most recent annual profile survey or, for newly recruited panelists, their recruitment survey. This provides an approximate income value that can be used in calculations for the adjustment.
Next, these income values are adjusted for the cost of living in the geographic area where the panelist lives. This is calculated using price indexes published by the U.S. Bureau of Economic Analysis. These indexes, known as Regional Price Parities (RPP), compare the prices of goods and services across all U.S. metropolitan statistical areas as well as non-metro areas with the national average prices for the same goods and services. The most recent available data at the time of the annual profile survey is from 2022. Those who fall outside of metropolitan statistical areas are assigned the overall RPP for their state’s non-metropolitan area.
Family incomes are further adjusted for the number of people in a household using the methodology from Pew Research Center’s previous work on the American middle class. This is done because a four-person household with an income of say, $50,000, faces a tighter budget constraint than a two-person household with the same income.
Panelists are then assigned an income tier. “Middle-income” adults are in families with adjusted family incomes that are between two-thirds and double the median adjusted family income for the full ATP at the time of the most recent annual profile survey. The median adjusted family income for the panel is roughly $74,100. Using this median income, the middle-income range is about $49,400 to $148,200. Lower-income families have adjusted incomes less than $49,400 and upper-income families have adjusted incomes greater than $148,200 (all figures expressed in 2023 dollars and scaled to a household size of three). If a panelist did not provide their income and/or their household size, they are assigned “no answer” in the income tier variable.
Two examples of how a given area’s cost-of-living adjustment was calculated are as follows: the Pine Bluff metropolitan area in Arkansas is a relatively inexpensive area, with a price level that is 19.1% less than the national average. The San Francisco-Oakland-Berkeley metropolitan area in California is one of the most expensive areas, with a price level that is 17.9% higher than the national average. Income in the sample is adjusted to make up for this difference. As a result, a family with an income of $40,400 in the Pine Bluff area is as well off financially as a family of the same size with an income of $58,900 in San Francisco.