Pew Research Center

FOR RELEASE OCTOBER 8, 2025

How Parents Manage Screen Time for Kids

From YouTube to smartphones to tablets, tech is part of kids’ lives. AI chatbots are part of the mix now, too. While parents strive to manage screens, 42% say they could do better

BY Colleen McClain, Olivia Sidoti, Michelle Faverio and Suvi Lama

FOR MEDIA OR OTHER INQUIRIES:

Communications Department
202.419.4372
www.pewresearch.org

RECOMMENDED CITATION

Pew Research Center, October 2025, "How Parents Manage Screen Time for Kids"

About Pew Research Center

Pew Research Center is a nonpartisan, nonadvocacy fact tank that informs the public about the issues, attitudes and trends shaping the world. It does not take policy positions. The Center conducts public opinion polling, demographic research, computational social science research and other data-driven research. It studies politics and policy; news habits and media; the internet and technology; religion; race and ethnicity; international affairs; social, demographic and economic trends; science; research methodology and data science; and immigration and migration. Pew Research Center is a subsidiary of The Pew Charitable Trusts, its primary funder.

© Pew Research Center 2026

Table of contents

  • About Pew Research Center
  • How Parents Manage Screen Time for Kids
  • 1. How parents describe their kids’ tech use
  • 2. How parents approach their kids’ screen time
  • Appendix: Detailed tables
  • Acknowledgments
  • Methodology

How Parents Manage Screen Time for Kids

From YouTube to smartphones to tablets, tech is part of kids’ lives. AI chatbots are part of the mix now, too. While parents strive to manage screens, 42% say they could do better

How we did this

Pew Research Center conducted this study to understand how parents of kids ages 12 and younger approach their children’s technology use and screen time.

For this analysis, we surveyed 3,054 parents who have children ages 12 and under from May 13 to 26, 2025. The sample for this survey includes respondents from two different sources: Pew Research Center’s American Trends Panel (ATP) and SSRS’s Opinion Panel (OP). The ATP and OP are both groups of people recruited through national, random sampling of residential addresses who have agreed to take surveys regularly. This kind of recruitment gives nearly all U.S. adults a chance of selection.

Interviews were conducted either online or by telephone with a live interviewer. The survey is weighted to be representative of parents or guardians of children ages 12 and under by gender, race, ethnicity, partisan affiliation, education and other factors. Read more about the ATP’s methodology.

Separately, four online focus groups were also conducted from March 4 to 6, 2025, with a total of 20 U.S. parents or guardians of at least one child age 1 to 12. The goal of these discussions was to explore parents’ views on topics covered in the survey in more depth. They are not representative of all parents, nor do quotes selected represent the views of all group participants. Quotes are pulled from larger discussion, and some have been edited for concision and clarity.

Here are the questions used for this report, the topline and the methodology.

Terminology

“Parents of a child age 12 or younger” and “parents” refer to U.S. adults who are parents or guardians of at least one child age 12 or younger.

Parents with more than one child age 12 or younger were asked to answer about one randomly selected child and may have children in other age groups. Child age groups throughout the report refer to the randomly selected child.

Throughout this report, “older child” generally refers to a child age 5 or older.

Parenting today means making tough choices about technology. Screens can educate and entertain, but managing what kids watch – and how much – can leave parents feeling judged or like they should be doing more. Setting limits can be a challenge even for those with the youngest kids.
A bar chart showing Majorities of parents say their kids use tablets and smartphones; watching TV is especially common

A Pew Research Center survey of U.S. parents reveals how widespread technology is for kids ages 12 and younger – and the day-to-day reality of managing screen time as a parent. Among the takeaways:

Tablets and smartphones are common – TV even more so.

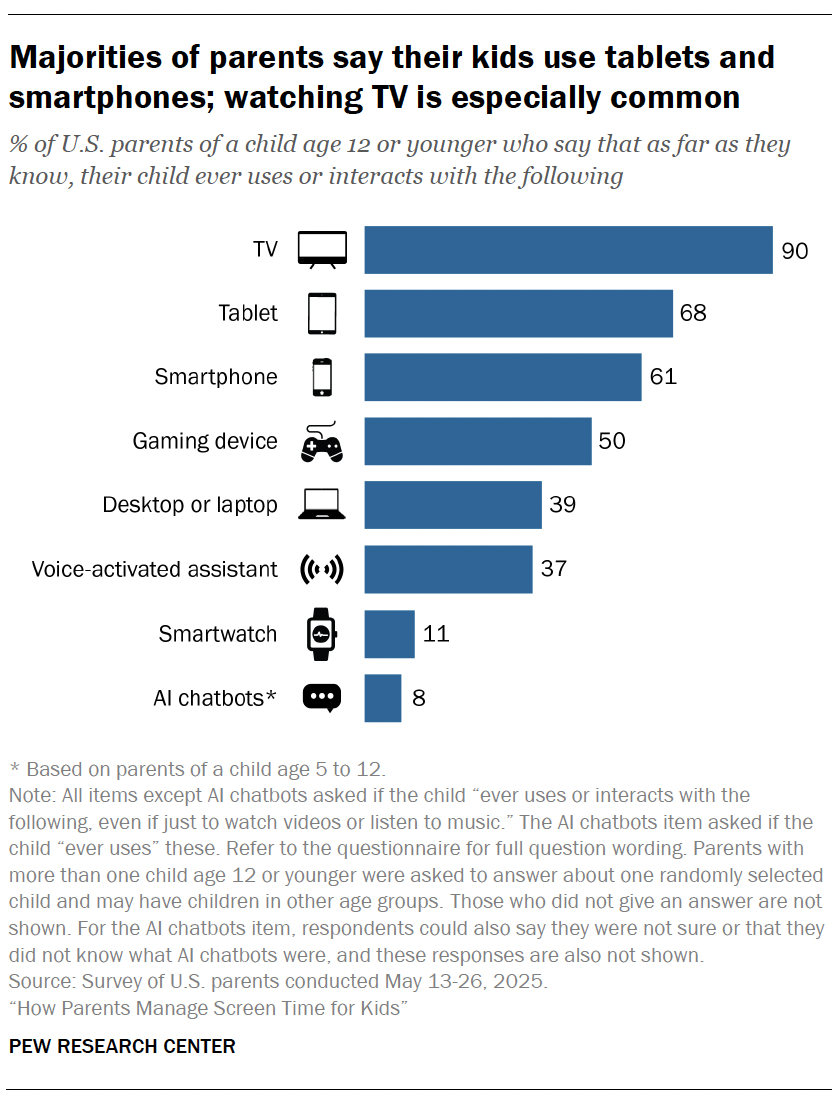
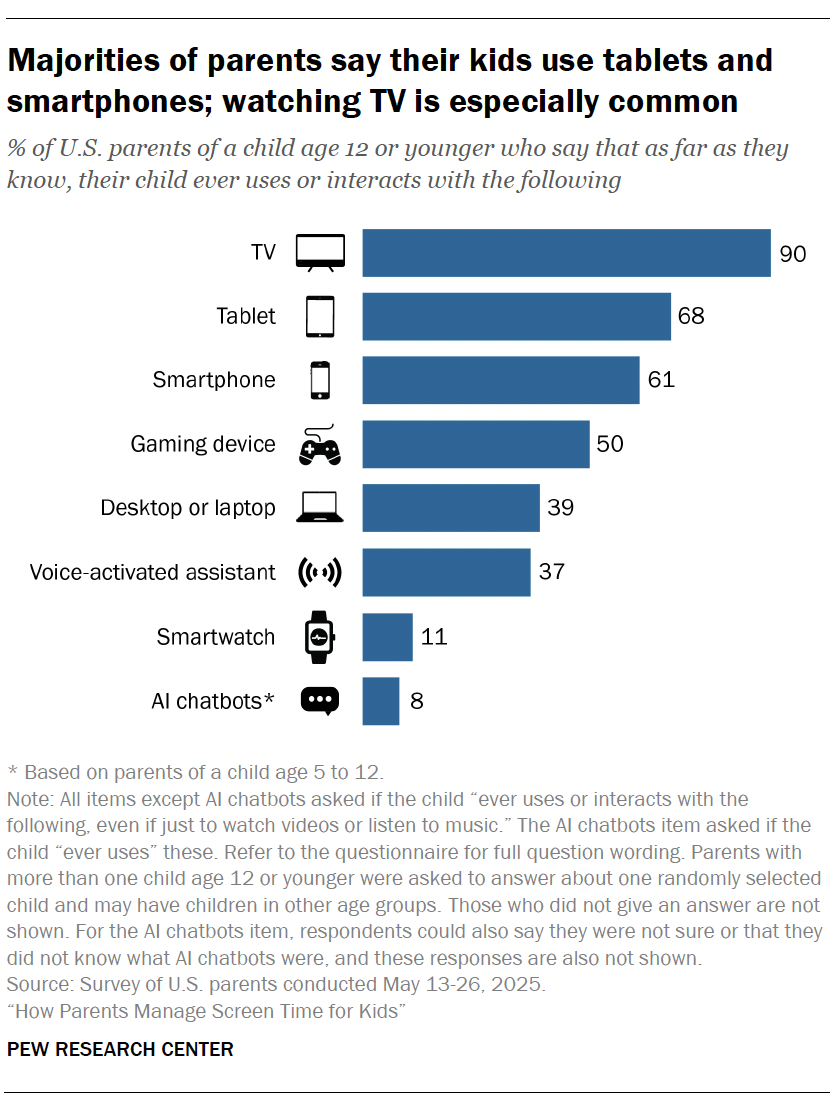
Nine-in-ten parents of kids ages 12 and younger say their child ever watches TV, 68% say they use a tablet and 61% say they use a smartphone.

Half say their child uses gaming devices. About four-in-ten say they use desktops or laptops.

AI is part of the mix.

About one-in-ten parents say their 5- to 12-year-old ever uses artificial intelligence chatbots like ChatGPT or Gemini.

Roughly four-in-ten parents with a kid 12 or younger say their child uses a voice assistant like Siri or Alexa. And 11% say their child uses a smartwatch.

Screens start young.

Some of the biggest debates around screen time center on the question: How young is too young?

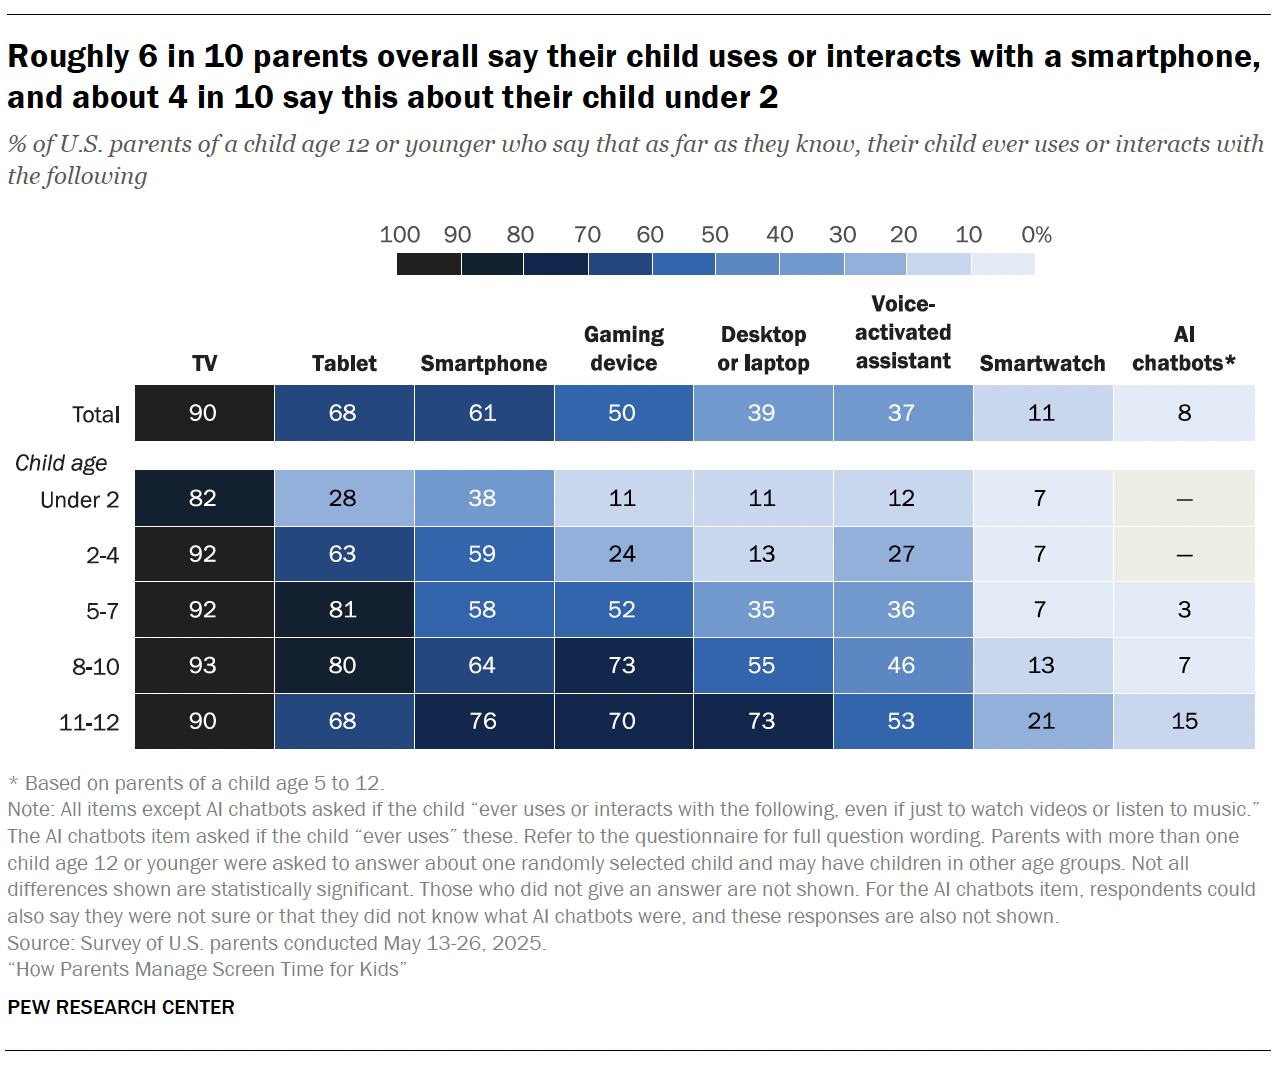
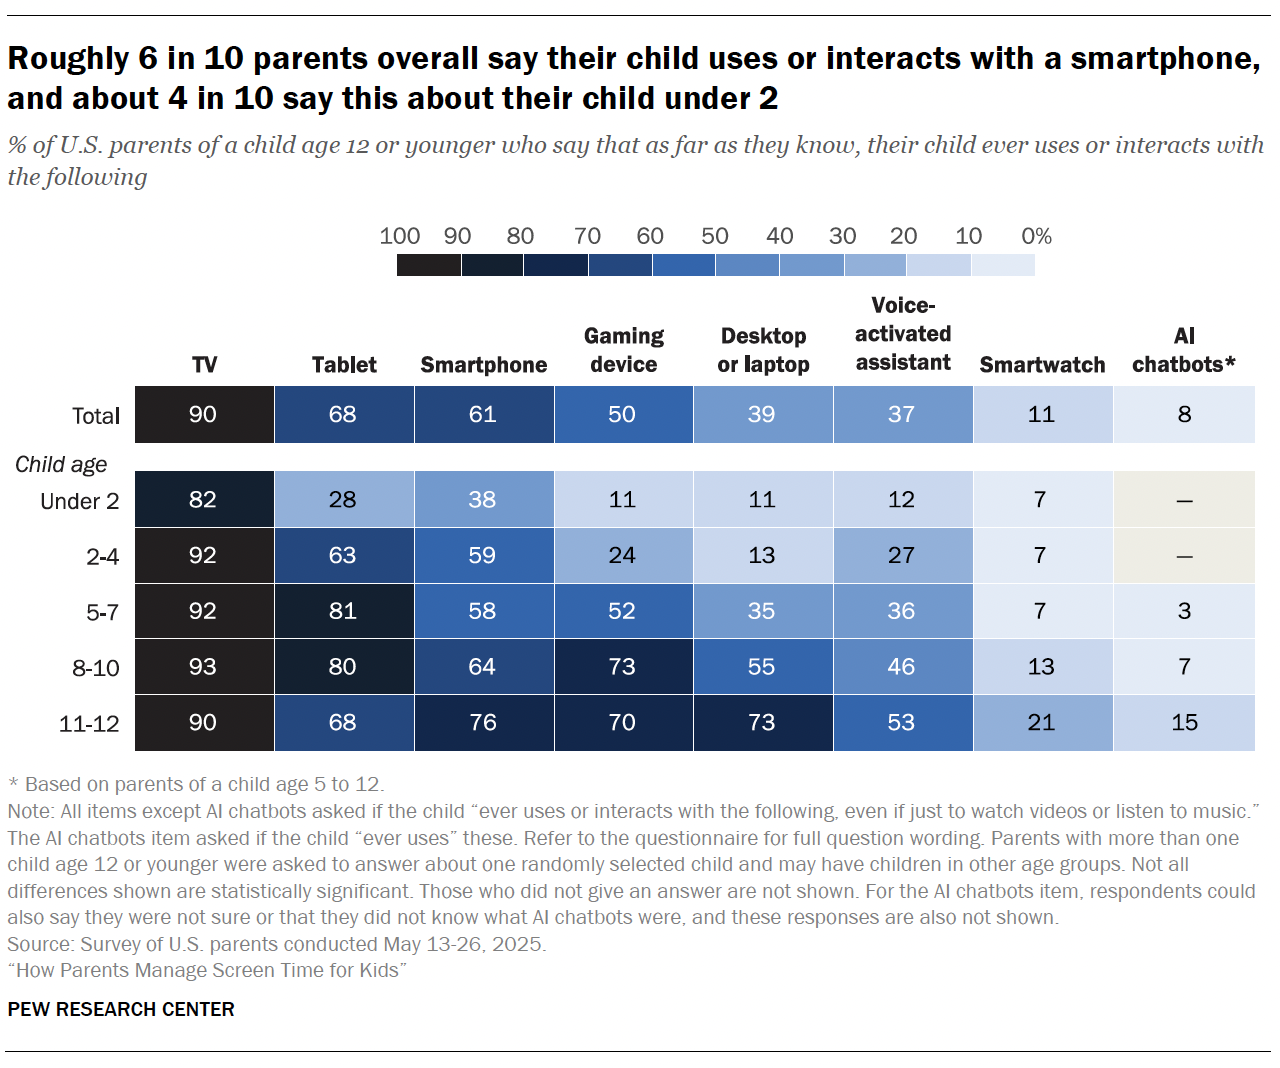
It’s not just older kids on screens: Vast majorities of parents say their kids ever watch TV – including 82% who say so about a child under 2.
A table showing Roughly 6 in 10 parents overall say their child uses or interacts with a smartphone, and about 4 in 10 say this about their child under 2

Smartphone use also starts young for some, but how common this is varies by age. About three-quarters of parents say their 11- or 12-year-old ever uses one. A slightly smaller share, roughly two-thirds, say their child age 8 to 10 does so. Majorities say so for kids ages 5 to 7 and ages 2 to 4.

And fewer – but still about four-in-ten – say their child under 2 ever uses or interacts with one.

It’s common for children to use smartphones. But at what age do they typically start owning their own devices?
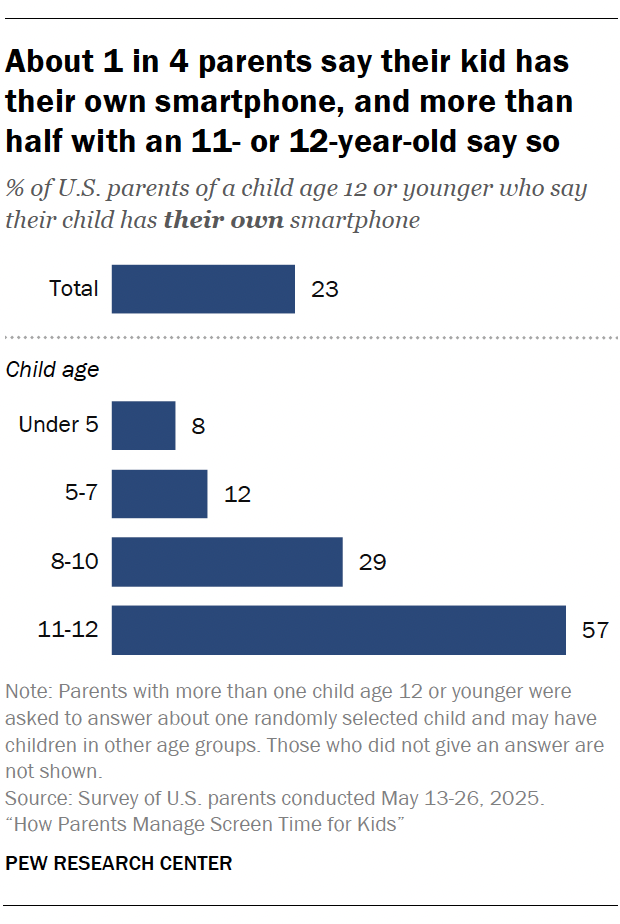
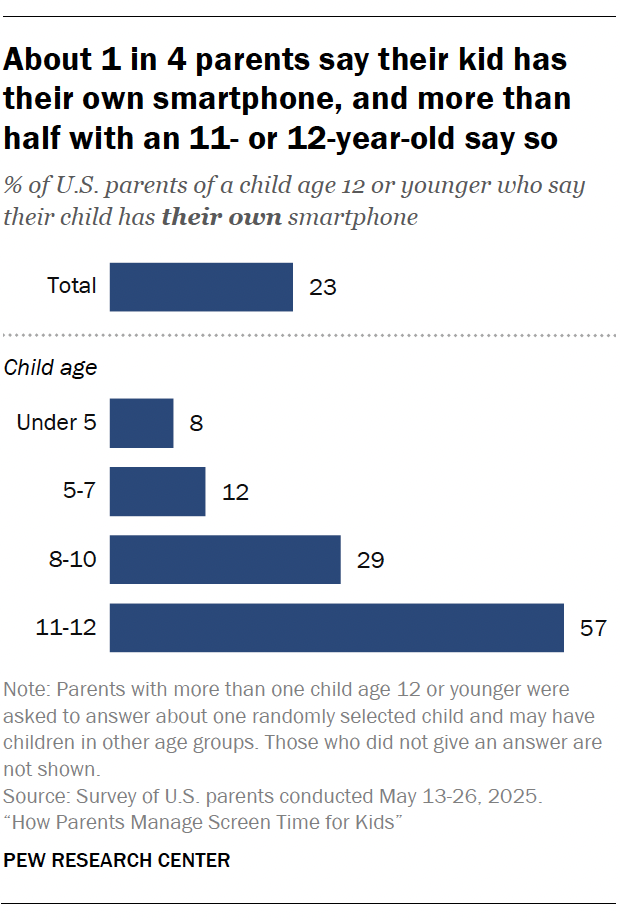
A bar chart showing About 1 in 4 parents say their child has their own smartphone, and more than half of those with an 11- or 12-year-old say so

In our survey, about one-in-four parents say their child has a smartphone of their own.

This depends heavily on the child’s age. Roughly six-in-ten parents of an 11- or 12-year-old say their child has their own smartphone, compared with 29% of parents of an 8- to 10-year-old and about one-in-ten who say so about a younger kid.

Kids’ smartphone ownership also varies by household income, with 31% of parents with lower incomes reporting that their child has their own smartphone. Smaller shares of those with middle (20%) and upper incomes (16%) say the same.1

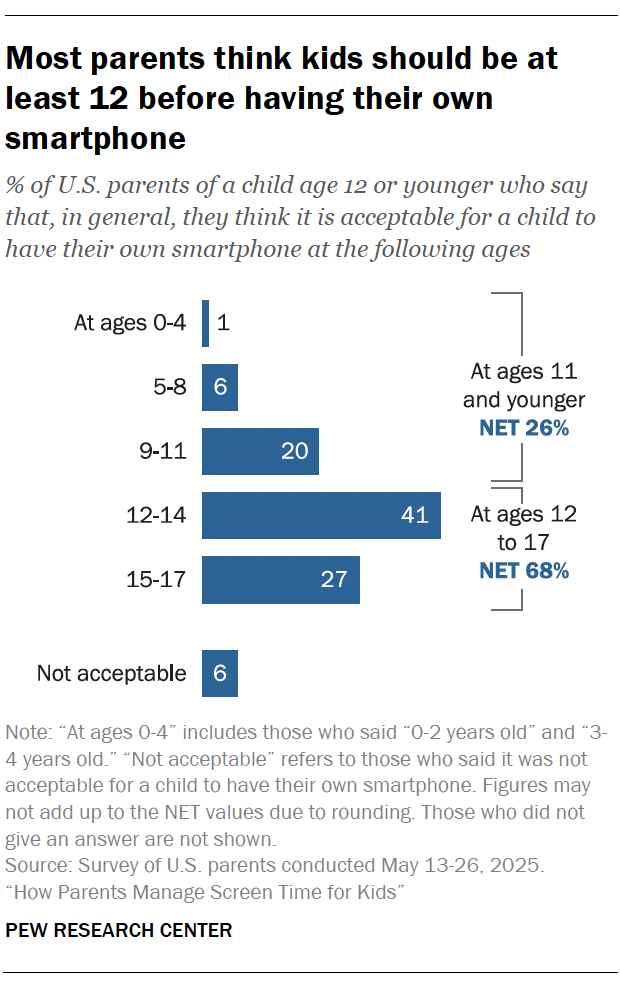
Regardless of whether a child has their own phone, we asked parents what they consider to be an appropriate age for kids in general to have one. Most parents (68%) think kids generally should be at least 12 before getting a smartphone of their own.

Even for the youngest kids, YouTube is widely used.

YouTube has played a major role in kids’ tech use over the years. It’s not without criticism; lawmakers and advocates have called out the advertising shown to kids and the quality of the content they see. Still, even as parents have voiced similar concerns in our past surveys, they have also noted its role in kids’ entertainment and learning.
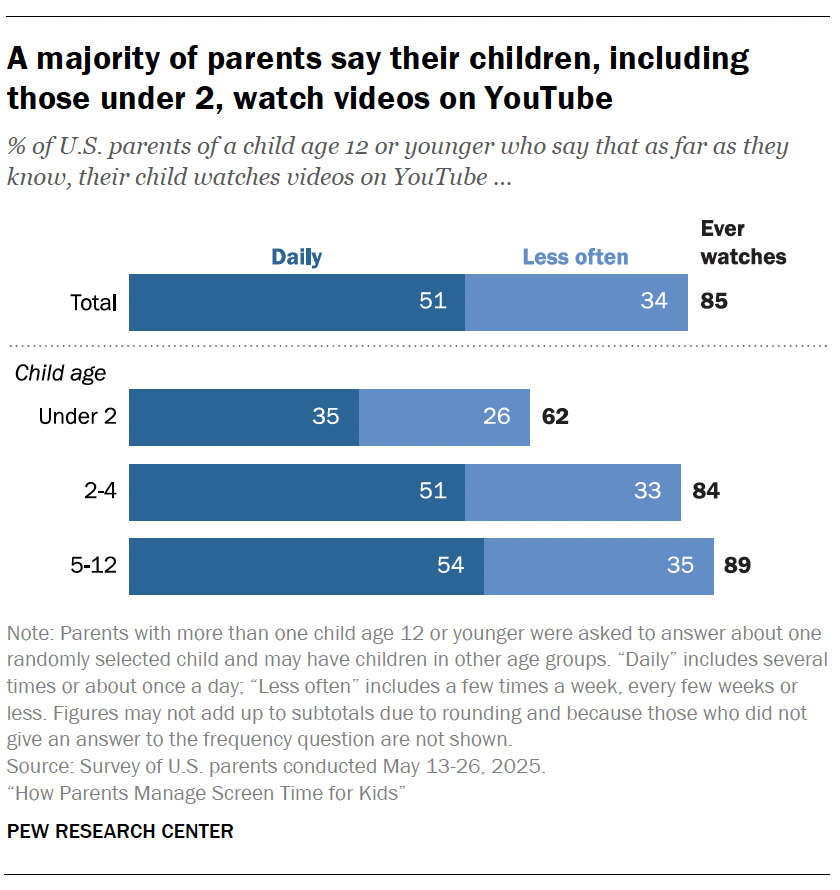
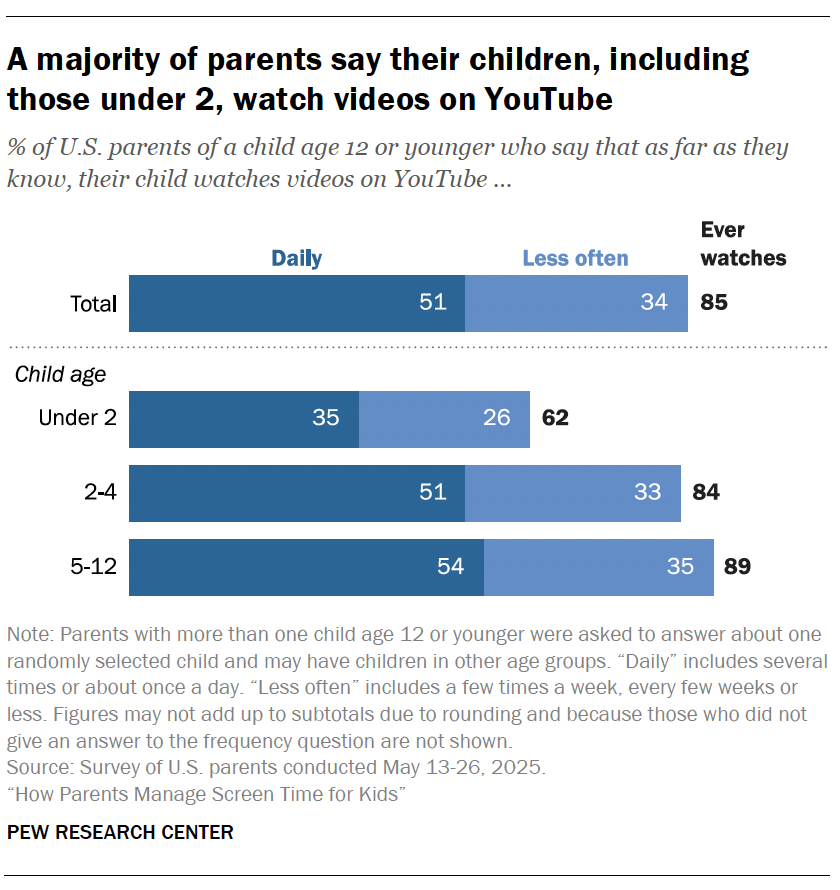
A bar chart showing A majority of parents say their children, including those under 2, watch videos on YouTube

Today, 85% of parents say their child ever watches YouTube; this includes about half who say this happens daily. And the platform is widely used by kids of all ages.

About six-in-ten parents report that their child under 2 watches YouTube. This rises to 84% for ages 2 to 4 and is slightly higher for ages 5 to 12.

YouTube use is ticking up overall – and has risen sharply for kids under 2.
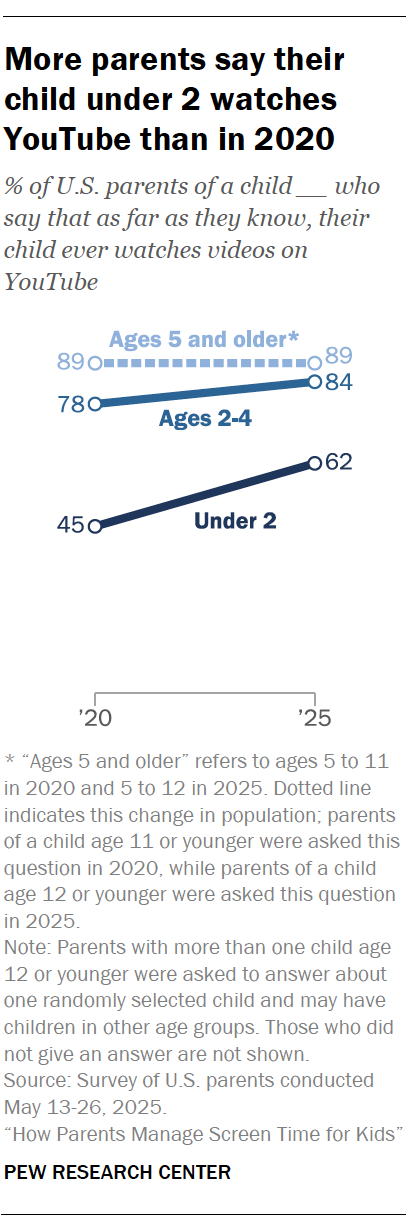
A line chart showing More parents say their child under 2 watches YouTube than in 2020

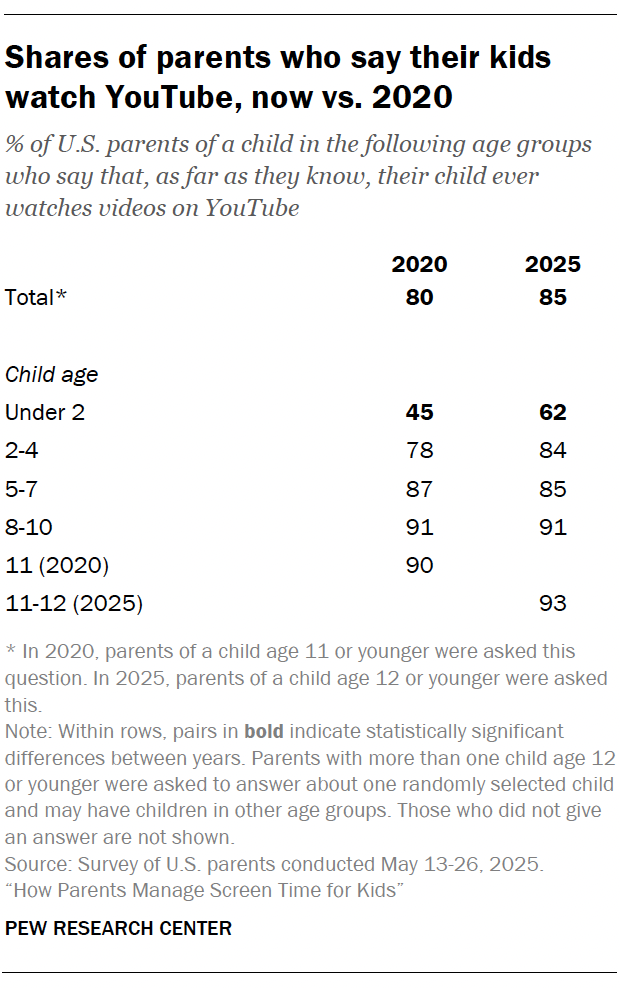
YouTube use overall has inched up from 2020, when 80% of parents said their child 11 or younger ever watched it, to 85% of parents who say their child 12 or younger ever does so today.2

That includes a jump from 45% to 62% among parents of a child under 2. The shares of parents who say their kid 2 and up ever watches YouTube are statistically unchanged.

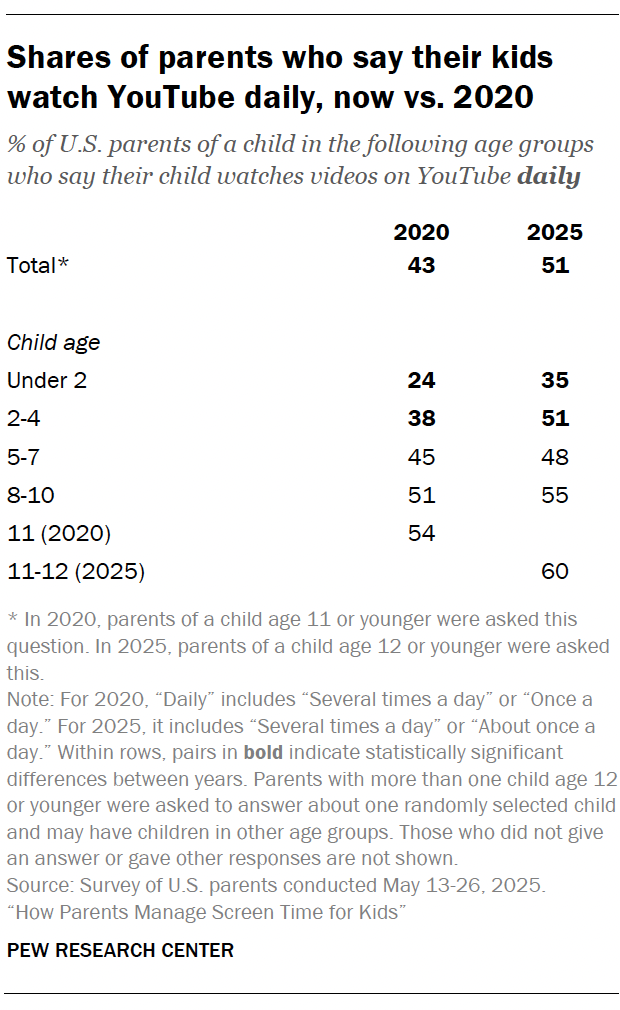
Daily use also rose from 43% in the 2020 survey to 51% today.3 This change is driven by more parents saying their younger kid watches YouTube daily. From 2020 to 2025, daily use rose from:

  • 24% to 35% according to parents of a child under 2
  • 38% to 51% for parents of kids ages 2 to 4

Some parents say their kids are on TikTok and other social media platforms.

Social media companies have been accused of being too lax with kids’ data, harming youth mental health and not doing enough to keep children from seeing inappropriate content.
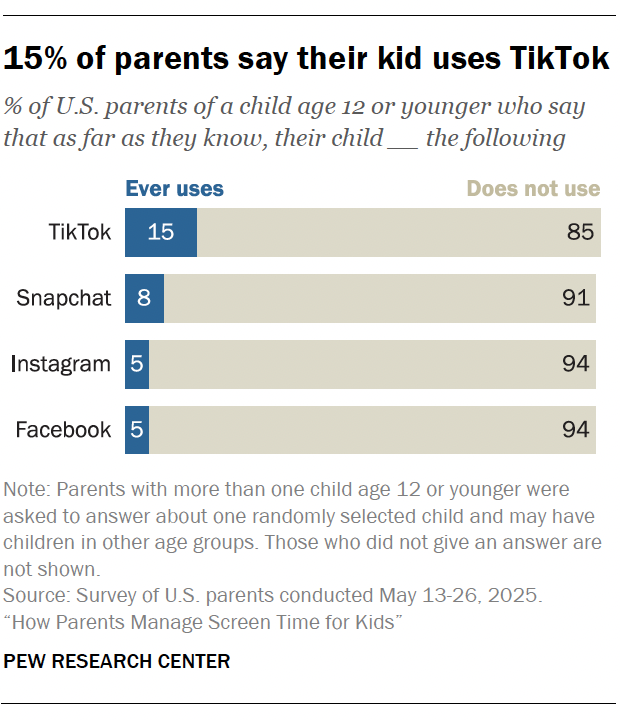
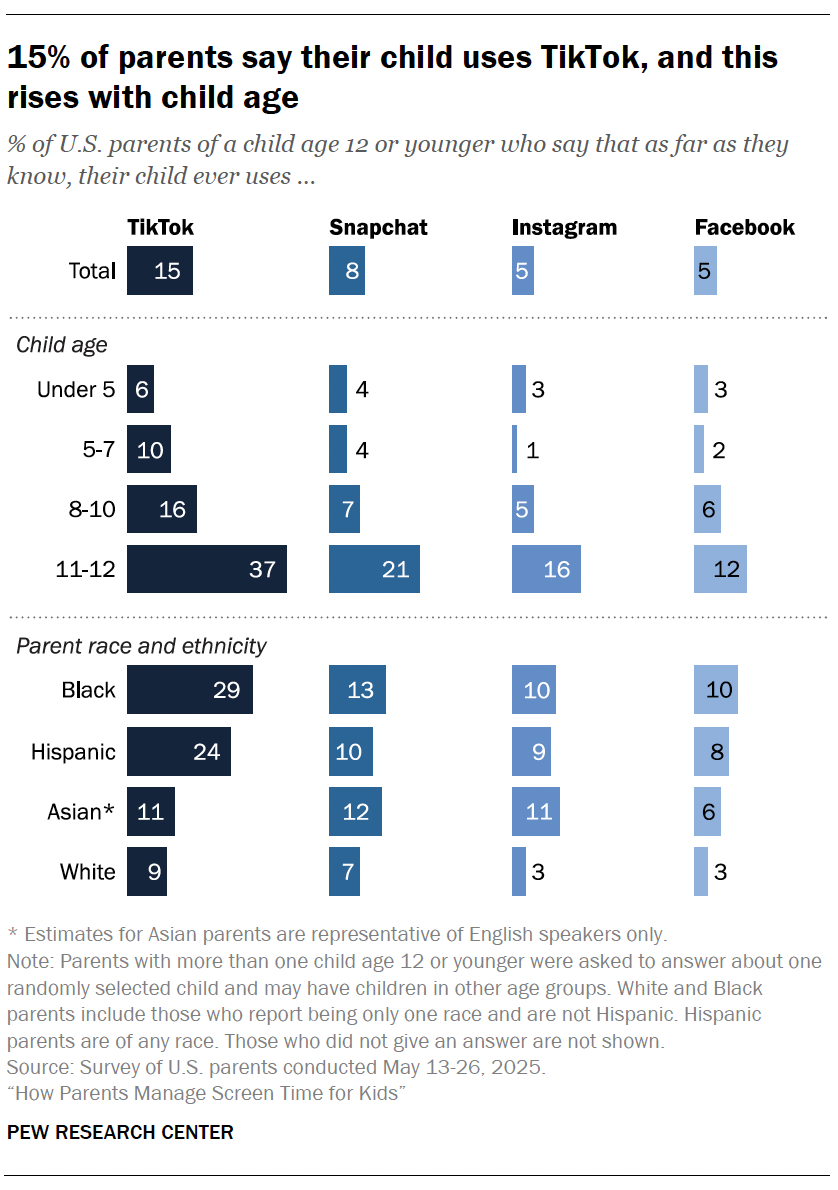
A bar chart showing 15% of parents say their kid uses TikTok

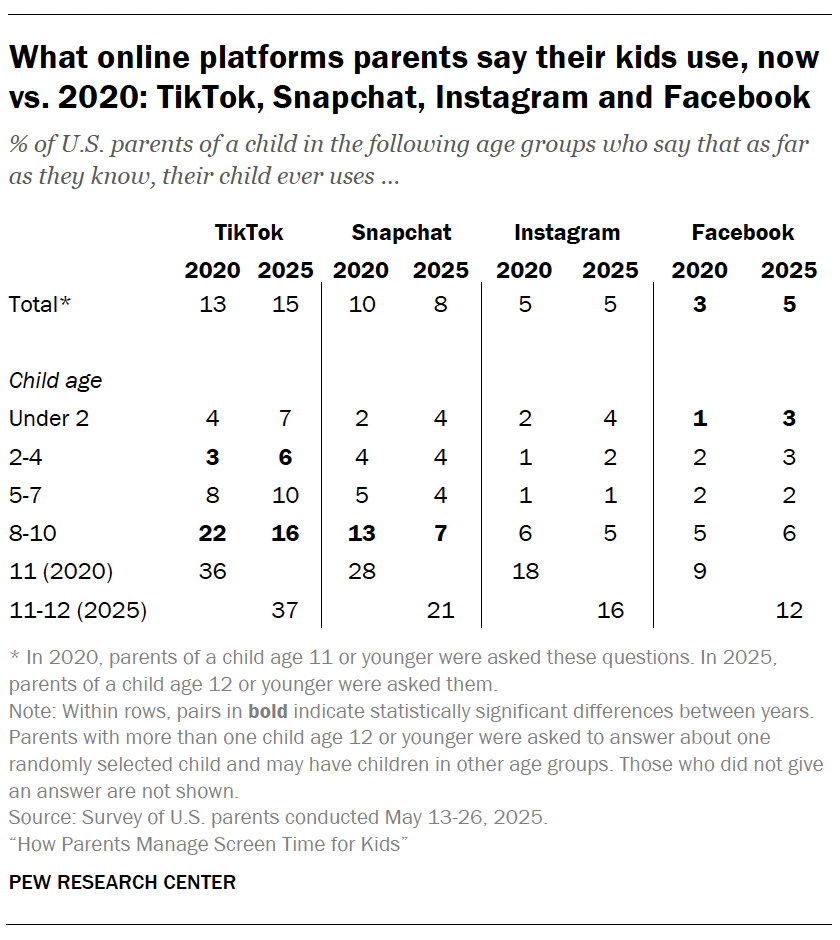
Though companies have put age restrictions in place, some kids are still on these platforms. As in 2020, TikTok stands out from the other platforms we asked about – with 15% of parents saying their child uses it, as far as they know.

Smaller shares report their child uses Snapchat (8%), Instagram or Facebook (5% each).

It’s most common for parents of the oldest kids to say their child uses these four platforms. For example, 37% of parents say their 11- to 12-year-old uses TikTok. By comparison:

  • 16% say their 8- to 10-year-old uses TikTok.
  • 10% say their 5- to 7-year-old does.
  • 6% say so about their child under 5.
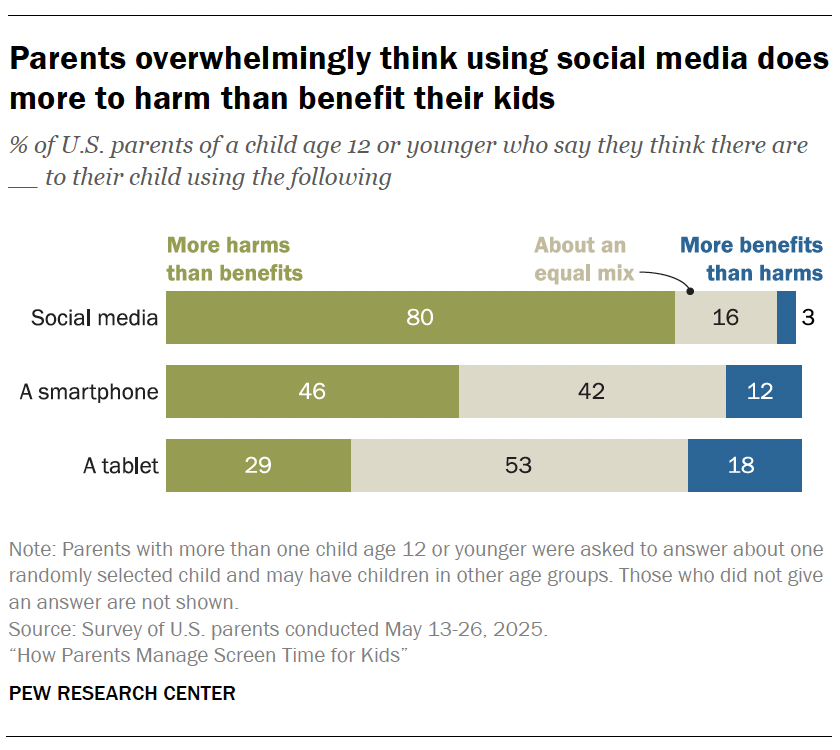
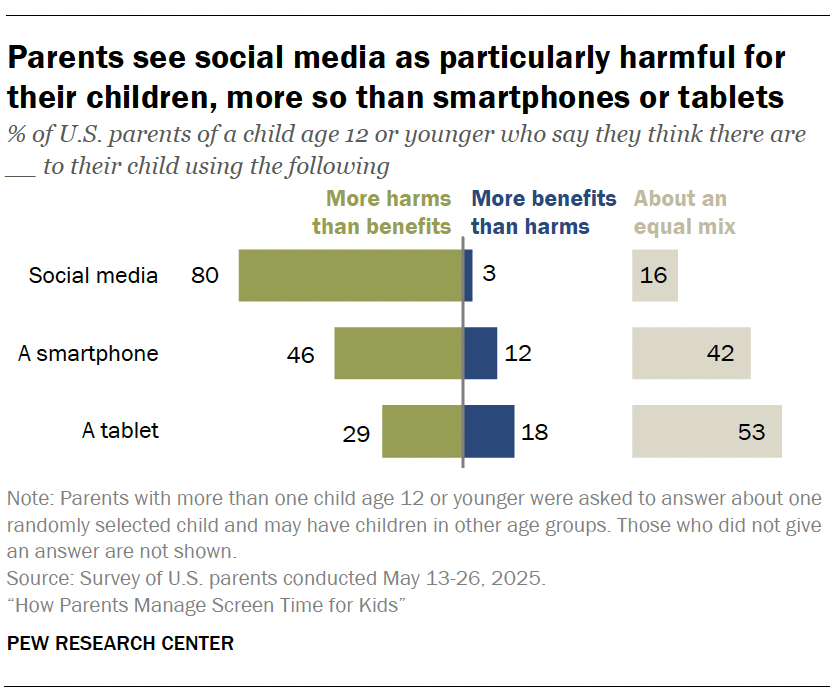
A bar chart showing Parents overwhelmingly think using social media does more to harm than benefit their kids

At the same time, parents view social media as uniquely harmful. Eight-in-ten say the harms of social media outweigh the benefits.

Fewer, though still nearly half, say smartphones are more harmful than beneficial to their children.

And a smaller share – about three-in-ten – say the same about tablets.

How parents navigate decisions about screens

Parents can face tough calls daily on screen time. When and why kids are allowed to use a smartphone can be among the most fraught.
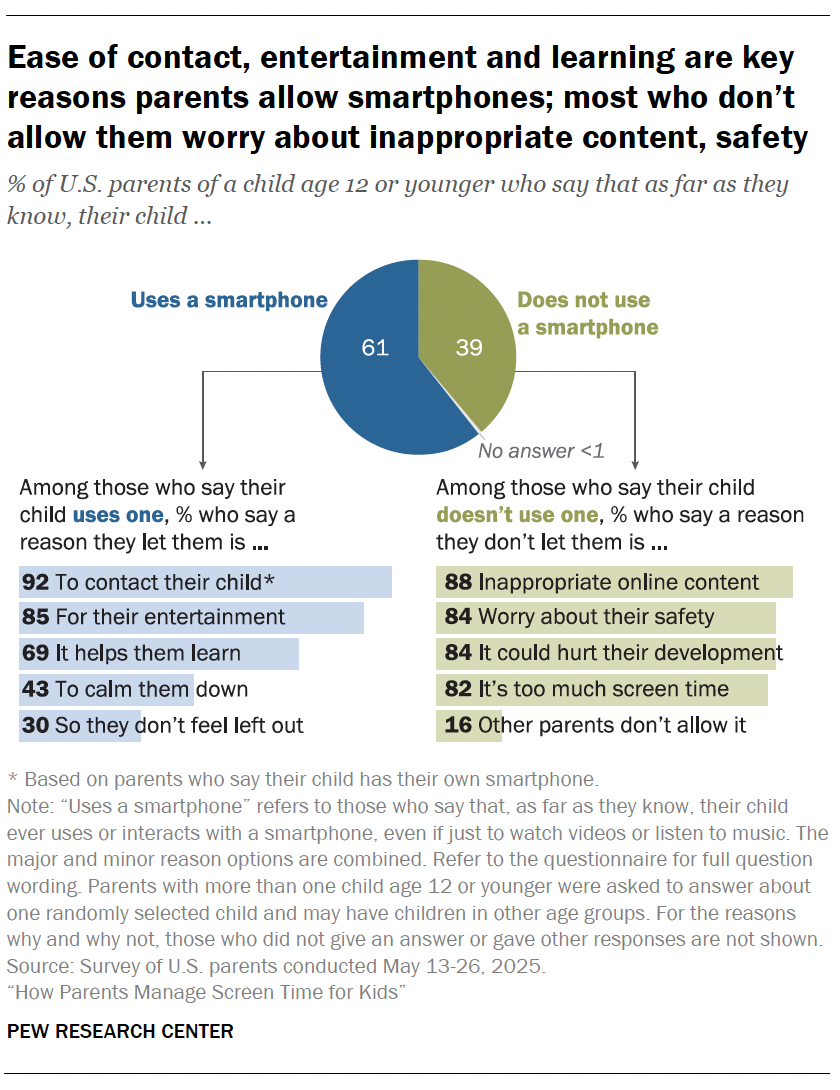
A pie chart showing Ease of contact, entertainment and learning are key reasons parents allow phones; most who don’t allow them worry about inappropriate content, safety

Ease of contact is a big reason for allowing kids to have their own smartphones. Nearly all parents whose child has their own smartphone say this is a major or minor reason they let them use one.

Most parents who let their kids use smartphones at all say entertainment and learning are reasons they do so. Smaller but notable shares of parents say they let kids use smartphones to calm them down or so that they don’t feel left out.

Among parents whose kids use smartphones, those whose child is under 5 are far more likely than those with older kids to say calming their child is a reason they allow smartphone use. And those with lower household incomes are more likely than those with middle or upper incomes to let their child use a smartphone to help them learn, to avoid them feeling left out or to calm them.

Most parents who don’t allow smartphones say inappropriate content is a reason why. Safety, developmental concerns and excessive screen time are also commonly cited.

In addition to surveying parents, we also conducted four separate focus groups in March to dive deeper into parents’ views and experiences on topics related to screen time. In the discussions, we asked them how they felt about their kids using – or not using – phones in general.

One parent highlighted safety as a reason their child has one, explaining:

“[My son’s] in kinder[garten], and he owns his phone already. It is for safety reasons only … so he takes it every day to school, brings it back, but he never uses it.”

Asked about giving kids phones in the future, another parent said:

“I think eventually we will give it to them, but now … she’s not ready. Even … we [parents] spend too much time on phones. … How can we expect a 9-year-old to control and have a balance between their screen time?”
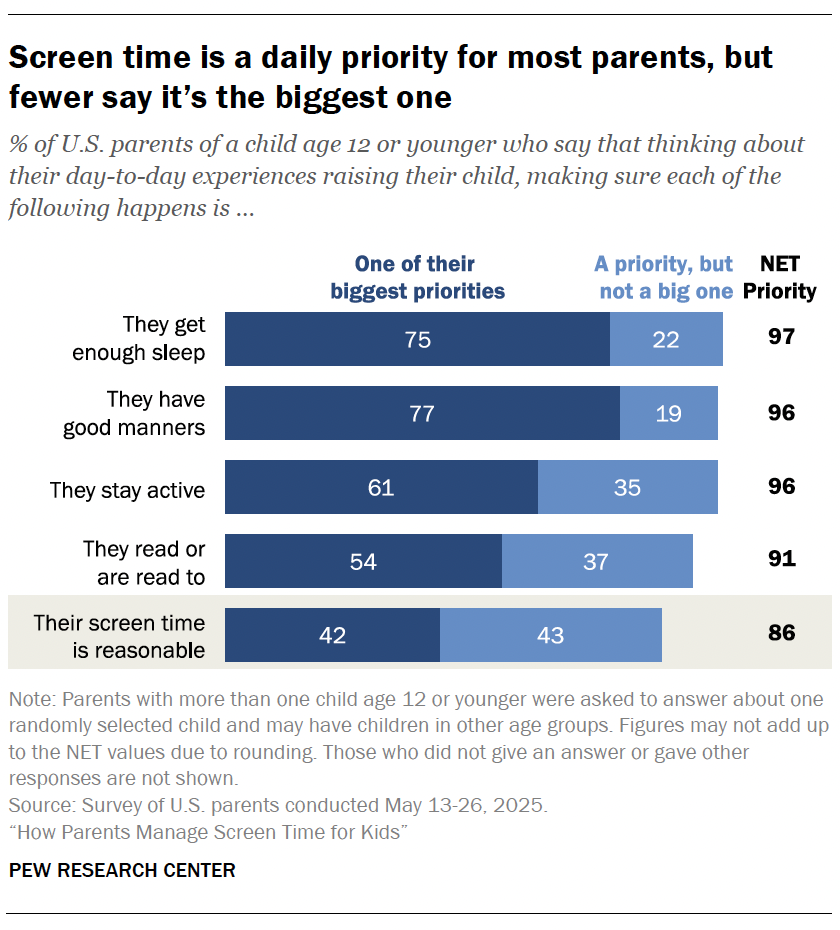
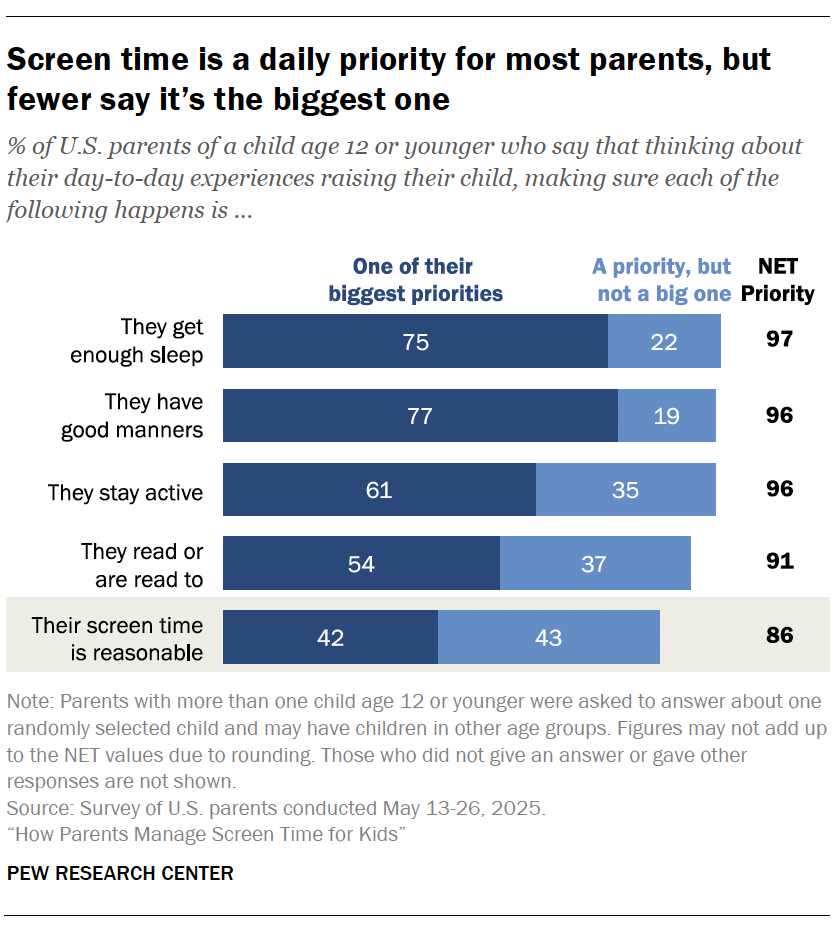
A bar chart showing Screen time is a daily priority for most parents, but fewer say it’s the biggest one

Most parents say managing their child’s screen time is a priority. Fewer than half say it’s one of their biggest ones.

Our survey findings show that they’re juggling other things: Larger shares say making sure their child has good manners, gets enough sleep, stays active, and reads or is read to are some of their biggest day-to-day priorities.

About nine-in-ten parents with upper (90%) and middle incomes (87%) say screen time is a priority overall, higher than the 82% with lower incomes who say so. But the shares who say it’s one of their biggest priorities are similar across these groups.

Some of the other key priorities parents cite vary by income, though. For example, 84% of parents with lower incomes say ensuring good manners is one of their key priorities, versus 74% of those with middle incomes and a slightly smaller share of those with upper incomes (69%).

About four-in-ten parents (39%) think they’re stricter about their child’s screen time than other parents they know.

By comparison, about a quarter each think they’re less strict than other parents (26%) or about as strict (28%).
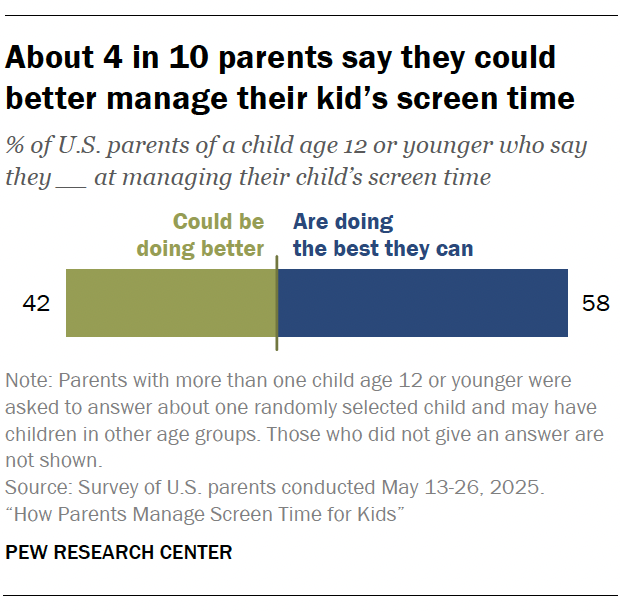
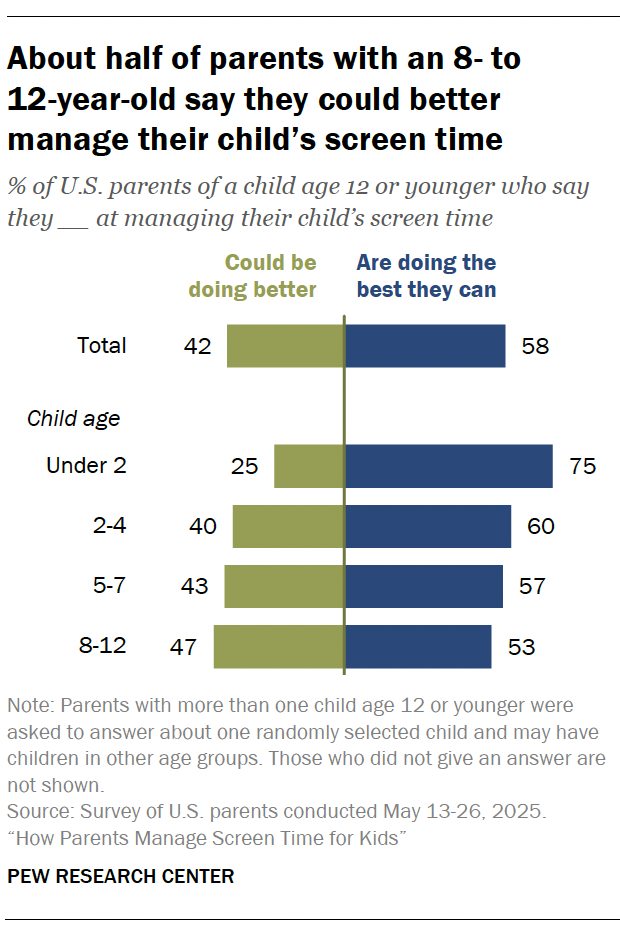
A bar chart showing About 4 in 10 parents say they could better manage their kid’s screen time

Many parents say they’re doing their best; some think they can do more.

About four-in-ten (42%) say they could be doing better at managing their kid’s screen time. A larger share – 58% – say they’re doing the best they can.

Moms and dads are similarly likely to say they’re doing their best (59% vs. 55%).4 Parents with lower household incomes, though, are more likely than their middle-income peers to say this (63% vs. 54%). (Those with upper incomes do not differ from either group, at 57%.)

In our March focus groups, we heard from parents about competing pressures that can weigh heavily on them. As one parent said:

“I also have three other children in the house, and I work full time. … To just keep some of my sanity, the first thing I do is turn the TV on. … Being the wintertime, it’s hard for them to go outside. … I want to work on the screen time for the summertime.”

And parents want tech companies and lawmakers to take more action to protect kids.

Two-thirds of parents (67%) say tech companies should do more to set rules around what kids can do or see online, according to our May survey. And a 55% majority say that lawmakers should do more.

Parental support for action on kids’ online lives crosses partisan lines. There are only slight differences in views for Republican and Democratic parents, including parents who lean toward each party.
1. How parents describe their kids’ tech use

Screen time has long been a hot topic for parents. Many think that parenting has gotten harder over the years, with technology being a key reason why. Between the rise of AI, the staying power of platforms like YouTube, and the ubiquity of screens, parents face a wide range of choices about kids’ tech use.

We asked parents what their child age 12 or younger uses and how they feel about it. We found:

  • Kids’ tech use comes in many forms: Tablets, smartphones and especially TV are common. Sizable shares of parents, even those with the youngest kids, say their child ever uses these.
  • AI is part of the mix for some kids: About one-in-ten parents with a child age 5 to 12 say their kid uses AI chatbots. 
  • YouTube is widely used: 85% of parents say their child watches YouTube, including 51% who say that’s daily use. More parents say their kids under 2 watch YouTube today than in 2020.

We also dive into reasons behind use, trade-offs of technology and the question of whether kids are spending too much time on screens below.

What kinds of tech kids are using

A bar chart showing Majorities of parents say their kids use tablets and smartphones; watching TV is especially common

Tablets, smartphones and especially TV stand out in kids’ tech diets:

  • Nearly all parents (90%) say their child ever watches television.
  • Majorities say their child uses or interacts with a tablet or smartphone.
  • Half say the same about gaming devices.
  • About four-in-ten each say this about desktops or laptops as well as voice assistants, like Siri or Alexa.

Fewer – 11% of parents – say their child uses a smartwatch.

And among parents with a child age 5 to 12, about one-in-ten say their child uses AI chatbots like ChatGPT or Gemini.

By child age

Parents of older kids are generally more likely to say their child uses devices like smartphones, tablets, gaming devices and desktop or laptop computers. Still, some parents of the youngest kids say their children use these too.

A table showing Roughly 6 in 10 parents overall say their child uses or interacts with a smartphone, and about 4 in 10 say this about their child under 2

While the vast majority of parents say their child watches TV regardless of age, there’s more variation for some devices, like tablets:

  • About three-in-ten parents say their child under 2 uses a tablet.
  • This share rises to a majority who say so about their 2- to 4-year-old.
  • Larger shares – about eight-in-ten each – say the same about kids ages 5 to 7 and 8 to 10.
  • And a slightly smaller share, but still roughly two-thirds, say so about their 11- to 12-year-old.

For smartphones and computers, parents of the oldest kids stand out: About three-quarters say their 11- to 12-year-old uses these devices. Gaming device use also largely rises with child age; about seven-in-ten parents of kids ages 8 to 12 report this.

And while 3% of parents say their 5- to 7-year-old uses AI chatbots, this ticks up to 7% of those with an 8- to 10-year-old and rises further to 15% of parents of an 11- or 12-year-old.

Changes over time

In our 2020 survey, we surveyed parents with a child age 11 or younger on these topics. Then, TV, smartphones and tablets also stood out from other devices that parents said their kids used overall. One place we see change? TV watching for the youngest kids.

Among all parents, this has changed little. About nine-in-ten parents of a child 11 or younger said their child watched TV in 2020, roughly on par with what parents of kids 12 and younger say now.5 But the share of parents who say their child under 2 ever watches TV has risen from 63% to 82%.

We also see a slight dip in desktop or laptop use from 2020, reflecting changes for parents of kids ages 2 to 10, and an uptick in use of gaming devices overall.

Go to the appendix for a full breakdown of device use by age over time.

Do kids have their own smartphones?

A bar chart showing About 1 in 4 parents say their child has their own phone, and more than half of those with an 11- or 12-year-old say so

About a quarter of parents with a child age 12 or younger say that their child has their own smartphone (23%).

By child age

Parents of older children are far more likely to say their child has their own smartphone.

About one-in-ten parents (8%) say this about their child under 5, and that ticks up to 12% who say their 5- to 7-year-old has their own smartphone.

A larger share – about three-in-ten – say this about their child age 8 to 10. And that roughly doubles to about six-in-ten who say their child age 11 or 12 has their own smartphone.

By parent race and ethnicity

Black (33%) and Hispanic (30%) parents are more likely than White (20%) and Asian parents (19%) to say their kid has their own smartphone.6

By household income

Parents with lower incomes are most likely to say their child has their own smartphone, at 31%. Smaller shares of those with middle (20%) and upper (16%) incomes say the same.7

When should kids have their own smartphones?

A bar chart showing Most parents think kids should be at least 12 before having their own phone

Asked about kids in general, most parents (68%) say children should be at least 12 before having a smartphone of their own.

A smaller share (26%) considers it suitable for kids under 12, while 6% say it’s not acceptable for a child to have their own smartphone.

By parent race and ethnicity

Black parents are most likely to say it’s acceptable before age 12 (44%), followed by Hispanic parents (28%) and then White (22%) and Asian parents (17%).

By household income

Parents in lower-income households are most likely to say owning a smartphone is generally acceptable before age 12 (36%). About one-in-five with middle (21%) or upper incomes (18%) say the same.

Online platforms kids use

YouTube

A bar chart showing A majority of parents say their children, including those under 2, watch videos on YouTube

YouTube is a common source of kids’ screen time. Most parents (85%) say their child 12 or younger watches videos on it. And that includes about half who say this happens daily.

By child age

A 62% majority say their child under 2 watches YouTube. This rises to 84% of those with a child age 2 to 4, and to about nine-in-ten of those answering about an older child.

These figures include 35% of parents with a kid under 2 who say that child watches daily. Larger shares say their kid age 2 to 4 (51%) or age 5 to 12 (54%) watches daily.

By household income

Those with lower incomes (55%) and middle incomes (51%) are more likely than those with upper incomes (40%) to say their child watches YouTube daily.

Changes over time

Parents are more likely now than in the past to say their child watches YouTube – and watches it daily.

Overall use ticked up from 80% in 2020, among parents with a child 11 or younger, to 85% of parents with a child 12 or younger today. And daily watching rose from 43% to 51%.8

This largely reflects changes in young kids’ watching habits. In 2020, 45% said their child under 2 ever watched YouTube. Today, that is 62%.

And 35% say their child under 2 watches daily, up from 24%. Daily watching is also up according to parents of children ages 2 to 4 – from 38% to 51% – but stable for other groups.

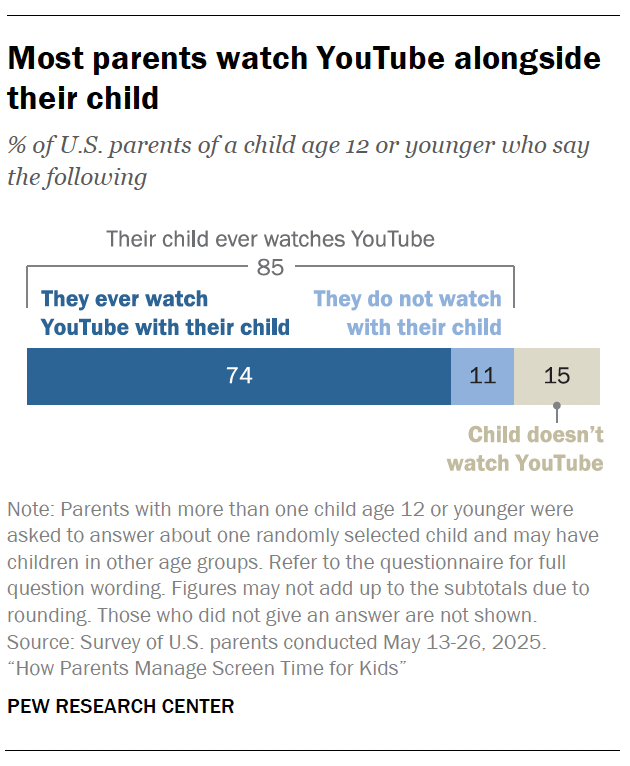
Are parents watching YouTube with their kids?

A bar chart showing Most parents watch YouTube alongside their child

Watching YouTube can be a family affair. In fact, the vast majority of parents say they watch it with their kids who are 12 and under.

About three-quarters of all parents (74%) say they ever watch YouTube together with their child.

By child age

This is a common practice regardless of how old kids are. Looking just at those parents whose kids watch YouTube at all:

  • Among parents whose child under 2 watches YouTube, nearly all (95%) say they ever watch it with them.
  • Among parents whose 2- to 4-year-old watches, about nine-in-ten parents (93%) say they watch with their child.
  • And even among those whose 5- to 12-year-old watches, most parents (84%) say the same.

Social media

A bar chart showing 15% of parents say their child uses TikTok, and this rises with child age

Some 15% of parents say their child uses TikTok. Fewer say their child uses Snapchat (8%), Instagram (5%) or Facebook (5%).

By child age

Parents of the oldest children more commonly say their kids use these platforms.

For example, 37% of parents say their 11- to 12-year-old uses TikTok. That share falls to 16% among parents of a child age 8 to 10, and even further to one-in-ten or fewer among those with a child under 8.

By parent race and ethnicity

Black and Hispanic parents are more likely than White parents to say their child uses some of these platforms.

For example, 29% of Black parents and 24% of Hispanic parents say their child uses TikTok, while about one-in-ten Asian (11%) or White parents (9%) say the same.

Asian parents sometimes stand out from White parents as well. Looking at Instagram, about one-in-ten Asian, Black or Hispanic parents say their child uses the platform, while 3% of White parents say so.

These patterns are similar to those we’ve seen in our work on teens and social media.

Changes over time

Overall, these findings are largely on par with five years ago: Parents with a child 12 or younger are about as likely to say their child uses these platforms, as parents of kids 11 and younger were in 2020. Still, parents’ reports for some older age groups have seen slight declines since then.

Go to the appendix for a full breakdown.

Why parents do – and don’t – let kids use smartphones

Parents’ reasons for letting kids use smartphones

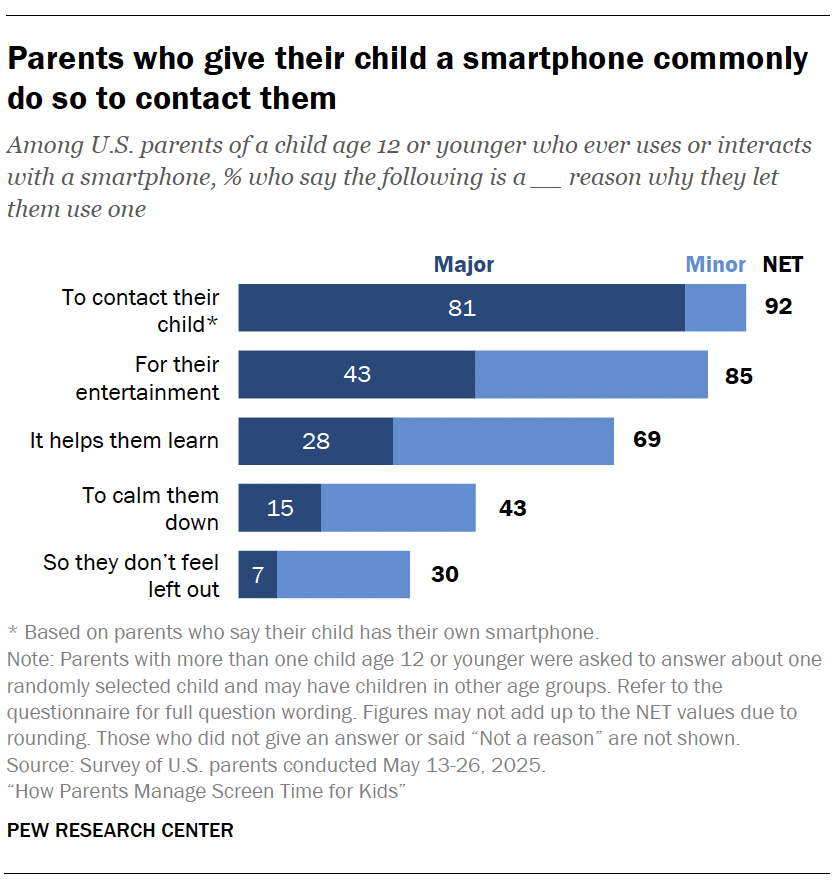
A bar chart showing Parents who give their child a phone commonly do so to contact them

For parents whose child has their own smartphone, a common reason they allow one is to stay in contact. This includes 81% who say this is a major reason they let them use one.

And most parents whose kids use a smartphone at all cite their child’s entertainment as a reason. But a majority of parents also say they allow it because it helps their child learn.

Fewer let their child use smartphones because it calms them down or to prevent them from feeling left out.

By child age

Some reasons vary further by age. For example, 65% of those whose child under 5 uses a smartphone say it’s to calm them down, compared with 34% of parents whose child age 5 to 12 uses one.

By household income

Still among parents with a smartphone-using kid, 74% of those with lower household incomes say they let their child use a smartphone for learning, versus about two-thirds with middle incomes (65%) and 63% with upper incomes.

Those with lower incomes are also more likely to let their child use a smartphone so they don’t feel left out. About four-in-ten (37%) say so, versus about a quarter with middle (27%) or upper incomes (23%).

And 51% with lower incomes say they allow smartphones to calm their kid down, versus smaller shares of their middle- (39%) or upper-income peers (35%).

Parents’ reasons against letting kids use smartphones

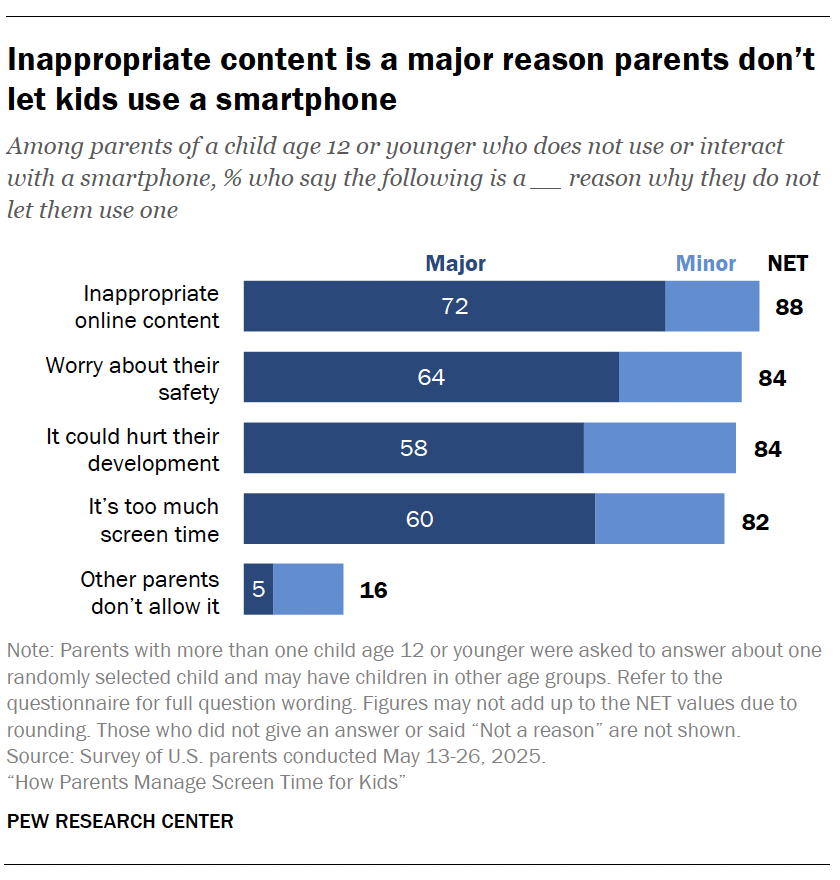
A bar chart showing Inappropriate content is a major reason parents don’t let kids use a smartphone

We also asked parents who do not let their child use a smartphone about five reasons why not.

Among these parents, about nine-in-ten say they don’t let their child use a smartphone because their child might see inappropriate things online. This includes 72% who say this is a major reason not to let their child use it, higher than other reasons we asked. 

Still, vast majorities of these parents also cite that they are worried about their child’s safety, that it could hurt their development, and that it’s too much screen time.

Far fewer – 16% – point to other parents not allowing it as a reason.

Weighing the harms and benefits of technology

A bar chart showing Parents see social media as particularly harmful for their children, more so than smartphones or tablets

Eight-in-ten parents say the harms of their child using social media outweigh the benefits. Only 3% of parents say the benefits outweigh the harms, while 16% feel there is an equal mix.

They still are more likely to say smartphones’ harms outweigh benefits than the reverse (46% vs. 12%). But 42% say harms and benefits even out.

When it comes to tablets, parents are most likely to say that there’s an equal mix of harms and benefits for their child (53%). Still, more say the harms outweigh benefits (29%) than the reverse (18%).

These trade-offs can be tricky for parents, as we heard in the separate focus groups we conducted in March.

As one parent explained when asked about social media, “You see the psychological effects it can have on kids. … That part is worrying, you know? But … I feel like it’d be hypocritical of me having social media but then my kids can’t. … You just never know what type of influence [social media] will have on them. … You just hope they’re strong enough.”

Another saw educational benefits to phones: “[My daughter] learned to read through one of her apps that I let her download because she has ADHD, and her learning is just different.” Still, that same parent said one worry is “when they’re so zoned in.”

And even educational uses have trade-offs, as another participant described: “I have a 3-year-old, and we don’t let her use a phone or tablet or anything. … I recently let her use my laptop and got … a week’s subscription to an educational platform. It got me thinking there probably are opportunities to use technology as an educational tool … but I’m so scared about the consequences … that I’m probably hesitant to use it at all.”

Are kids spending too much time on screens?

Some parents’ concerns around screen time are not “if” but “how much?”

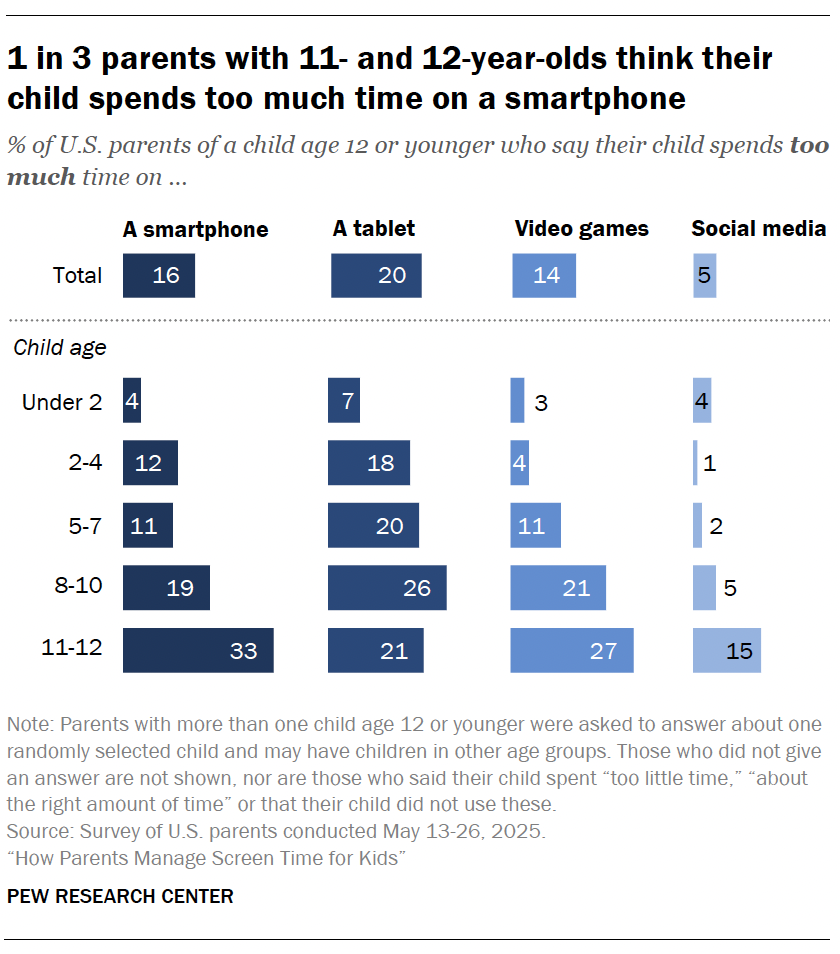
In the survey, we asked parents about four ways their kids might use screens. For most of them, parents were slightly more likely to say their child spent “too much time” on them compared with “too little time.” For example, 16% of parents say their child spends too much time on a smartphone. Fewer (7%) say their child spends too little time. But larger shares say it’s about the right amount of time (37%) or that their child does not use a smartphone (39%).

Parents’ views on their child’s time using tablets or playing video games follow a similar pattern to smartphones. One-in-five say their child’s tablet time is too much, and 14% say the same of video games. Larger shares say it’s about the right amount.

However, for social media, fairly similar shares of parents say the time their child spends on these sites is too much (5%) or too little (7%). Still, 17% say it’s about right, and many say their child doesn’t use social media.

By child age
A bar chart showing 1 in 3 parents with 11- and 12-year-olds think their child spends too much time on a smartphone

Parents with an 11- or 12-year-old are most likely to say that their child spends too much time on a smartphone or using social media.

A third of parents say their 11- to 12-year-old spends too much time on a smartphone, versus smaller shares of parents of younger children.

Parents of an older child are also more likely to say their kid spends too much time on video games and tablets. Those with 11- to 12-year-olds don’t specifically stand out, though.

Still, 22% say their 5- to 12-year-old spends too much time on a tablet, versus 14% of parents with a child under 5 who say this. There’s a similar pattern for video games (19% vs. 4%).

Parents’ feelings about the amount of screen time kids have

“How much is too much” can prompt complicated feelings for parents today, and in the focus groups we conducted, we heard a few of these considerations.

Asked how they felt about the amount of screen time their kids have, one parent said, “I think an hour is good, or a couple hours throughout the week. … So she’ll come home … maybe [around] 5 to 6 o’clock. She’ll have that liberty to have whatever electronics, watch TV. But … her phone or tablet, they turn that in at 7.”

Another didn’t feel like they had much control, explaining, “I feel like my kids should not be on the internet or anything unless they absolutely have to. But nowadays, I have no choice … she’s in middle school now, and every assignment is online, right?”

And for another, any amount of screen time prompted complicated feelings: “I feel guilty because even if it’s 20, 15 minutes that he’s on his tablet, that’s time we could spend together.”

2. How parents approach their kids’ screen time

In an era of hyperconnectivity, screen time has become a defining feature – and struggle – of family life. Parents have to consider not only their own habits but the digital boundaries they set for their children. This chapter explores how screen time fits into the broader landscape of parenting kids ages 12 and younger.

Among the key findings from this chapter:

  • Parents are juggling a lot: Managing screen time is a priority for most, but fewer say it’s the biggest priority.
  • Some parents think they could handle screen time better: 42% of parents think they could do a better job managing their child’s screen time. While a quarter say so about a child under 2, that rises to 47% of those with an 8- to 12-year-old.
  • Most parents have rules around screens: 86% of parents say so, but fewer say they stick to their rules all the time (19%).

Screen time management

From bedtime routines to screen time limits, parents juggle it all. Public health officials have raised alarms about the mounting pressures parents face. The U.S. Surgeon General’s 2024 advisory called attention to these stressors and their impact.

To better understand where screen time ranks among parents’ other duties, we asked parents about five priorities when it comes to raising their child.

A bar chart showing Screen time is a daily priority for most parents, but fewer say it’s the biggest one

The vast majority of parents (86%) say making sure their child’s screen time is reasonable is a day-to-day priority. This includes 42% who say it’s one of their biggest priorities.

But greater shares of parents point to other priorities. For example:

  • 77% say making sure their child has good manners is one of their biggest priorities.
  • 75% say the same about their child getting enough sleep.
  • 61% say a main objective is keeping their child active.
  • 54% say this about them reading or being read to.

Managing kids’ screen time

A bar chart showing About half of parents with an 8- to 
12-year-old say they could better manage their child’s screen time

How do parents think they’re doing when it comes to managing their child’s screen time?

A majority of parents say they are doing the best they can. However, roughly four-in-ten think they could be doing better.

By child age

Parents are more likely to see ways they could improve if they have a child 2 and up, versus under 2. While a quarter say they could be doing better for their child under 2, this rises to four-in-ten of those with a child age 2 to 4 and is similar – 43% – for parents with a child age 5 to 7.

Roughly half (47%) say they could be doing better at managing their 8- to 12-year-old’s screen time.

Parents feeling judged on kids’ screen time

Parenting in the digital age comes with its own set of critics, and some feel the weight of judgment when it comes to decisions about their kid’s use of screens.

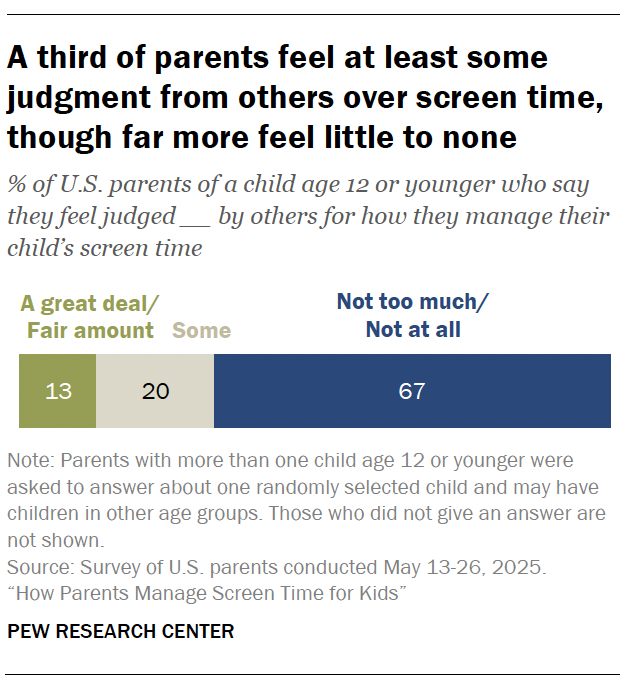
A bar chart showing A third of parents feel at least some judgment from others over screen time, though far more feel little to none

A third of parents feel at least some judgment from others for how they manage their child’s screen time. This includes 13% who say they feel a great deal or fair amount.

Still, most parents say they experience not too much or no judgment around this.

In the focus groups we conducted in March, we also asked parents whether they ever felt judged in this respect.

One parent explained, “I don’t feel judged in any decision that I make as a parent because, at the end of the day, my husband and I are going to always make the best decision for our household.”

On the other hand, another said that “there’s definitely pressure and judgment from other parents, which I know usually just comes from a place of insecurity about our own stuff. … With my sister, we have very different rules in our houses, and it brings up uncomfortable conversations sometimes.”

By parent race and ethnicity

While our May survey shows most parents report feeling little to no judgment from others, there are some racial and ethnic differences in the survey findings.

Asian and Hispanic parents are more likely than Black and White parents to say they feel at least some judgment for how they manage screen time. While 48% of Asian parents and 41% of Hispanic parents say this, smaller shares of those who are Black (30%) or White (29%) do.9

By household income

Experiences also vary by income. Parents living in households with lower annual incomes are more likely to say they feel at least some judgment (40%) than those in middle- or upper-income households (30% each).10

By parent gender

Moms and dads cite different rates of judgement.11 A larger share of moms than dads say they feel at least some judgement for how they handle their child’s screen time (38% vs. 27%).

Rules around screen time

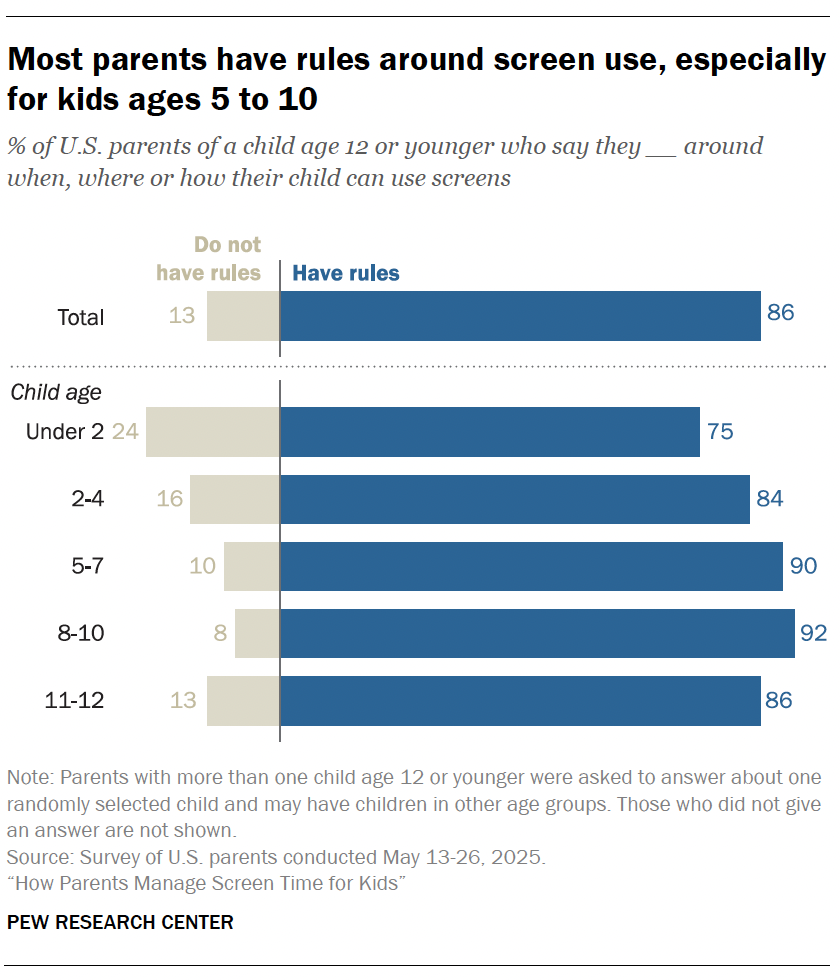
A bar chart showing Most parents have rules around screen use, especially for kids ages 5 to 10

The vast majority of parents (86%) have rules around when, where or how their child can use screens, according to our survey.

About one-in-ten say they have no rules around screen use.

By child age

Although majorities of parents have rules around screens, some differences exist by child age. Roughly nine-in-ten parents of a child age 5 to 7 or 8 to 10 say they have rules in place around screens. This drops slightly for those with kids 2 to 4 or 11 to 12. Parents are least likely to say they have rules for kids under 2, but still, 75% of parents with a child this age say so.

Sticking to their rules

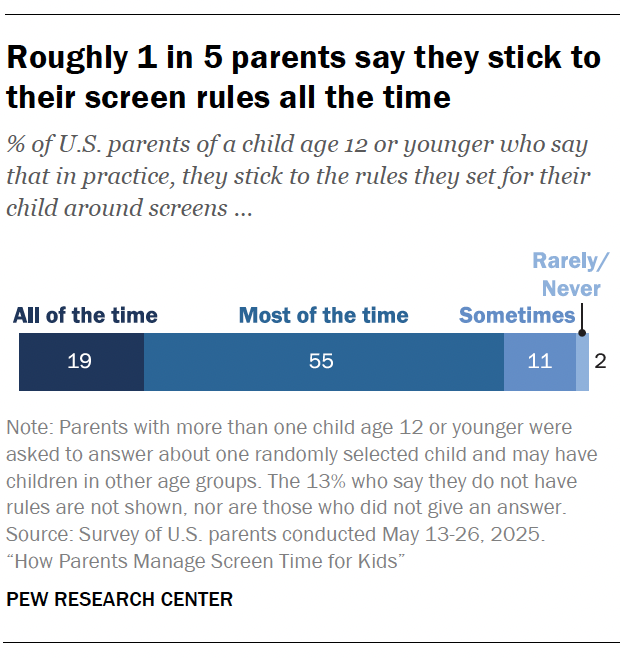
A bar chart showing Roughly 1 in 5 parents say they stick to their screen rules all the time

In practice, fewer parents are able to stick to their rules around screens all the time. In fact, roughly one-in-five parents say this. The largest share – 55% – say they stick to their screen rules most of the time.

Another 11% say they sometimes do, and 2% rarely or never stick to these rules.

In the focus groups we conducted, one parent described how hard it is to stick to some of the rules they set, saying, “We cut off all screens an hour before bedtime. … No screens on schooldays. Nothing immediately in the morning … We try to do nothing at the table, but we fail on that quite frequently, to be honest, like during mealtimes.”

Others noted how rules can be a struggle in general, with one parent saying, “I just feel like, when you restrict a kid from something, they want it more.”

How do parents think their parenting compares with others?

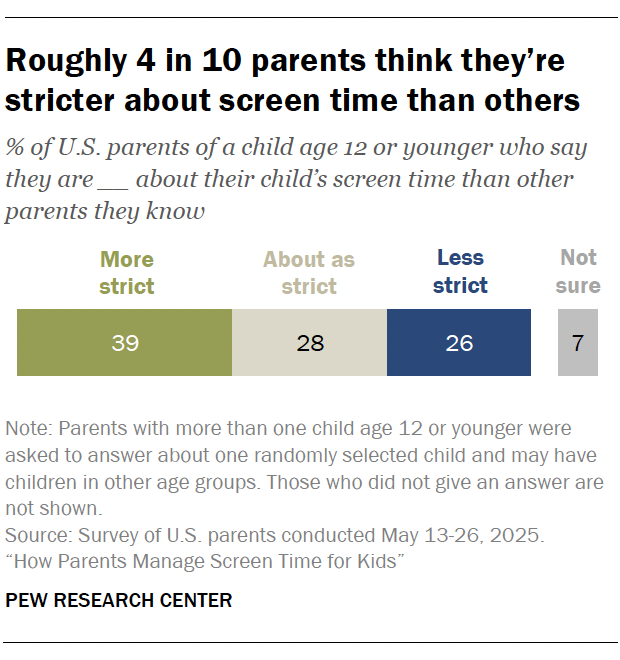
A bar chart showing Roughly 4 in 10 parents think they’re stricter about screen time than others

In our survey, parents lean toward seeing themselves as stricter on screen time than others.

  • 39% say they are more strict about screen time than other parents they know.
  • 26% say they are less strict.
  • 28% think they’re about as strict.

What parents think about their own screen time

The struggle with screen time isn’t just limited to kids; families are navigating this issue together. Experts are sounding the alarm about how parents’ own tech use may impact kids. But parents pulled in many directions can’t always avoid their own devices.

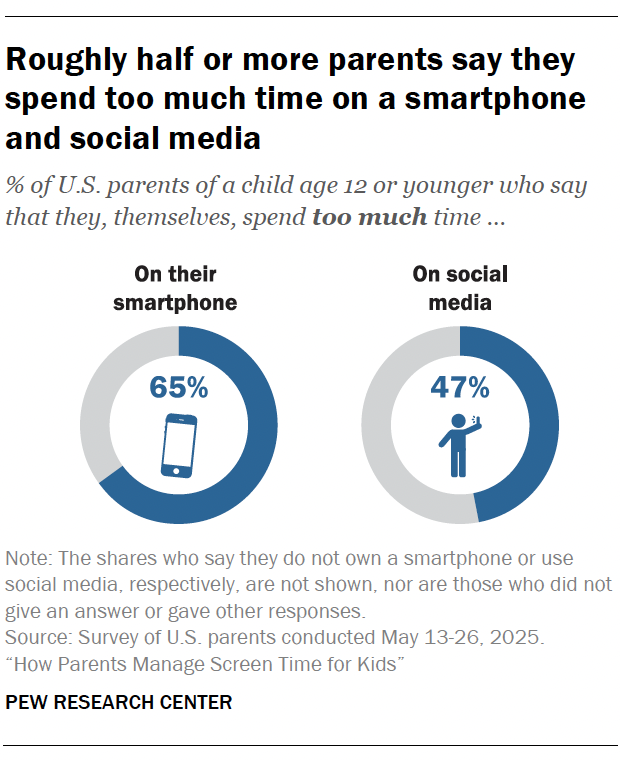
A chart showing Roughly half or more parents say they spend too much time on a smartphone and social media

In our survey, about two-thirds of parents say they spend too much time on their smartphone (65%). And roughly half say this about their time on social media (47%).

Much smaller shares say that they spend too little time on their smartphone (5%) or social media (8%).

Still, some parents feel comfortable about their time spent on these. Roughly a third say they spend about the right amount of time on social media (36%). About three-in-ten say the same about their smartphone (28%).

The struggles of navigating screen time as a family were also a topic of discussion in our focus groups. Some parents talked about trying to set an example and how their own habits shaped their household.

As one focus group participant explained, “I also have been pretty bad at monitoring myself because I always have my cellphone in hand. Even when I’m sitting with my kids, watching over their homework … so lately, I have turned my phone in airplane mode, to make sure I don’t hear any sounds, notifications coming out.”

Another said, “When it’s time for dinner, I try to put my phone away. And it’s a bad habit that my daughter and my son, they like to have their devices out. But I try to tell them when we’re eating, we need to just eat, and we need to put the devices away.”

By parent age

Younger parents stand out in saying their screen time is too much in our survey.

This is true for smartphones (66% of parents ages 18 to 49 vs. 46% of older parents) and for social media (48% vs. 27%).

By parent race and ethnicity

Smartphones: 72% of White parents say they spend too much time on their smartphones. Smaller shares of Asian (61%), Black (59%) and Hispanic parents (54%) say the same.

Social media: White (50%) and Black parents (49%) are more likely than Hispanic (40%) and Asian parents (39%) to say this.

By household income

Smartphones: About seven-in-ten parents living in upper- (71%) or middle-income (69%) households say they spend too much time on their smartphone. This drops to 58% among parents with lower incomes.

There are no meaningful differences by household income for those who say they spend too much time on social media.

What parents want from tech companies and lawmakers

As kids spend more time online, technology companies have faced pressure from lawmakers and advocates to do more to keep children safe. And lawmakers themselves are facing criticism for not doing enough to protect kids.

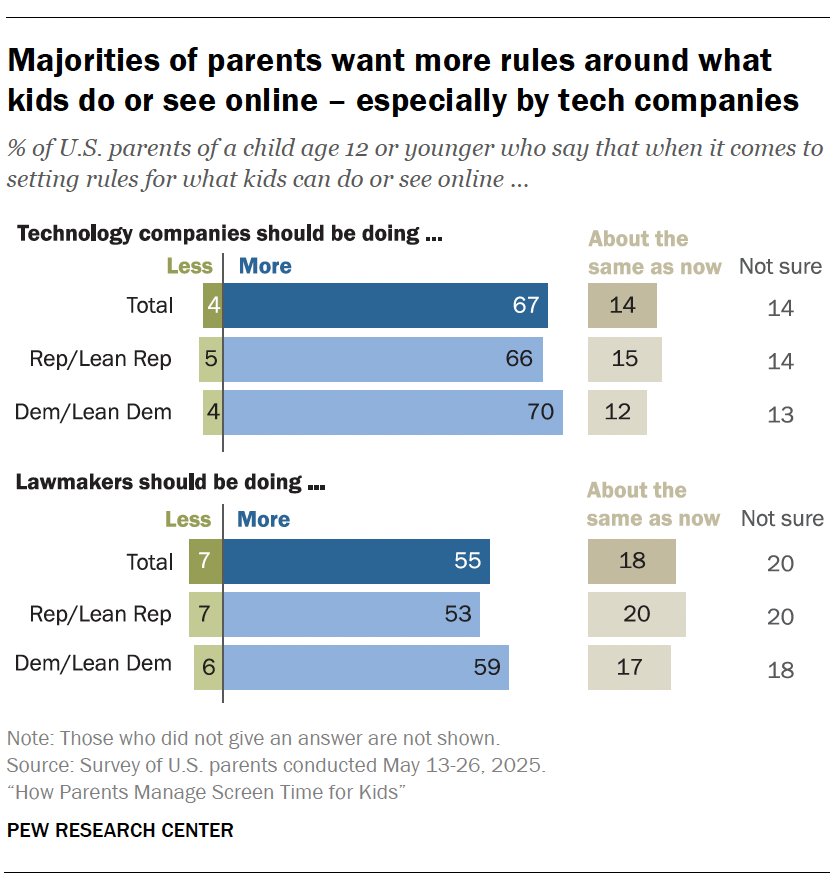
A bar chart showing Majorities of parents want more rules around what kids do or see online – especially by tech companies

Our survey finds that a majority of parents say tech companies and lawmakers should do more to set rules for what kids can do or see online.

Asked about lawmakers, 55% of parents say they should be doing more. And a larger share (67%) say so about technology companies.

In both cases, far fewer say tech companies or lawmakers should be doing less than they are now – or that they should stay the course.

A desire for increased rules and regulations around minors online is not new. A 2023 Center survey showed most U.S. adults were supportive of policies such as parental consent, age verification requirements and time limits for minors on social media.

By political party

A large majority of parents in both parties say tech companies should be doing more for kids online:

  • 70% of Democratic and Democratic-leaning parents
  • 66% of Republican and Republican-leaning parents

Slightly fewer in each party think lawmakers should be doing more. Roughly six-in-ten Democratic parents say this, versus 53% of Republican parents.

Appendix: Detailed tables

A table showing What online platforms parents say their kids use, now vs. 2020: TikTok, Snapchat, Instagram and Facebook
A table showing Shares of parents who say their kids watch YouTube, now vs. 2020
A table showing Shares of parents who say their kids watch YouTube daily, now vs. 2020

Acknowledgments

This report is a collaborative effort based on the input and analysis of the following individuals. Find related reports online at pewresearch.org/internet.

Primary researchers

Colleen McClain, Senior Researcher
Olivia Sidoti, Research Analyst
Michelle Faverio, Research Associate          
Suvi Lama, Former Research Intern

Research team        

Monica Anderson, Director, Internet and Technology Research   
Jeffrey Gottfried, Associate Director, Internet and Technology Research 
Eugenie Park, Research Assistant    
William Bishop, Research Associate 

Editorial and graphic design

Mia Hennen, Editorial Assistant
Kaitlyn Radde, Associate Information Graphics Designer

Communications and web publishing

Haley Nolan, Communications Manager
Maya Pottiger, Communications Associate
Sara Atske, Digital Producer

In addition, the project benefited greatly from the guidance of Pew Research Center’s methodology team: Andrew Mercer, Courtney Kennedy, Scott Keeter, Ashley Amaya, Dorene Asare-Marfo, Anna Brown, Arnold Lau and Dana Popky. This project also benefited from feedback from Center staff members Katerina Eva Matsa, Jonathan Evans, Luona Lin, Rachel Minkin and David Kent.

The Center gained invaluable advice from the guidance of four advisers: Jason Linden, National Board Certified Teacher; Mary Madden, Adjunct Faculty, Communication, Culture & Technology (CCT) program, Georgetown University; Desmond Upton Patton, Ph.D., M.S.W., Penn Integrates Knowledge (PIK) University Professor, University of Pennsylvania; and Jenny Radesky, M.D., Associate Professor of Pediatrics, University of Michigan Medical School. The feedback shared for this project is solely that of the individuals and does not express the views, policies or positions of their respective employers.

Methodology

The American Trends Panel survey methodology

Overview

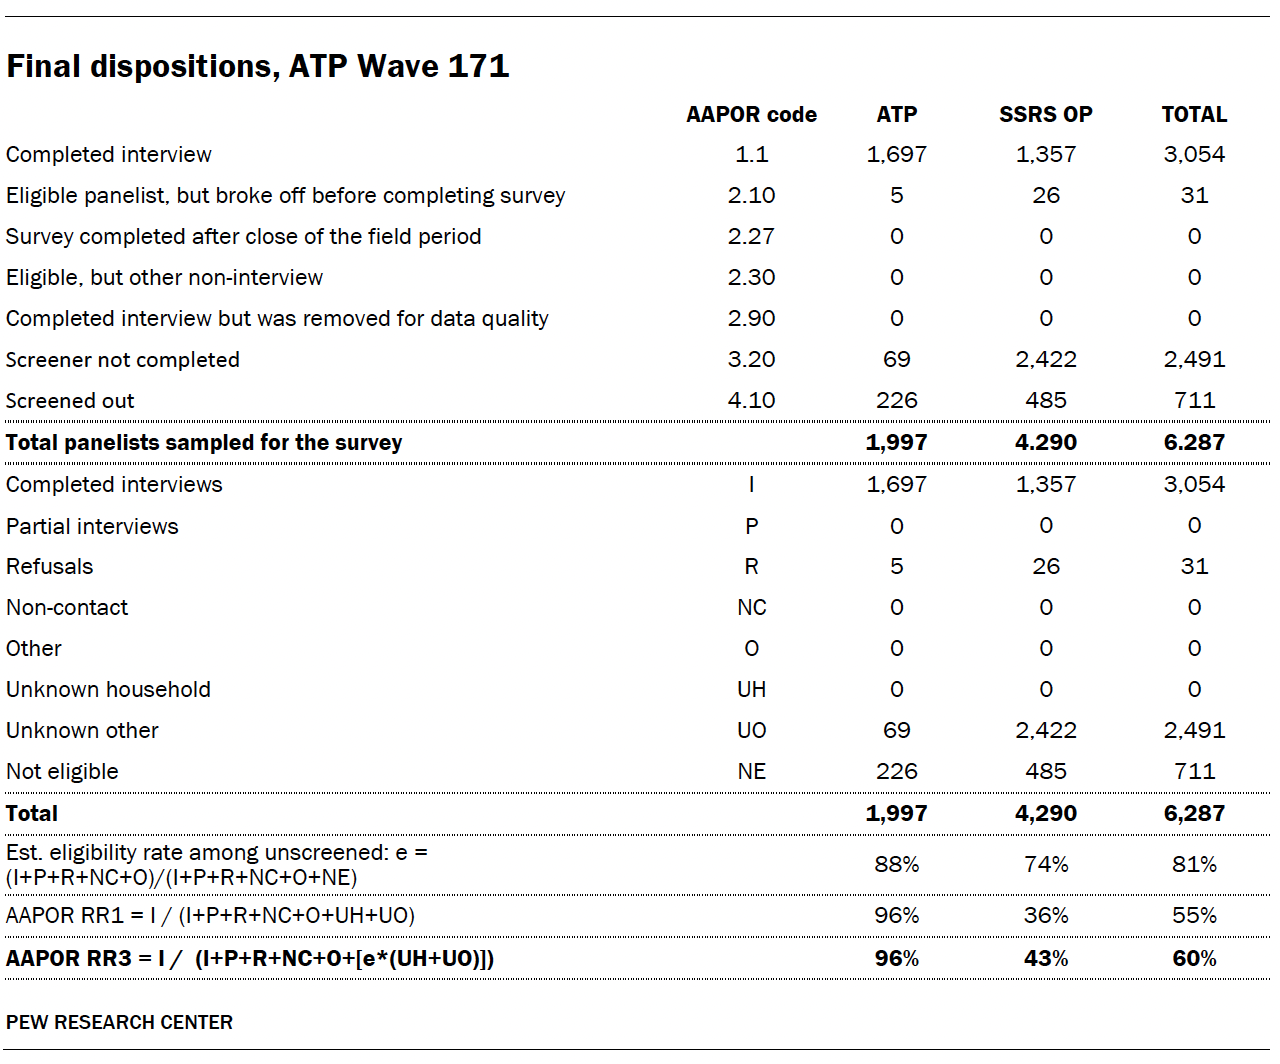
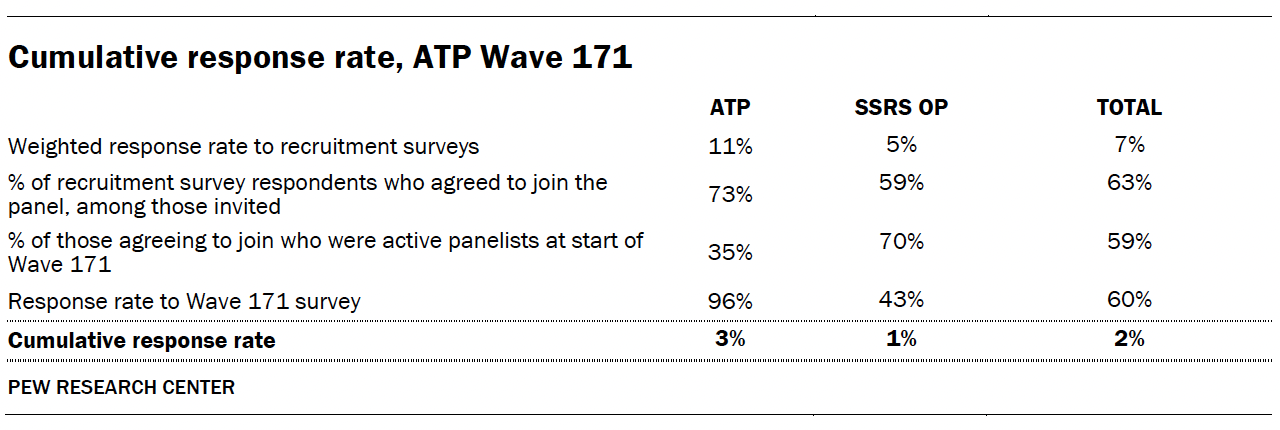
Data in this report comes from Wave 171 of the American Trends Panel (ATP), Pew Research Center’s nationally representative panel of randomly selected U.S. adults. The survey was conducted from May 13 to 26, 2025, among a sample of adults who are parents or guardians of any child age 12 or under. A total of 3,054 eligible parents responded out of 6,287 who were sampled, for a survey-level response rate of 60% (AAPOR RR3).12 This includes 1,697 respondents from the ATP and an additional 1,357 from the SSRS Opinion Panel (OP).

The cumulative response rate accounting for nonresponse to the recruitment surveys and attrition is 2%. The break-off rate among panelists who logged on to the survey and completed at least one item is 1%. The margin of sampling error for the full sample of 3,054 respondents is plus or minus 2.2 percentage points.

SSRS conducted the survey for Pew Research Center via online (n=2,935) and live telephone (n=119) interviewing. Interviews were conducted in both English and Spanish.

To learn more about the ATP, read “About the American Trends Panel.”13

Panel recruitment

Since 2018, the ATP has used address-based sampling (ABS) for recruitment. A study cover letter and a pre-incentive are mailed to a stratified, random sample of households selected from the U.S. Postal Service’s Computerized Delivery Sequence File. This Postal Service file has been estimated to cover 90% to 98% of the population.14 Within each sampled household, the adult with the next birthday is selected to participate. Other details of the ABS recruitment protocol have changed over time but are available upon request.15 Prior to 2018, the ATP was recruited using landline and cellphone random-digit-dial surveys administered in English and Spanish.

A national sample of U.S. adults has been recruited to the ATP approximately once per year since 2014. In some years, the recruitment has included additional efforts (known as an “oversample”) to improve the accuracy of data for underrepresented groups. For example, Hispanic adults, Black adults and Asian adults were oversampled in 2019, 2022 and 2023, respectively.

Sample design

The overall target population for this survey was noninstitutionalized persons ages 18 and older living in the United States who are the parent or guardian of any child 12 or under. All active ATP members who had previously indicated they were the parent or guardian of any child 12 or under were invited to participate in this wave.

The ATP was supplemented with a sample from SSRS’s Opinion Panel. For the OP sample, SSRS took a probability proportional to size (PPS) sample of OP panelists with children 0 to 17 years, then screened respondents for selection. Only OP panelists who were parents or guardians of any child 12 or under were screened into the survey.

At the start of the survey, potentially eligible respondents were asked a series of screening questions to confirm their eligibility to complete the survey. For the ATP and OP samples, respondents were considered eligible if they indicated they were the parent or guardian of any child 12 or under.

Questionnaire development and testing

The questionnaire was developed by Pew Research Center in consultation with SSRS. The web program used for online respondents was rigorously tested on both PC and mobile devices by the SSRS project team and Center researchers. The SSRS project team also populated test data that was analyzed in SPSS to ensure the logic and randomizations were working as intended before launching the survey.

Incentives

All respondents were offered a post-paid incentive for their participation. ATP and OP respondents may receive the post-paid incentive in the form of a check or gift code to online merchants such as Amazon.com, Target.com or Walmart.com. Incentive amounts ranged from $5 to $15 for ATP respondents, and $5 to $10 for OP respondents, depending on whether the respondent belongs to a part of the population that is harder or easier to reach. Differential incentive amounts were designed to increase panel survey participation among groups that traditionally have low survey response propensities.

Data collection protocol

The data collection field period for this survey was May 13 to 26, 2025. Surveys were conducted via self-administered web survey or by live telephone interviewing. 

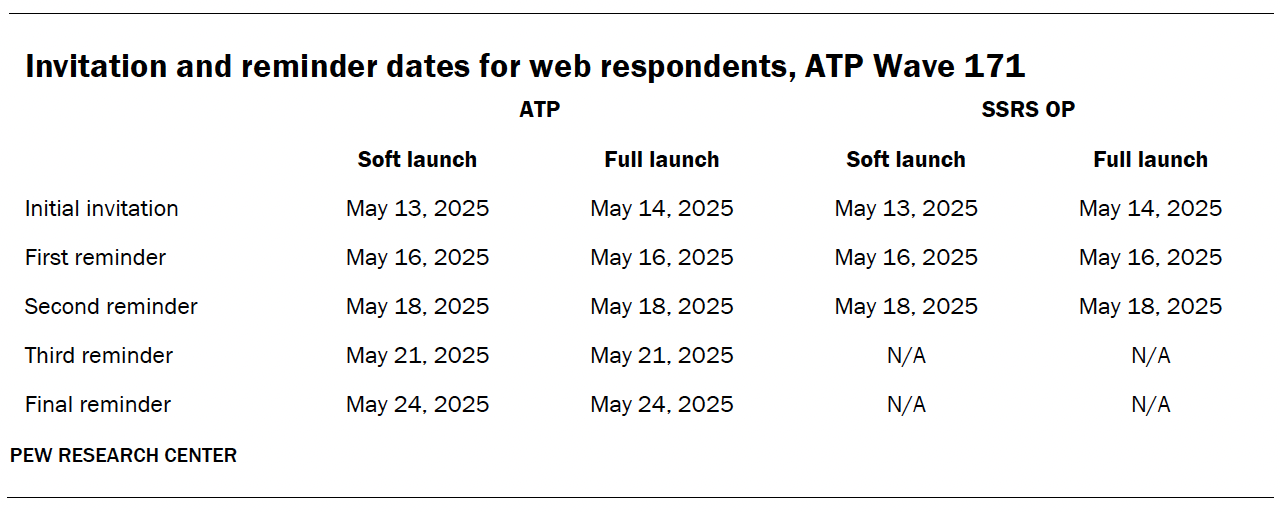
For panelists who take surveys online:16 Postcard notifications were mailed to a subset of ATP panelists on May 12.17 Survey invitations were sent out in two separate launches: soft launch and full launch. 427 panelists were included in the soft launch (60 from ATP, 367 from OP), which began with an initial invitation sent on May 13. All remaining English- and Spanish-speaking sampled online panelists were included in the full launch and were sent an invitation on May 14.

A table showing Invitation and reminder dates for web respondents, ATP Wave 171

Panelists participating online were sent an email invitation. ATP panelists received up to four email reminders if they did not respond to the survey, and OP panelists received up to two email reminders if they did not respond to the survey. ATP panelists who consented to SMS messages were sent an SMS invitation with a link to the survey and up to four SMS reminders. SSRS panelists who consented to SMS messages were sent an SMS invitation with a link to the survey and up to two SMS reminders.

For panelists who take surveys over the phone with a live interviewer: Prenotification postcards were mailed to ATP panelists on May 9. Soft launch took place on May 13 and involved dialing until a total of four interviews had been completed. All remaining English- and Spanish-speaking sampled phone panelists’ numbers were dialed throughout the remaining field period. Panelists who take surveys via phone can receive up to six calls from trained SSRS interviewers.

Data quality checks

To ensure high-quality data, Center researchers performed data quality checks to identify any respondents showing patterns of satisficing. This includes checking for whether respondents left questions blank at very high rates or always selected the first or last answer presented. As a result of this checking, no respondents were removed from the survey dataset prior to weighting and analysis.

Weighting

The ATP data is weighted in a process that accounts for multiple stages of sampling and nonresponse that occur at different points in the panel survey process. First, each panelist begins with a base weight that reflects their probability of recruitment into the panel. Base weights for OP respondents were provided by SSRS. The base weights for ATP and OP respondents were combined and scaled to account for the sample design.

The combined base weights were calibrated to align with the following estimated benchmarks for the population of parents or guardians of children ages 12 and under: age, gender, education, race/ethnicity, years living in the U.S. (among foreign born), volunteerism, voter registration, frequency of internet use, religious affiliation, party affiliation, census region, metropolitan status, the number of children ages 0 to 4, the number of children ages 5 to 12, and the number of children ages 13 to 17.

Because there are no official benchmarks for this population, weighting parameters were estimated using the eligible respondents to Wave 171 from the ATP sample. First, all ATP respondents who completed the screening questions on Wave 171, regardless of final eligibility, were weighted to match the full set of ATP members who were sampled on the following dimensions: age, gender, education, race/ethnicity, years living in the U.S. (among foreign born), volunteerism, voter registration, frequency of internet use, religious affiliation, party affiliation, census region and metropolitan status. These weights were then used to calculate weighting parameters based only on ATP respondents to Wave 171 who screened as eligible.

In the final step, the weights were trimmed at the 1st and 99th percentiles to reduce the loss in precision stemming from variance in the weights. Sampling errors and tests of statistical significance take into account the effect of weighting.

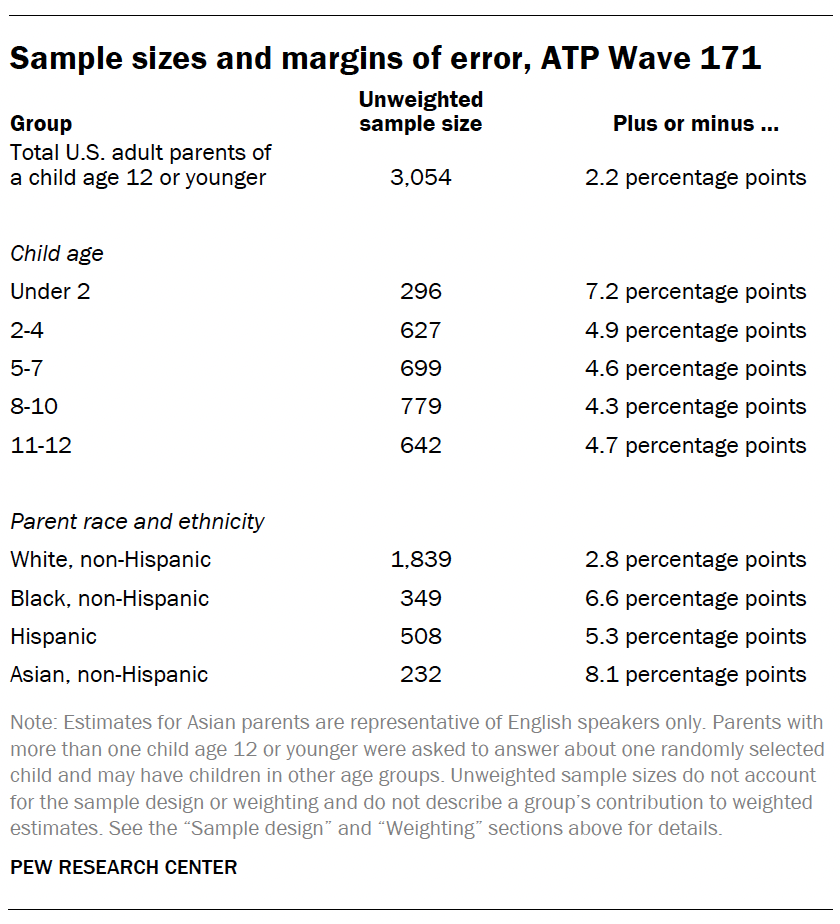
The following table shows the unweighted sample sizes and the error attributable to sampling that would be expected at the 95% level of confidence for different groups in the survey.

A table showing Sample sizes and margins of error, ATP Wave 171

Sample sizes and sampling errors for other subgroups are available upon request. In addition to sampling error, one should bear in mind that question wording and practical difficulties in conducting surveys can introduce error or bias into the findings of opinion polls.

Dispositions and response rates

A table showing Final dispositions, ATP Wave 171
A table showing Cumulative response rate, ATP Wave 171

How family income tiers are calculated

Family income data reported in this study is adjusted for household size and cost-of-living differences by geography. Panelists then are assigned to income tiers that are based on the median adjusted family income of all American Trends Panel members. The process uses the following steps:

  1. First, panelists are assigned to the midpoint of the income range they selected in a family income question that was measured on either the most recent annual profile survey or, for newly recruited panelists, their recruitment survey. This provides an approximate income value that can be used in calculations for the adjustment.
  2. Next, these income values are adjusted for the cost of living in the geographic area where the panelist lives. This is calculated using price indexes published by the U.S. Bureau of Economic Analysis. These indexes, known as Regional Price Parities (RPP), compare the prices of goods and services across all U.S. metropolitan statistical areas as well as non-metro areas with the national average prices for the same goods and services. The most recent data available at the time of the annual profile survey is from 2022. Those who fall outside of metropolitan statistical areas are assigned the overall RPP for their state’s non-metropolitan area.
  3. Family incomes are further adjusted for the number of people in a household using the methodology from Pew Research Center’s previous work on the American middle class. This is done because a four-person household with an income of say, $50,000, faces a tighter budget constraint than a two-person household with the same income.
  4. Panelists are then assigned an income tier. “Middle-income” adults are in families with adjusted family incomes that are between two-thirds and double the median adjusted family income for the full ATP at the time of the most recent annual profile survey. The median adjusted family income for the panel is roughly $74,100. Using this median income, the middle-income range is about $49,400 to $148,200. Lower-income families have adjusted incomes less than $49,400 and upper-income families have adjusted incomes greater than $148,200 (all figures expressed in 2023 dollars and scaled to a household size of three). If a panelist did not provide their income and/or their household size, they are assigned “no answer” in the income tier variable.

Two examples of how a given area’s cost-of-living adjustment was calculated are as follows: the Pine Bluff metropolitan area in Arkansas is a relatively inexpensive area, with a price level that is 19.1% less than the national average. The San Francisco-Oakland-Berkeley metropolitan area in California is one of the most expensive areas, with a price level that is 17.9% higher than the national average. Income in the sample is adjusted to make up for this difference. As a result, a family with an income of $40,400 in the Pine Bluff area is as well off financially as a family of the same size with an income of $58,900 in San Francisco. 

The respondents from the SSRS Opinion Panel oversample answered the same family income and household size questions, and their incomes were adjusted using the procedures detailed above. They were then assigned an income tier based on the median adjusted family income for the full ATP at the time of the most recent annual profile survey.

Advisory board

In addition to a team of subject area and methodological experts at Pew Research Center, the project was also guided by an advisory board of four members. This board included experts in a variety of areas related to parenting, children and technology.

  • Jason Linden, National Board Certified Teacher
  • Mary Madden, Adjunct Faculty, Communication, Culture & Technology (CCT) program, Georgetown University
  • Desmond Upton Patton, Ph.D., M.S.W., Penn Integrates Knowledge (PIK) University Professor, University of Pennsylvania
  • Jenny Radesky, M.D., Associate Professor of Pediatrics, University of Michigan Medical School

Advisers provided feedback at various key points during the report, including the questionnaire and a draft of the report. Pew Research Center remains solely responsible for all aspects of the research, including any errors associated with its products and findings. The feedback shared for this project is solely that of the advisers and does not express the views, policies or positions of their respective employers.

Focus groups

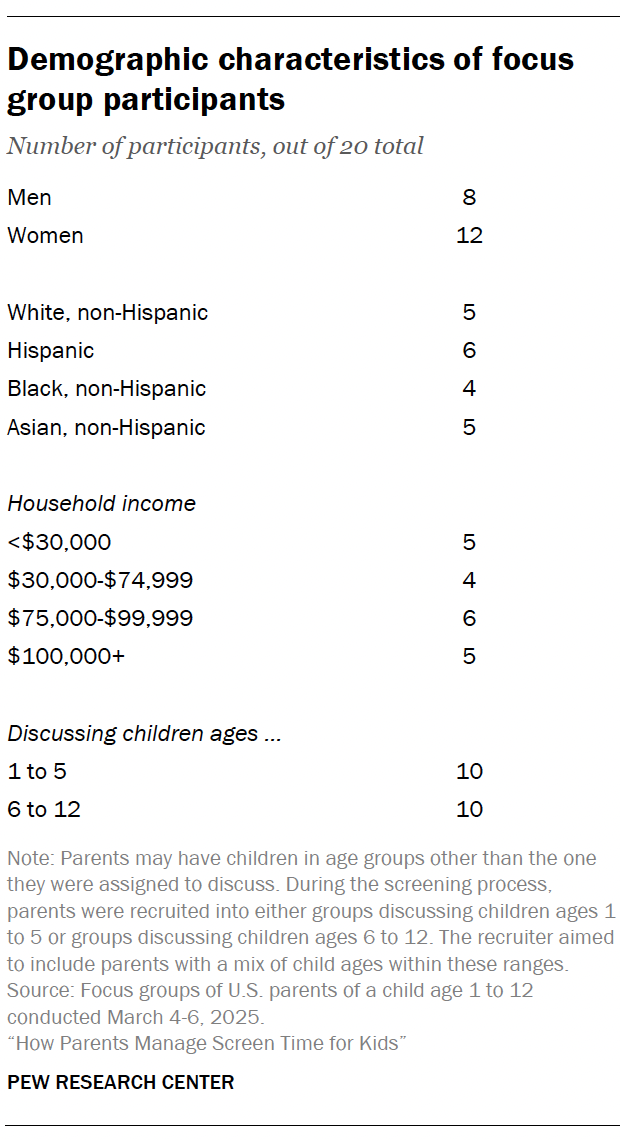
Pew Research Center worked with PSB Insights to conduct four online focus groups from March 4 to 6, 2025, with a total of 20 U.S. parents or guardians of at least one child ages 1 to 12.

The goal of these discussions was to explore parents’ views on topics we covered in the survey – including views of screen time and its impact, as well as navigating screen time decisions in parenting – in an in-depth manner. Each group lasted 90 minutes.

The discussions are not representative of all parents, nor do quotes selected represent the views of all participants in the groups. Instead, quotes included in the report are meant to provide color, context and nuance to the survey findings. They are pulled from larger discussion, and some quotes have been edited for concision and clarity.

Two groups were conducted with parents or guardians of at least one child ages 1 to 5, and two groups with parents or guardians of at least one child ages 6 to 12. Some participants had children in other age groups; they were asked to think about their child or children in the designated age range for each group.

Each group included five participants and was led by an experienced moderator using a discussion guide developed by Pew Research Center. The focus groups were conducted over a secure, online research platform with video and audio capabilities.

All participants were paid $150 for their time. Additionally, a $25 “early bird” raffle was offered to participants to encourage them to arrive early and ensure strong video and audio connections. In each group, one participant among those who logged into the groups more than 10 minutes before the scheduled start was randomly selected to win the extra $25.

Recruitment

The vendor worked with a qualitative recruitment specialist to target, recruit, and screen potential participants of this study. To be eligible, participants had to meet six criteria:

  • They had to be living in the United States
  • They had to be 18 years of age or older (19 or older if living in Nebraska or Alabama, 21 or older if living in Mississippi)
  • They had to be the parent or guardian of at least one child ages 1 to 12
  • They must not have participated in a marketing research focus group or one-on-one interview in the past three months
  • Neither they nor someone in their household were working in marketing/marketing research/consulting for any company, advertising/public relations for any company, or a media company
  • They had access to a computer with high-speed internet access and a working webcam.

Eligible participants also had to be willing to contribute to the research, able to attend the focus group on the set date and time and sign an informed consent form before they could participate.

The research team overrecruited participants to account for “no-shows,” as well as participants who may experience other issues preventing participation. Those who showed up for the group but did not ultimately participate were also given the incentive.

A table showing Demographic characteristics of focus group participants

The recruiter collected parents’ demographic information such as race and ethnicity, household income, education level, gender, number of children, urbanicity and ages of children. When prioritizing participants to include in the groups, the recruiter and research team considered this information with the goal of including a range of demographics in the groups, as well as parents with children of various ages. Refer to the table at right for a demographic breakdown of the final 20 participants.

Discussion

A professional moderator from PSB Insights conducted the online focus groups on behalf of Pew Research Center.

The moderator followed the same discussion guide for all focus groups but covered some topics in more depth than others depending on the age of children being discussed and the flow of the discussion. After introductions and ground rules, the guide covered the following topics:

  • What screen time looks like for their kids
  • Views of screen time and its impact
  • Navigating screen time decisions
  • Parents’ own technology use
  • AI and kids

The full discussion guide is available upon request.