
Pew-Knight Initiative

FOR RELEASE JUNE 12, 2024

How Americans Navigate Politics on TikTok, X, Facebook and Instagram

The experiences and views of each site’s users – from how much political content they see to the platforms’ impact on democracy

BY Colleen McClain, Monica Anderson and Risa Gelles-Watnick

FOR MEDIA OR OTHER INQUIRIES:

Communications Department
202.419.4372
www.pewresearch.org

RECOMMENDED CITATION

Pew Research Center, June 2024, "How Americans Navigate Politics on TikTok, X, Facebook and Instagram"

About the Pew-Knight Initiative

The Pew-Knight Initiative supports new research on how Americans absorb civic information, form beliefs and identities, and engage in their communities. Pew Research Center is a nonpartisan, nonadvocacy fact tank that informs the public about the issues, attitudes and trends shaping the world. Knight Foundation is a social investor committed to supporting informed and engaged communities.

© Pew Research Center 2026

Table of contents

  • About the Pew-Knight Initiative
  • How Americans Navigate Politics on TikTok, X, Facebook and Instagram
  • 1. How TikTok users view, experience the platform
  • 2. How X users view, experience the platform
  • 3. How Facebook users view, experience the platform
  • 4. How Instagram users view, experience the platform
  • Appendix
  • Acknowledgments
  • Methodology

How Americans Navigate Politics on TikTok, X, Facebook and Instagram

The experiences and views of each site’s users – from how much political content they see to the platforms’ impact on democracy

How we did this

Pew Research Center conducted this study to understand how TikTok users, X (formerly Twitter) users, Instagram users and Facebook users experience politics on these platforms. For this analysis, we surveyed 10,287 adult internet users in the United States from March 18 to 24, 2024.

Everyone who took part in the survey is a member of the Center’s American Trends Panel (ATP), an online survey panel that is recruited through national, random sampling of residential addresses. This way, nearly all U.S. adults have a chance of selection. The survey was weighted by combining the sample of internet users with data from ATP members who do not use the internet, and weighting the combined dataset to be representative of all U.S. adults by gender, race, ethnicity, partisan affiliation, education and other categories. The analysis in this report is based on those who use the platforms of interest. Refer to the survey methodology for details. Read more about the ATP’s methodology.

Here are the questions used for this report, along with responses, and the survey methodology.

This is a Pew Research Center report from the Pew-Knight Initiative, a research program funded jointly by The Pew Charitable Trusts and the John S. and James L. Knight Foundation. Find related reports online at https://alpha.pewresearch.org/pewresearch-org/pew-knight/.

Social media platforms are often at the center of the nation’s political debates – from free speech and harassment to the fate of democracy itself. Companies’ decisions about who and what to allow on their platforms have taken on even more weight ahead of the 2024 U.S. presidential election.

Results from a Pew Research Center survey conducted in March 2024 shed new light on this environment. Americans’ experiences with politics on social media often depend on the platforms they use, from TikTok and X to Facebook and Instagram.
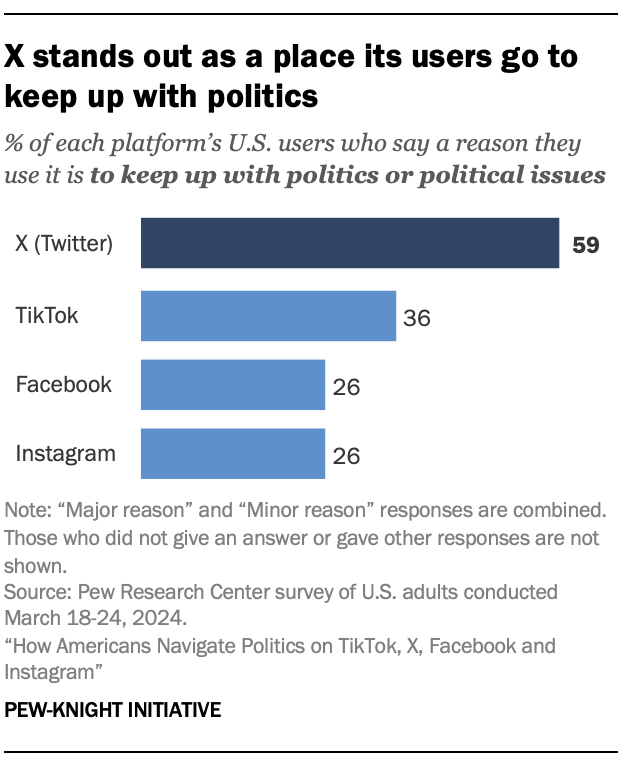
A bar chart showing that X stands out as a place its users go to keep up with politics

X stands out as a place people turn to for politics. A majority of X users (59%) say keeping up with politics or political issues is a reason they use it, compared with 36% of TikTok users and even smaller shares of Facebook or Instagram users (26% each).

A bar chart showing that On TikTok, Facebook and Instagram, politics takes a backseat to entertainment, connections as reasons U.S. users say they use each platform

There’s a range of reasons people are drawn to social media platforms – even on X, where using it to keep up with politics is relatively common. On TikTok, Facebook and Instagram, politics takes a backseat to other reasons we explored.

For example:

  • Entertainment largely reigns, especially on TikTok. Nearly all TikTok users (95%) say they’re on it because it’s entertaining, and about three-quarters or more say the same for X, Facebook and Instagram.
  • On Facebook and Instagram, friends and family are motivators. Most Facebook and Instagram users say a reason for using each is to keep up with friends and family. This share drops to 44% for TikTok and 33% for X.

Related: How Americans Get News on TikTok, X, Facebook and Instagram

More about this project

This project was designed to understand how people’s experiences and views differ across social media sites and apps.

The survey covered four social media platforms: TikTok, X (formerly Twitter), Facebook and Instagram. Each platform’s questions were identical.

This report focuses on politics on social media. To learn about how people get news on these platforms, read the companion report.

Still, people are coming across political posts as they scroll through social media. And companies’ policies shape the political environment people enter when they log on.

Our survey of 10,287 U.S. adult internet users, conducted March 18-24, 2024, set out to explore what this looks like on TikTok, X, Facebook and Instagram today.

Jump to the following sections to learn more about how experiences and views differ across these four platforms:

  • Social media and democracy
  • Seeing and sharing politics
  • Why people do – or don’t – post about politics
  • Free speech and harassment

And for a deep dive on one platform at a time, go to the chapter covering its users’ views and experiences:

  • TikTok
  • X
  • Facebook
  • Instagram

This is one of two Pew Research Center reports on habits and attitudes on different social media platforms from the Pew-Knight Initiative, a research program funded jointly by The Pew Charitable Trusts and the John S. and James L. Knight Foundation.

Social media and democracy

The relationship between social media and elections has often been rocky. In 2016, platforms struggled to stop the spread of election misinformation. After 2020, they grappled with decisions to ban former President Donald Trump.

Not everyone is convinced platforms are a dire threat to democracy. But as experts warn misinformation could worsen in 2024 and the Supreme Court tackles cases defining free speech on social media, the question persists: Are these platforms good for democracy?

We’ve asked this question about X (formerly Twitter) before – once in 2021, before Elon Musk took over the platform and revamped it, and again in 2023.

Line charts showing that The share of Republican users who see X as mostly good for democracy has roughly tripled from 17% in 2021 to 53% today.

Today, views of X are more positive than negative. About four-in-ten X users (38%) say it’s mostly good for democracy, 27% say it’s mostly bad, and 34% say it has no impact. That’s an uptick of 6 percentage points in the share who say it’s mostly good from last year.

GOP users’ views of X have changed dramatically in the past three years. The share of Republican users who see X as mostly good for democracy has roughly tripled from 17% in 2021 to 53% today. This includes a 10-point rise in just the past year (from 43% to 53%). (Throughout this report, Democratic and Republican users include independents who lean toward each party.)

Democratic X users’ views are trending negative. The share of Democratic users who see it as mostly bad for democracy has risen 11 points since 2021, to 39% today.

Partisans hold opposing views of X. Republican X users are far more likely than Democratic users to see it as mostly good for democracy (53% vs. 26%). In contrast, Democratic users are three times as likely as their GOP counterparts to see it as mostly bad (39% vs. 13%).

For the first time, we asked this question about Facebook, Instagram and TikTok. We found that not everyone thinks these platforms play a role in the democratic process.

A bar chart showing that The largest shares of Instagram, TikTok and Facebook users say the platforms have no impact on democracy

For Instagram, TikTok and Facebook, the most common view is that each has no impact on democracy. Over half of Instagram users say so, as do 49% of TikTok users and 43% of Facebook users.

Otherwise, views of TikTok and Instagram are more positive than negative. A third of TikTok users say it’s mostly good, versus 17% who say it’s mostly bad.

Similarly, 26% of Instagram users say it’s mostly good, compared with 16% who say it’s mostly bad.

On the other hand, views of Facebook are more negative than positive: 31% of Facebook users think it’s mostly bad, while 24% say it’s mostly good. But the largest share (43%) says it has no impact.

Seeing and sharing politics

X is the only platform where a majority of users cite politics as a reason they use it. But people on TikTok, Facebook and Instagram still come across political content.
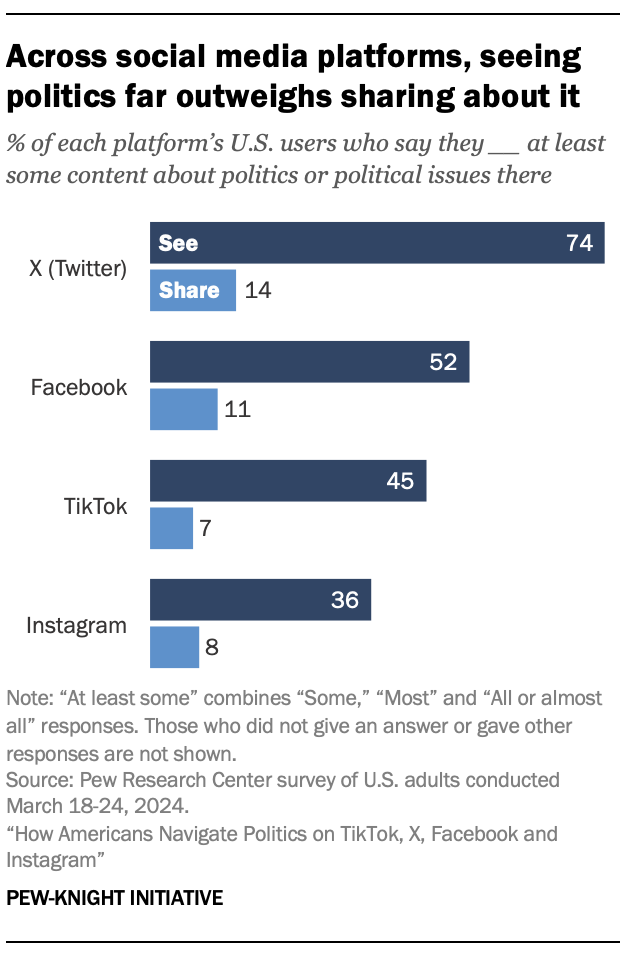
A bar chart showing that Across social media platforms, seeing politics far outweighs sharing about it

How much political content do people see – and share?

Like with reasons for use, X leads in how much politics its users see. Most X users (74%) say at least some of what they see on it is about politics or political issues. Smaller shares of users say the same for Facebook (52%), TikTok (45%) and Instagram (36%).

People are far more likely to see politics than share about it. Just 14% of X users say at least some of what they post or share on it is about politics or political issues. About one-in-ten Facebook, TikTok and Instagram users say the same.1.

On each platform, Republicans and Democrats are similarly likely to see at least some political content there – and that’s also true for sharing it. For example, identical shares of Republican and Democratic TikTok users (47% each) see at least some political content there. (Refer to the Appendix for these shares for all four platforms.)

Which way does political content on platforms lean?

Accusations of political bias and censorship on platforms have been widespread in recent years, both in the news and among the general public. But what do users of these platforms think about the content they see?

A bar chart showing that 31% of X users say what they see about politics doesn’t lean liberal or conservative, versus slightly smaller shares on other platforms who say the same

Across all four platforms we studied, some users don’t see a clear lean to one side in the content they consume. About four-in-ten or more say that what they see about politics doesn’t lean toward a particular ideology or that they are unsure. For example, 53% of Facebook users say what they see doesn’t lean either way (24%) or that they are unsure (29%).

Still, Instagram, Facebook and TikTok users are more likely to say what they see is mostly liberal than mostly conservative. About a quarter on each platform say what they see is mostly liberal. Smaller shares perceive a conservative lean.

X users are about evenly split between thinking what they see leans liberal (19%) versus conservative (18%). Another 31% say it doesn’t lean either way.

Differences by party

Party differences depend on which platform we’re looking at. For example, Republicans who use Facebook are more likely than Democrats to say the political content they come across there is mostly liberal (29% vs. 16%). Their Democratic counterparts are slightly more likely to say the content is mostly conservative (16% vs. 10%).

On the other hand, on X, Republicans are more likely than Democrats to say what they see doesn’t lean either way (37% vs. 26%). But Democratic users are somewhat more likely than Republican users to say what they see there leans liberal (22% vs. 16%).

There are also slight party differences on Instagram and TikTok (refer to the back chapters for more).

Why people do – or don’t – post about politics

To understand more about what motivates people to post (or not), we followed up with two groups of users.

Why people post about politics

We asked users who say they post at least a little political content on these platforms about four reasons why they might do so.

A dot plot showing that TikTok and X stand out as places people post political content because they feel it belongs there

Politics belonging there: About two-thirds of those who share things about politics on TikTok or X say a reason why is that politics belongs there. Far fewer on Instagram (45%) or Facebook (40%) say this.

Making a difference: About three-quarters of users who post political content on TikTok (73%) say it’s because this is a place they can make a difference. By comparison, smaller shares post political content on X (58%) or Facebook (54%) for this reason. (The share who say this about Instagram – 64% – is statistically similar to both TikTok and X.)

Feeling obligated: Roughly three-quarters of those who post about politics on X or TikTok say feeling it’s something they should do is a reason why they do so, along with a similar share of their peers on Instagram (70%). Among Facebook users who share politics there, 63% cite this as a reason.

A welcoming environment: Most TikTok and X users who post about politics also say their views feeling welcome there is a reason they do so – higher than the shares on the other platforms.

Differences by party

For some platforms, we were also able to explore how these reasons might vary by party.2 For example, on X, Republican users who post about politics are more likely than their Democratic counterparts to cite their views being welcome there as a major reason why they do so (54% vs. 33%).

Conversely, on Facebook, Republicans who post about politics are less likely than their Democratic peers to cite a welcoming environment as a major reason they post about politics (12% vs. 20%).

Why people steer clear of posting about politics

A dot plot showing that Majorities of Facebook and Instagram users who keep politics out of their posts say it doesn’t belong there

We also asked users who say they post on the platforms, but never about politics or political issues, about four reasons why they might avoid doing so.

Politics not belonging there: A majority of Facebook (67%) and Instagram (60%) users who keep politics out of their posts say it’s because politics doesn’t belong there. Smaller shares say the same for TikTok (47%) or X (36%).

The threat of harassment: Similar shares of Facebook (48%) and Instagram (44%) users who avoid posting politics say it’s because they don’t want to be criticized or harassed there. A smaller share of their counterparts on TikTok (35%) say the same. (The share who says this about X doesn’t statistically differ from the other platforms.)

To learn about those who don’t care or don’t think it’ll make a difference, and for more on how reasons rank within a platform, refer to the back chapters on TikTok, X, Facebook and Instagram.

Differences by party

Again, we were able to explore how these reasons differed by party for some platforms.3 For example, on Facebook, Republicans who avoid posting about politics are slightly more likely than Democrats to say politics not belonging there is a major reason they don’t post this (49% vs. 42%).

There is a similar pattern for Instagram: 44% of Republicans versus 36% of Democrats say a major reason they avoid this is because politics doesn’t belong there.

Free speech and harassment

Social media platforms’ decisions about what content to allow can be consequential. Elon Musk has declared X a place for free speech, but some say its policies have the opposite effect. Meta has moved to limit political content on its platforms, including Facebook and Instagram. And TikTok has come under fire for alleged censorship, including by those posting about #BlackLivesMatter.

We wanted to hear from each platform’s user base: Do platforms feel like places for open political expression? 

A dot plot showing that Most users say people feel free to talk politics on social media platforms; GOP Facebook users are more skeptical

Most users think people feel free to express political views on these platforms. About nine-in-ten X users and a similar share of TikTok users think so. Three-quarters of Instagram users and 71% of Facebook users say the same.

Majorities of users across the political aisle say this, but Republican users are less likely than Democrats to think people feel free to talk about politics on Facebook, Instagram and TikTok. For example, they are more skeptical about free expression on Facebook: 35% of Republican Facebook users think people do not feel free to express political views there, compared with 20% of Democrats.

However, similar shares across parties see X as a place for free expression. About nine-in-ten Republican users think people there feel free to express political views, and roughly the same share of Democratic users say so.

Harassment

With open expression can come anger and abuse. Our previous work shows that while online harassment occurs in a wide range of places from gaming to dating apps, it most often occurs on social media sites. And a rising share of Americans have been harassed online because of their political beliefs.

A bar chart showing that Democrats who use X are far more likely than Republicans to say harassment is a major problem on the site

Harassment is widely seen as a problem on each of these sites. Roughly eight-in-ten Facebook users say this is a problem there, including 31% who say it’s a major one.

Smaller shares of X, TikTok and Instagram users – though still about seven-in-ten – see harassment as a problem on these sites.

The extent to which people think harassment is a problem differs by party, especially on X. Democratic users are about three times as likely as Republican users to say harassment is a major problem (48% vs. 15%).

Partisan differences are more modest for other sites. For example, 35% of Democrats who use Facebook see harassment as a major issue on the site, compared with 26% of Republican users.


1. How TikTok users view, experience the platform

TikTok has grown in popularity in recent years, attracting users with short-form videos ranging from viral dances to product reviews to mental health stories.

It’s also grown as a place for news – particularly among young people. And politicians and activists alike have used the platform to engage with issues they care about.

To learn more about the political environment on TikTok, we asked U.S. users about their experiences and views. Here are the key findings:

  • Entertainment is the main draw. Almost all TikTok users (95%) say they go on the platform because it’s entertaining. In contrast, only 36% say keeping up with politics is a reason they use it.
  • Some see political content, but few post it. Among users, 45% see at least some political content on TikTok, but only 7% post at least some themselves.
  • Users have mixed views on TikTok and democracy. More users say it’s mostly good (33%) than mostly bad (17%) for American democracy. Still, 49% say there’s no impact. Republican users are slightly more likely than Democratic users to say it’s bad (22% vs. 15%). (Throughout this report, both groups include independents who lean toward each party.)
  • Most TikTok users think people feel free to express political views there. The vast majority (86%) say so. This is the case in both parties, though Democrats are somewhat more likely to hold this view than Republicans (88% vs. 81%).

Why and how people use TikTok

Our survey explored the “why” and “what” behind how people use the platform.

Reasons for using TikTok

A bar chart showing that 95% of TikTok users say entertainment is a reason for using the platform; only about a third say politics is

Almost all adults who use TikTok (95%) say they go on the platform for entertainment. This includes 81% of users who say this is a major reason they use it.

Smaller, but still sizable, shares say a reason they use TikTok is to connect with others who share their interests (65%), to look at product reviews or recommendations (62%), or to keep up with sports or pop culture (53%).

Fewer than half of users say keeping up with family and friends, news or politics are reasons they use TikTok.

Related: News as a reason people use TikTok

By party

For the most part, Republicans and Democrats have similar reasons for using TikTok, but some differences emerge. For example, Democratic users are more likely than Republican users to say keeping up with politics and political issues is a reason they use TikTok (40% vs. 33%).

Seeing politics on TikTok 

Just under half of TikTok users say that at least some of what they see on the site is about politics or political issues. But a larger share – 54% – say only a little or none of the content they see on TikTok is political.

A pie chart showing that 45% of TikTok users say at least some of what they see on the site is political

By party

Identical shares of Republican and Democratic TikTok users (47% each) say they see at least some political content.

Posting about politics on TikTok

TikTok users are far more likely to see political content than to actively post it themselves. Just 7% of users say they post or share at least some content that is political in nature. Another 29% say they post, but that little or none of it is about politics.

A pie chart showing that Most users do not post political content on TikTok

Still, the majority of TikTok users (63%) say they don’t post or share anything on the site.

By party

Similar shares of Democratic (7%) and Republican (8%) users report sharing at least some political content.

Why do people post about politics on TikTok?

We asked the 12% of TikTok users who share at least a little political content there about four potential reasons for doing so.4

A bar chart showing that 81% of TikTok users who post about politics say it’s because their views are welcome there

Among TikTok users who post about politics:

  • 81% say that a motivation for posting political content is that their views are welcome on TikTok. This includes 42% who say this is a major reason. 
  • 73% each say TikTok being a place they can make a difference or feeling like it’s something they should do are reasons they post about politics.
  • 65% say politics belonging on TikTok is a reason.

Why don’t people post about politics on TikTok?

A bar chart showing that 56% of TikTok users who don’t post about politics say it’s because they don’t care about it

We also wanted to find out why those who don’t share about politics on the site forego doing so.

Among the 24% of TikTok users who post, but never about politics:

  • 56% say a reason is that they don’t care about politics.
  • 47% feel politics doesn’t belong on TikTok.
  • 42% say a reason is that posting on TikTok won’t make a difference.
  • 35% say a reason they don’t post political content on TikTok is because they don’t want to be criticized or harassed.

How TikTok users see its climate and impact

TikTok has made efforts to curb harassment on its platform. However, what some may see as steps to create a more positive environment, others might label as censorship.

To understand the broader climate on TikTok, we asked users about the platform’s political environment, including its effect on democracy.

TikTok and American democracy

A bar chart showing that More users think TikTok is mostly good rather than mostly bad for American democracy

One-third of TikTok users say the platform is mostly good for American democracy. This is roughly double the share of users who say it’s mostly bad (17%).

However, the largest share of users (49%) say that TikTok has no impact on American democracy.

By party

Democratic users are more likely than Republican users to say the platform is mostly good for democracy (36% vs. 29%). In turn, more Republicans than Democrats say the platform negatively impacts democracy in the country.

There are no differences by party in users who believe TikTok has no impact on this.

Free expression on TikTok

A bar chart showing that Most users say people feel free to express their political views on TikTok

In recent years, TikTok has been accused of banning certain types of political content. Our survey finds that 86% of TikTok users think people feel free to openly state their political views on the platform.

Just 12% say people do not feel free to express these kinds of views.

By party

Large majorities of Republican and Democratic users agree that people can freely express political views on TikTok. But Democrats are slightly more likely than Republicans to say this (88% vs. 81%).

Political content users see on TikTok

A bar chart showing that Roughly 1 in 5 users say the TikTok content they see leans liberal; fewer say it leans conservative

When it comes to the ideological slant of the political content posted on TikTok, more users say what they see leans liberal (22%) than say it leans conservative (6%).

However, 24% say the content doesn’t lean toward either side of the spectrum and an identical share say they’re not sure.

By party

Democrats are slightly more likely than Republicans to say the political content they see on TikTok leans liberal (26% vs. 20%). The reverse is also true: 10% of Republicans say what they see about politics leans conservative, while only 5% of Democrats say the same.

But roughly half of each party’s users say the content they see doesn’t lean either way or that they’re not sure.

Harassment on TikTok

A bar chart showing that Majority of TikTok users say harassment is a problem on the platform

People who use TikTok largely believe that harassment is a problem on the platform: 71% of TikTok users say so. This includes 23% who say it’s a major problem.

By party

Democratic users are more likely than Republican users to believe that harassment is an issue on TikTok (77% vs. 65%).

By contrast, larger shares of Republican (34%) than Democratic (22%) users believe this is not an issue on the platform.


2. How X users view, experience the platform

For Americans who use X – about a quarter of adults, as of last year – it’s a place people turn to stay entertained, connect with others and keep up with what’s going on.

At the same time, it’s a platform where change has been a constant, including Elon Musk’s rebranding of it from Twitter to X. Throughout the changes, X has been at the center of national debates surrounding free speech, political discussion and democracy itself.

Our survey took a deep dive into users’ experiences and views of X. Among the key findings:

  • Politics is part of life on X. About three-quarters of users (74%) see at least some political content on the platform, and a majority (59%) say keeping up with politics or political issues is a reason they use it.
  • Republicans who post about politics there are especially likely to say a major reason they do so is that their views feel welcome. They’re more likely than Democrats who post about politics on X to say this is the case (54% vs. 33%). (Throughout this report, references to Republicans and Democrats include independents who lean toward each party.)
  • More users say X is mostly good (38%) than bad (27%) for democracy, but there are deep partisan divides on this topic. The share saying it’s mostly good has risen since our last survey. This reflects growing positivity among Republican users.
  • Despite these divides, there’s bipartisan agreement that people feel free to express their political views on X. Most Republican (89%) and Democratic (86%) users say this.

Why and how people use X

Our survey explored the “why” and “what” behind how people use the platform.

Reasons for using X

A bar chart showing that Most users are on X because it’s entertaining, but majorities also use it for politics, news

We asked X users about seven reasons they might use it. Among the key takeaways:

X is entertaining. Most users say this is a reason they’re on it, including more than four-in-ten who say this is a major reason.

Many use it to get news or keep up with politics and political issues. And about a quarter each say this is a major reason.

Connection and keeping up with sports or pop culture round out the most commonly cited reasons for using X. Majorities of users cite each as a reason for using X. Those shares each include roughly a quarter who say they’re major reasons for being on the platform.

Related: News as a reason people use X

By party

Republican X users are more likely than their Democratic peers to say a major reason they use X is to keep up with politics (29% vs. 20%) or to get news (29% vs. 21%).

Seeing politics on X 

Seeing politics on X is commonplace. The vast majority of X users (74%) come across at least some political content as they browse the site. This includes 29% who say all or most of what they see is about politics or political issues, and 45% who say that’s some of what they see.

A pie chart showing that The vast majority of X users see at least some political content on it

But not everyone sees politics: 18% see only a little of this type of content, and 8% see none at all.

By party

Republican users (75%) are just as likely as Democratic users (73%) to see at least some politics on X.

Posting about politics on X

Even though the majority of X users see political content there, fewer post or share it themselves.

A pie chart showing that 14% of X users say they post at least some political content there

Just 14% of X users say they share at least some things about politics or political issues there.

About one-in-five say they post, but that little (9%) or none (11%) of it is about politics. By far the largest share – 65% – don’t post on the platform at all.

By party

Republicans are somewhat more likely than Democrats to say they post all, or mostly, political content (9% vs. 5%).

Why do people post about politics on X?

In total, 24% of X users say they post at least a little about politics there. We followed up by asking them about four specific reasons why they might do so.

A bar chart showing that Most X users who post about politics say it’s because their views are welcome there – but also because they feel obligated to do so

Among X users who post about politics:

  • Many say their views being welcome on X (76%) and feeling it’s something they should do (74%) are reasons they post about political topics.
  • 67% say it’s because politics belongs there.
  • 58% say a major or minor reason they post about politics is that it’s a place they can make a difference.

By party

A dot plot showing that Republicans who post about politics on X are more likely than Democrats to say that a major reason they do so is that their views are welcome there

Republicans and Democrats cite similar major reasons why they post about politics on X, with one exception: it being a welcoming environment. Some 54% of Republican X users who post about politics say this is a major reason, versus 33% of their Democratic counterparts.

Democrats, on the other hand, are more likely than Republicans to cite this as a minor reason (38% vs. 26%).

Why don’t people post about politics on X?

A bar chart showing that 51% of those who don’t post about politics on X say it’s because they don’t think it will make a difference

Next, we asked the 11% of X users who say they post, but not about politics, about four potential reasons why they might not do this.5

They’re more likely to say it’s because it won’t make a difference than to say politics doesn’t belong there.

Among X users who post, but never about politics:

  • 51% say it’s because posting there won’t make a difference, including 29% who say that’s a major reason they don’t post about politics.
  • Similarly, roughly four-in-ten each say a reason is avoiding criticism or harassment (42%) or not caring about politics (41%).
  • About a third (36%) of those who don’t post about politics cite politics not belonging there as a reason.

How X users see its climate and impact

Politics plays a prominent role in X users’ day-to-day experiences – as well as in the platform’s policies and decisions. It’s been in the spotlight for everything from reinstating banned users to advocating for free speech on the platform.

In this light, we wanted to understand how X users themselves feel about the platform’s impact and environment – both the good and the bad. 

X and American democracy

A line chart showing that Growing share of Republican X users see it as mostly good for democracy

Overall, more X users say the platform is mostly good for democracy (38%) than say it is mostly bad (27%); 34% say it has no impact.

The share saying it’s good has ticked up since 2023 and is now roughly on par with when we first asked about this in 2021 – before Musk bought the platform.

By party

Views of X and democracy are deeply partisan. Republicans are about twice as likely as Democrats to say it’s good for democracy (53% vs. 26%). Democrats are three times as likely as Republicans to say it’s bad (39% vs. 13%).

These partisan divides have shifted dramatically over the past several years. Today, 53% of Republican users say X is mostly good for American democracy, compared with 43% who said so a year ago and just 17% in 2021.

At the same time, Democratic users have become more likely to deem the site bad for democracy since the question was first asked in 2021. That share has risen from 28% to 39% today.

Free expression on X

A bar chart showing that Across parties, X users widely view it as a place where people feel free to express their political views

X has been in the national – and even global – spotlight recently over Musk’s pledges related to users’ speech. But do users view it as a place where politics can freely be shared?

Most X users (87%) say so – they think people feel free to openly express their political views on the platform. Only 12% think people don’t feel free to do so on X.

By party

Similar shares of Republican (89%) and Democratic (86%) users say people generally feel free to express their political views.

Political content users see on X

A bar chart showing that X users are about equally likely to say the political content they see leans liberal versus conservative

Asked how the political content they see on X leans, users hold mixed views. About one-in-five each say it leans mostly liberal (19%) or mostly conservative (18%).

The largest share says it doesn’t lean either way (31%). About a quarter (23%) are not sure, and 8% don’t see anything about politics or political issues.

By party

There are minor differences in views by party. Democratic users are somewhat more likely than their GOP peers to say what they see leans liberal (22% vs. 16%). Republican users, on the other hand, are more likely to say it doesn’t lean either way (37% vs. 26%).

Harassment on X

A bar chart showing that Many X users – especially Democrats – see harassment as a problem on the platform

About three-quarters of users (73%) say people getting harassed is a problem on X, including 32% who say it’s a major problem.

By party

There are sizable partisan gaps in views of this issue’s extent. Democratic users are far more likely than Republican users to say harassment is a major problem on X (48% vs. 15%).

By contrast, 40% of Republicans who use the site say harassment is not a problem on X, compared with 13% of their Democratic counterparts.

3. How Facebook users view, experience the platform

It’s been two decades since Facebook first launched in 2004. Since then, the company has grown into a social media giant with billions of users worldwide. Facebook remains one of the most widely used social media sites among adults in the United States.

But it’s also had its controversies, including those related to politics. Facebook was widely criticized for how it handled misinformation leading up to the 2016 U.S. presidential election. And some researchers believe its algorithm amplifies partisan divides.

This chapter explores Facebook’s connection with politics, including its prevalence on the site and users’ views of its impact on the political environment.Here are some of the key findings:

  • Relationships – not politics – drive people to use Facebook. Most Facebook users (93%) say keeping up with friends and family is a reason why they use Facebook; just 26% say the same for politics or political issues.
  • Relatively few people post about politics or political issues on the site. Just 11% of Facebook users say they post at least some political content there. By comparison, people are much more likely to see political content on it: 52% of users say at least some of what they see is about this.
  • Facebook users have mixed views about its impact on democracy. The largest share (43%) says it has no impact on American democracy, but slightly more say it’s mostly bad (31%) than mostly good (24%) for democracy.
  • Republicans on the site are more skeptical that free expression is the norm. While 71% of users think you can freely express your political views on Facebook, Republicans are more likely than Democrats to say this is not the case (35% vs. 20%). (Throughout this report, both groups include independents who lean toward each party.)

Why and how people use Facebook

Our survey explored the “why” and “what” behind how people use the platform.

Reasons for using Facebook

A bar chart showing that About 9 in 10 Facebook users say keeping up with friends, family is a reason they use the platform; far fewer cite news or politics

Facebook users are far more likely to cite relationships and entertainment as key reasons for using the site than news or politics.

Fully 93% of Facebook users say keeping up with friends and family is a reason why they use the site, including 75% who say this is a major factor.

Roughly three-quarters each say a reason they use Facebook is because it’s entertaining or that they do so to connect with others who share their interests.

Much smaller shares cite getting news (37%), product reviews or recommendations (37%), or keeping up with sports or pop culture (36%) as reasons for using Facebook.

Even fewer – about one quarter – say keeping up with politics or political issues motivates them to use the site.

Related: News as a reason people use Facebook

By party

The reasons people cite for using Facebook vary little by political party. For example, nearly identical shares of Republican (27%) and Democratic (28%) users cite keeping up with politics and political issues as a reason they use the site.

Seeing politics on Facebook

Several years ago, Facebook announced it would reduce the number of political posts users see in their feed. Still, about half of Facebook users (52%) say at least some of what they see on the platform is about politics or political issues.

A pie chart showing that Roughly half of Facebook users see at least some politics there

A slightly smaller share – 47% – say little to none of the content they see on Facebook is related to this.

By party

Similar shares of Republicans and Democrats who use Facebook encounter politics on the site. For example, 54% of Republican users say that at least some of what they see on Facebook is about politics or political issues, nearly identical to the 53% of Democrats who say the same.

Posting about politics on Facebook

While seeing political posts is relatively common on Facebook, posting it is not. Just 11% of Facebook users say they post or share at least some things about politics or political issues.

By contrast, about six-in-ten Facebook users say they post, but that little (15%) or none (43%) of it is about politics.

A pie chart showing that Few Facebook users post or share at least some political content

Three-in-ten don’t post or share anything on the site.

By party

Again, partisanship is not a big factor. Identical shares of Republicans and Democrats who use Facebook (12% each) report that they share at least some political content.

Why do people post about politics on Facebook?

For the 26% of Facebook users who post at least a little about politics, we wanted to understand what motivates them to do so. We asked this group about four specific reasons they might share politics-related content on Facebook.

A bar chart showing that More Facebook users say they post about politics because they feel they should than say they do so because politics belongs there

They are more likely to cite the platform as a welcoming environment for their views than as a place where politics belongs.

Among Facebook users who post about politics:

  • 63% say a reason they post about this is because they feel like it’s something they should do, including 25% who say this is a major factor.
  • More than half (58%) cite their views being welcome there as a factor. And 54% say it’s because they can make a difference there.
  • A smaller share – 40% – say they’re motivated to do this because politics belongs on the site.

By party

A dot plot showing that Democrats on Facebook are more likely than Republicans to say a major reason for posting about politics is because their views are welcome there

There are partisan differences in what motivates users to post about politics on Facebook. 

Democrats are more likely than Republicans to say a major reason why they do so is because they feel it’s something they should do (30% vs. 21%).

And larger shares of Democrats than Republicans cite their views being welcome on Facebook, the site being a place where they can make a difference, and it being a place for politics as reasons for posting about these issues.

Why don’t people post about politics on Facebook?

There are many reasons why someone may opt out of posting about politics on Facebook, but we focused on four distinct factors for this survey.

A bar chart showing that Two-thirds of Facebook users who don’t post about politics say it’s because it’s not the place for that

We found that a majority of these users say they don’t share political content on Facebook because they don’t think politics belongs there.

Among the 43% of Facebook users who post on the site, but never about politics:

  • 67% say a reason for not posting is because politics doesn’t belong on Facebook, with 45% saying this is a major reason.
  • About half say they opt not to post about politics because it won’t make a difference (52%), they don’t want to be criticized or harassed (48%) or they don’t care about politics (47%).

By party

A dot plot showing that Politics not belonging on Facebook is a key reason some users across parties – especially Republicans – don’t post about it

The primary reasons people don’t share about politics on Facebook vary little by party, but Republican users are more likely than Democrats to say that politics not belonging on Facebook is a major reason why they don’t post about this (49% vs. 42%).

Democrats are slightly more likely than Republicans to say a major reason they don’t post about these issues is because they don’t care about politics (25% vs. 21%).

Similar shares in both parties say they don’t post about politics on Facebook because they believe it won’t make a difference, or that they don’t want to face criticism or harassment.

How Facebook users see its climate and impact

Politics may not be the primary reason most people use Facebook, but its size and reach have made it a focal point for debates on social media’s impact on elections and partisan divides.

With that in mind, we wanted to explore its role in today’s political climate, including Americans’ views on its impact on democracy and freedom of expression.

Facebook and American democracy

A bar chart showing that Across parties, Facebook users hold largely similar views about its impact on American democracy

Americans have mixed views about Facebook’s impact on democracy. While more Facebook users say the site is mostly bad (31%) than mostly good (24%) for American democracy, the largest share – 43% – believe it has no impact. 

By party

Republicans and Democrats who use Facebook hold largely similar views about Facebook’s impact on democracy.

A third of Republican Facebook users think the site is mostly bad for American democracy, and a similar share of Democrats (30%) say so. Another 26% of Democratic users think it’s good for democracy, and 23% of Republicans say the same.

Identical shares across parties (42% each) think Facebook has no impact on democracy in this country.

Free expression on Facebook

A bar chart showing that Most users think people feel free to express political views on Facebook, but fewer Republicans say so

Facebook has faced criticism for what some see as stifling free speech, but we find that most users believe people can freely express their political opinion on the site.

Roughly seven-in-ten Facebook users (71%) believe people feel free to openly express their political views on Facebook, while 28% think people don’t feel free to do this.

By party

Majorities across parties think people feel free to share about politics on Facebook, but more Democrats (79%) than Republicans (63%) hold this view.

Republican users are, in turn, more likely than Democrats to say people don’t feel free to express their political thoughts on Facebook (35% vs. 20%).

Political content users see on Facebook

A bar chart showing that Republican Facebook users are far more likely to say the political content they see on the site leans liberal rather than conservative

There’s no strong consensus about whether the political content people see on Facebook leans to the right or the left. But Facebook users are more likely to say they see liberal-leaning posts.

Overall, 22% of Facebook users say they see posts about politics or political issues on the site that are mostly liberal, while 12% say these are mostly conservative. 

About half say the political posts they see on Facebook don’t lean liberal or conservative (24%) or that they’re unsure (29%).

By party

Republicans who use Facebook are more likely than their Democratic counterparts to say the political content they come across on the site is mostly liberal (29% vs. 16%).

By comparison, Democratic users are more likely than Republican users to say what they see about politics leans mostly conservative (16% vs. 10%).

Still, about three-in-ten users across parties are not sure how the content they see leans. Another 26% of Democrats say it doesn’t lean either way, and 23% of their Republican peers say the same.

Harassment on Facebook

A bar chart showing that Most Facebook users say harassment on the site is a problem; Democrats more likely to say it’s a major one

While online harassment can occur in many environments, our past research shows it’s more common on social media than on other online spaces. 

Our current survey finds that users widely believe Facebook has a harassment problem. Roughly eight-in-ten say people getting harassed on the site is a major (31%) or minor (50%) problem.

By party

Most Democrats and Republicans who use Facebook think people getting harassed on the platform is a problem.

But Democrats are more likely to consider it to be a problem, including 35% who say it’s a major one. By comparison, 26% of Republican users say harassment is a major problem on Facebook.

Republican users are instead more likely than Democrats to say harassment is not a problem on Facebook (22% vs. 12%).

4. How Instagram users view, experience the platform

Instagram has grown from a place where friends and family share photos to a destination for brands, memes and entertainment. It’s also a growing news source – especially for younger Americans. And it’s become a way for elected officials and activists to engage with the public.

But its connection with politics is evolving. Earlier this year, the company announced it would limit the political content it suggests to its users.

This chapter explores if and how Americans engage with political content on Instagram and what users think of its impact on politics. Here are some of the key findings:

  • Instagram is primarily a platform for entertainment and connecting – not politics. Just 26% of Instagram users say a reason they use the site is to keep up with politics and political issues. By comparison, about eight-in-ten users or more say they use the site because it’s entertaining (86%) or because they want to keep up with friends and family (83%).
  • Politics is not particularly prevalent on the site. About a third of users (36%) say at least some of what they see there is about politics or political issues. Another 38% see only a little and 26% see none at all.
  • Just over half of Instagram users (56%) think it has no impact on American democracy. Still, more believe it is mostly good (26%) than mostly bad (16%) for democracy.
  • When it comes to the political content encountered on Instagram, users are more likely to see liberal-leaning posts. About one-quarter of users report seeing mostly liberal political content, while only 7% report seeing mostly conservative content. Still, about four-in-ten do not perceive any ideological lean in the political content they encounter on Instagram (21%) or are unsure what they think (22%).

Why and how people use Instagram

Our survey explored the “why” and “what” behind how people use the platform.

Reasons for using Instagram

A bar chart showing that Entertainment, keeping up with friends and family are main reasons people use Instagram; relatively few say they use it for politics or news

From connection to having fun, there’s a wide range of reasons people might use Instagram. We asked about seven reasons in the survey.

Most Instagram users are there because it’s entertaining. Nearly nine-in-ten say that’s a reason they use it, including 56% who say it’s a major reason.

Connection is key. Most users also say keeping up with friends and family is a major (54%) or minor (29%) reason they use Instagram. And about three-quarters say a reason they’re on it is to connect with people who share their interests.

Relatively few say a reason they’re on it is to stay up to date with politics. About a quarter of Instagram users say keeping up with politics or political issues is a reason for using it.

Among the other reasons people use Instagram: Keeping up with sports or pop culture (52%), looking at product reviews and recommendations (44%) and getting news (33%).

Related: News as a reason people use Instagram

By party

Some of these reasons differ across political parties. For example, Democratic users are slightly more likely than Republican users to say keeping up with politics is a reason they use Instagram (29% vs. 24%). (Throughout this report, both groups include independents who lean toward each party.)

Seeing politics on Instagram

About a third of Instagram users say at least some of what they see there is about politics or political issues – including a mere 3% who say it’s all or most of what they see.

A pie chart showing that 36% of Instagram users see at least some political content on it

Another 38% say they see a little political content on the platform, and 26% say they see none at all.

By party

Similar shares of Republican (37%) and Democratic (35%) users say at least some of what they see on the platform is about politics.

Posting about politics on Instagram

Posting political content on Instagram is even less common for users than seeing it.

Just 8% of Instagram users say they post or share at least some content about politics or political issues there.

A pie chart showing that Few Instagram users post political content

Another 10% say they post a little political content there. But most Instagram users either say they don’t share anything about politics (41%) or don’t post on the platform at all (40%).

By party

Partisanship doesn’t play much of a role in who shares at least some political content: 7% of Republican users and 9% of Democratic users say they do this.

Why do people post about politics on Instagram?

We followed up with the 19% of Instagram users who say they post at least a little about politics to understand why they might do so. We asked them about four potential reasons and found that many feel they should post about politics – but fewer post about politics because they feel it belongs there.6

A bar chart showing that 7 in 10 Instagram users who post about politics say it’s because they feel they should do so

Among Instagram users who post about politics:

  • 70% say a reason is that they feel it’s something they should do, including 30% who say this is a major reason.
  • Similarly, about two-thirds each cite their views being welcome there (66%) or thinking they can make a difference there (64%) as reasons.
  • A smaller share of those who post about politics (45%) say it’s because politics belongs on Instagram.

Why don’t people post about politics on Instagram?

A bar chart showing that Majority of those who avoid posting politics on Instagram say it’s because it doesn’t belong there

We also asked the 41% of Instagram users who share things – but not anything political – on the site about four different reasons they might not do so. Many of them just don’t think politics belongs there.

Among Instagram users who post on the site, but never about politics:

  • 60% say a reason they don’t post is that politics doesn’t belong on Instagram. This includes 38% who say it’s a major reason.
  • Smaller shares say it’s because it won’t make a difference (48%), they don’t care about politics (45%) or they want to avoid criticism or harassment (44%).

By party

A dot plot showing that Republican Instagram users are more likely than Democratic users to say they don’t post about politics because it doesn’t belong there

Republican users are more likely than Democratic users to say a major reason they don’t post about politics on Instagram is because they think it doesn’t belong there (44% vs. 36%).

On the other reasons we asked about, though, there are no differences by party. For example, about a quarter each of Republicans and Democrats who don’t post political content on Instagram say avoiding criticism or harassment is a major reason.

How Instagram users see its climate and impact

While entertainment and relationships are the driving forces behind why people use Instagram, its connection to its parent company, Meta (which also owns Facebook), makes it a key player in broader discussions around political discourse on social media.

In addition to understanding how often people see or post content related to politics, we wanted to understand whether people who use Instagram think it impacts democracy. We also explored what users think about freedom of expression and harassment on the platform, and which way they think the political content they see leans.

Instagram and American democracy

A bar chart showing that The largest share of Instagram users think it has no impact on American democracy

When asked about Instagram’s impact on American democracy, by far, the largest share of users – 56% – think it doesn’t have an effect.

Much smaller shares believe it is mostly good (26%) or mostly bad (16%) for democracy.

By party

Views about Instagram’s impact on democracy vary little by party.

About one-in-five Republican users think the site is mostly bad for American democracy, while 15% of Democratic users say the same. And about a quarter in both parties think Instagram is good for democracy. 

Identical shares of users in both parties (56% each) think Instagram has no impact on democracy in this country.

Free expression on Instagram

A bar chart showing that Most Instagram users say people feel free to share their political views, but views still differ by party

Most Instagram users think people feel free to openly share their political beliefs on Instagram.

Three-quarters say people feel free to openly express their political views on the site. Fewer (23%) believe that people don’t feel free to do this.

By party

A majority of Democratic and Republican users think people feel free to share about politics on Instagram, but larger shares of Democrats than Republicans say this (82% vs. 69%).

Republican users, on the other hand, are more likely than their Democratic peers to say people don’t feel free to express their political thoughts on the platform (29% vs. 17%).

Political content users see on Instagram

A bar chart showing that Instagram users are more likely to say the political content they see leans liberal than conservative

In addition to understanding if people think users can freely express themselves on Instagram, we also asked if the politics they see on the site leans more conservative or liberal.

Instagram users have somewhat mixed views, with no answer receiving majority support. Still, users are more likely to say what they see about politics and political issues on Instagram leans mostly liberal rather than mostly conservative (23% vs. 7%).

There are also segments of users who either don’t think the politics they see has an ideological slant (21%) or are unsure if it does (22%).

By party

Democrats and Republicans are about equally likely to say the political content they see on Instagram leans liberal.

But Republican users are somewhat more likely than Democratic users to say what they see leans conservative (10% vs. 4%). On the other hand, Democratic users are more likely than their GOP peers to say there isn’t an ideological slant to what they come across on the site (24% vs. 18%).

Harassment on Instagram

A bar chart showing that Most Instagram users think harassment is a problem on the site, but Democrats are more likely to say this

In recent years, Instagram has taken steps to curb hate speech and online abuse on the site.

Even so, roughly seven-in-ten Instagram users say people getting harassed on the site is a problem, including 22% who consider it to be a major issue.

By party

Many Democrats and Republicans who use Instagram think harassment is a problem on the platform.

But Democrats are 14 percentage points more likely than Republicans to consider it to be a problem, with larger shares of Democrats (27%) than Republicans (17%) calling it a major one.

At the same time, larger shares of Republican than Democratic users don’t think harassment is a problem on Instagram (34% vs. 20%).

Appendix

Acknowledgments

This is a Pew Research Center report from the Pew-Knight Initiative, a research program funded jointly by The Pew Charitable Trusts and the John S. and James L. Knight Foundation. Find related reports online at https://alpha.pewresearch.org/pewresearch-org/pew-knight.

Primary researchers

Colleen McClain, Research Associate          
Monica Anderson, Director, Internet and Technology Research   
Risa Gelles-Watnick, Former Research Analyst      

Research team

Jeffrey Gottfried, Associate Director, Internet and Technology Research        
Michelle Faverio, Research Analyst
Eugenie Park, Research Assistant
Olivia Sidoti, Research Assistant

Editorial and graphic design

Kaitlyn Radde, Associate Information Graphics Designer
Rebecca Leppert, Copy Editor
Jenn Hatfield, Writer/Editor

Communications and web publishing

Haley Nolan, Communications Manager
Talia Price, Communications Associate
Sara Atske, Digital Producer

In addition, the project benefited greatly from the guidance of Pew Research Center’s methodology team: Courtney Kennedy, Ashley Amaya, Andrew Mercer, Dorene Asare-Marfo, Anna Brown, Arnold Lau and Dana Popky. This project also benefited from input by the following Center staff: Elisa Shearer, Katerina Eva Matsa, Michael Lipka, Naomi Forman-Katz, Jacob Liedke, Sarah Naseer, Aaron Smith and Jocelyn Kiley.

Methodology

The American Trends Panel survey methodology

Overview

The American Trends Panel (ATP), created by Pew Research Center, is a nationally representative panel of randomly selected U.S. adults. Panelists participate via self-administered web surveys. Panelists who do not have internet access at home are provided with a tablet and wireless internet connection. Interviews are conducted in both English and Spanish. The panel is being managed by Ipsos.

Data in this report is drawn from ATP Wave 144, conducted from March 18 to 24, 2024, among a sample of U.S adults who previously reported using the internet. It includes an oversample of non-Hispanic Asian adults, non-Hispanic Black men, and Hispanic men in order to provide more precise estimates of the opinions and experiences of these smaller demographic subgroups. These oversampled groups are weighted back to reflect their correct proportions in the population. A total of 10,287 panelists responded out of 11,152 who were sampled, for a response rate of 92%. The cumulative response rate accounting for nonresponse to the recruitment surveys and attrition is 3%. The break-off rate among panelists who logged on to the survey and completed at least one item is less than 1%.

In addition to the 10,287 internet users who completed the survey, the demographic and profile variables for all 167 active ATP members who do not use the internet were also included in the final dataset used in the analysis. This was done so that the dataset and survey weights would represent the population of all U.S. adults, and brings the size of the full analytic sample to 10,454.

The margin of sampling error for the full analytic sample of 10,454 cases is plus or minus 1.5 percentage points.

This is a Pew Research Center report from the Pew-Knight Initiative, a research program funded jointly by The Pew Charitable Trusts and the John S. and James L. Knight Foundation. Find related reports online at https://alpha.pewresearch.org/pewresearch-org/pew-knight/.

Panel recruitment

A table showing American Trends Panel recruitment surveys

The ATP was created in 2014, with the first cohort of panelists invited to join the panel at the end of a large, national, landline and cellphone random-digit-dial survey that was conducted in both English and Spanish. Two additional recruitments were conducted using the same method in 2015 and 2017, respectively. Across these three surveys, a total of 19,718 adults were invited to join the ATP, of whom 9,942 (50%) agreed to participate.

In August 2018, the ATP switched from telephone to address-based sampling (ABS) recruitment. A study cover letter and a pre-incentive are mailed to a stratified, random sample of households selected from the U.S. Postal Service’s Delivery Sequence File. This Postal Service file has been estimated to cover as much as 98% of the population, although some studies suggest that the coverage could be in the low 90% range.7 Within each sampled household, the adult with the next birthday is asked to participate. Other details of the ABS recruitment protocol have changed over time but are available upon request.8

We have recruited a national sample of U.S. adults to the ATP approximately once per year since 2014. In some years, the recruitment has included additional efforts (known as an “oversample”) to boost sample size with underrepresented groups. For example, Hispanic, Black and Asian adults were oversampled in 2019, 2022 and 2023, respectively.

Across the six address-based recruitments, a total of 23,862 adults were invited to join the ATP, of whom 20,917 agreed to join the panel and completed an initial profile survey. Of the 30,859 individuals who have ever joined the ATP, 11,907 remained active panelists and continued to receive survey invitations at the time this survey was conducted.

The American Trends Panel never uses breakout routers or chains that direct respondents to additional surveys.

Sample design

The overall target population for this survey was noninstitutionalized internet users ages 18 and older living in the U.S., including Alaska and Hawaii. It featured a stratified random sample from the ATP in which Hispanic men, non-Hispanic Black men and non-Hispanic Asian adults were selected with certainty. The remaining panelists were sampled at rates designed to ensure that the share of respondents in each stratum is proportional to its share of the U.S. adult population to the greatest extent possible. Respondent weights are adjusted to account for differential probabilities of selection as described in the Weighting section below.

Although non-internet users were not invited to participate in the survey, the demographic and profile variables for all active non-internet panelists were appended to those for the survey respondents. This was done so that the final analytic dataset would be representative of all noninstitutionalized U.S. adults, including those who do not use the internet.

Questionnaire development and testing

The questionnaire was developed by Pew Research Center in consultation with Ipsos. The web program was rigorously tested on both PC and mobile devices by the Ipsos project management team and Pew Research Center researchers. The Ipsos project management team also populated test data that was analyzed in SPSS to ensure the logic and randomizations were working as intended before launching the survey.

Incentives

All respondents were offered a post-paid incentive for their participation. Respondents could choose to receive the post-paid incentive in the form of a check or a gift code to Amazon.com or could choose to decline the incentive. Incentive amounts ranged from $5 to $20 depending on whether the respondent belongs to a part of the population that is harder or easier to reach. Differential incentive amounts were designed to increase panel survey participation among groups that traditionally have low survey response propensities.

Data collection protocol

The data collection field period for this survey was March 18 to 24, 2024. Postcard notifications were mailed to a subset of ATP panelists with a known residential address on March 18.9

Invitations were sent out in two separate launches: soft launch and full launch. Sixty panelists were included in the soft launch, which began with an initial invitation sent on March 18. The ATP panelists chosen for the initial soft launch were known responders who had completed previous ATP surveys within one day of receiving their invitation. All remaining English- and Spanish-speaking sampled panelists were included in the full launch and were sent an invitation on March 19.

All panelists with an email address received an email invitation and up to two email reminders if they did not respond to the survey. All ATP panelists who consented to SMS messages received an SMS invitation and up to two SMS reminders.

A table showing Invitation and reminder dates, ATP Wave 144

Data quality checks

To ensure high-quality data, the Center’s researchers performed data quality checks to identify any respondents showing clear patterns of satisficing. This includes checking for whether respondents left questions blank at very high rates or always selected the first or last answer presented. As a result of this checking, no ATP respondents were removed from the survey dataset prior to weighting and analysis.

Weighting

A table showing American Trends Panel weighting dimensions

The ATP data is weighted in a multistep process that accounts for multiple stages of sampling and nonresponse that occur at different points in the survey process. First, each panelist begins with a base weight that reflects their probability of selection for their initial recruitment survey. These weights are then rescaled and adjusted to account for changes in the design of ATP recruitment surveys from year to year. Finally, the weights are calibrated to align with the population benchmarks in the accompanying table to correct for nonresponse to recruitment surveys and panel attrition. If only a subsample of panelists was invited to participate in the wave, this weight is adjusted to account for any differential probabilities of selection.

Among the panelists in the final analytic dataset (comprised of internet users who completed the survey and non-internet users who were not sampled), this weight is then calibrated again to align with the population benchmarks identified in the accompanying table and trimmed at the 2nd and 98th percentiles to reduce the loss in precision stemming from variance in the weights. This trimming is performed separately among non-Hispanic Black, non-Hispanic Asian, Hispanic and all other respondents.

In this wave, panelists who reported using all four social media platforms (Facebook, Instagram, TikTok and X/Twitter) were randomly assigned to be asked about either Facebook or Instagram but not both. For the analysis of these questions, the weights for these respondents were further adjusted to account for their probability of having been assigned to the platform that they were asked about.

Sampling errors and tests of statistical significance take into account the effect of weighting.

The following table shows the unweighted sample sizes and the error attributable to sampling that would be expected at the 95% level of confidence for different groups in the survey.

A table showing Sample sizes and margins of error, ATP Wave 144

Sample sizes and sampling errors for other subgroups are available upon request. In addition to sampling error, one should bear in mind that question wording and practical difficulties in conducting surveys can introduce error or bias into the findings of opinion polls.

Dispositions and response rates

A table showing Final dispositions, ATP Wave 144
A table showing Cumulative response rate as of ATP Wave 144


© Pew Research Center 2024