The Behaviors and Attitudes of U.S. Adults on Twitter
A minority of Twitter users produce a majority of tweets from U.S. adults, and the most active tweeters are less likely to view the tone or civility of discussions as a major problem on the site<br>
BYColleen McClain, Regina Widjaya, Gonzalo Rivero and Aaron Smith
About Pew Research Center
Pew Research Center is a nonpartisan, nonadvocacy fact tank that informs the public about the issues, attitudes and trends shaping the world. It does not take policy positions. The Center conducts public opinion polling, demographic research, computational social science research and other data-driven research. It studies politics and policy; news habits and media; the internet and technology; religion; race and ethnicity; international affairs; social, demographic and economic trends; science; research methodology and data science; and immigration and migration. Pew Research Center is a subsidiary of The Pew Charitable Trusts, its primary funder.
The Behaviors and Attitudes of U.S. Adults on Twitter
A minority of Twitter users produce a majority of tweets from U.S. adults, and the most active tweeters are less likely to view the tone or civility of discussions as a major problem on the site<br>
How we did this
Pew Research Center conducted this study to gain insight into Twitter users’ views, attitudes and behaviors on the site, and how those opinions might vary based on their tweeting activity. For this analysis, we surveyed 2,548 U.S. adult Twitter users in May 2021. Everyone who took part in this survey is a member of the Center’s American Trends Panel (ATP) – an online survey panel that is recruited through national, random sampling of residential addresses – and indicated that they use Twitter. The survey also included 1,026 respondents who volunteered a valid Twitter handle (their unique user name preceded by an “@” sign) for research purposes. This allowed the Center to analyze their responses to the survey based on their actual (observed) behaviors on the platform.
Pew Research Center recently conducted an in-depth survey of U.S. adults who use Twitter, looking to better understand their behaviors and experiences on the site along with their attitudes towards the service. The survey included a subset of respondents who shared their Twitter profiles for research purposes, allowing their survey responses to be matched to their actual Twitter activity.
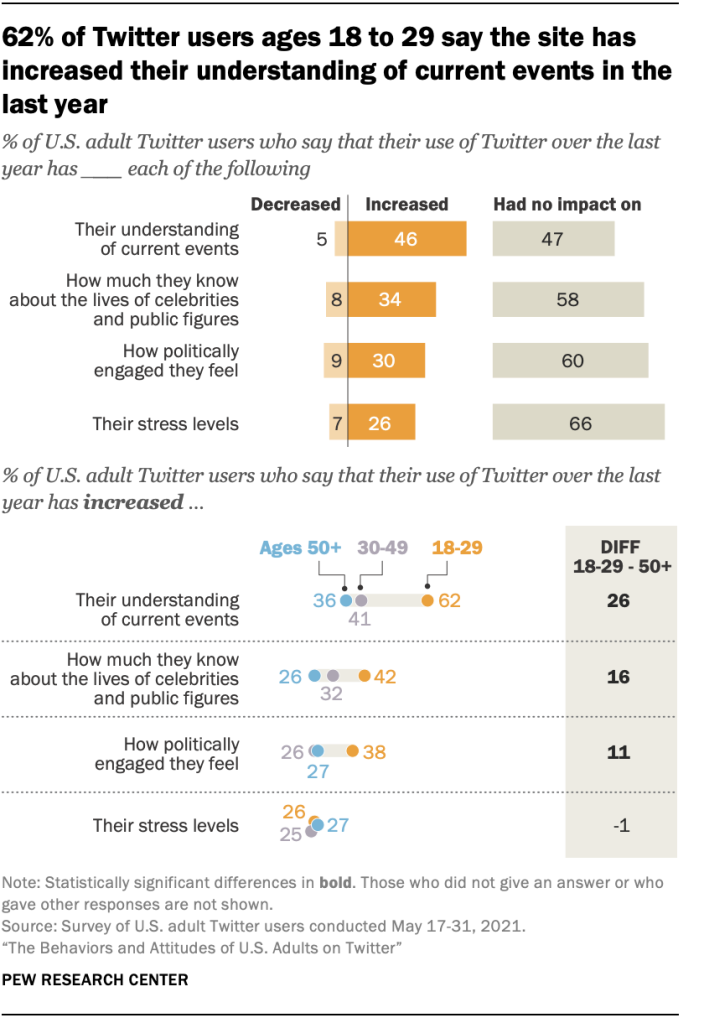
As in many of the Center’s surveys of technology and online platforms, this study finds that Twitter users report a mix of both positive and negative experiences on the site. For instance, 46% of these users say the site has increased their understanding of current events in the last year, and 30% say it has made them feel more politically engaged. On the other hand, 33% of users report seeing a lot of misleading or inaccurate information there, and 53% say inaccurate or misleading information is a major problem on the site.
The analysis also reveals another familiar pattern on social media: that a relatively small share of highly active users produce the vast majority of content. An analysis of tweets by this representative sample of U.S. adult Twitter users from June 12 to Sept. 12, 2021, finds that the most active 25% of U.S. adults on Twitter by tweet volume produced 97% of all tweets from these users.
High-volume tweeters differ from less prolific tweeters in important ways. A majority visit the site daily, and roughly one-in-five say they do so too many times to count on a typical day. Their use of Twitter also carries a more overtly political valence: They are more likely than others to say the site has increased how politically engaged they feel in the past year.
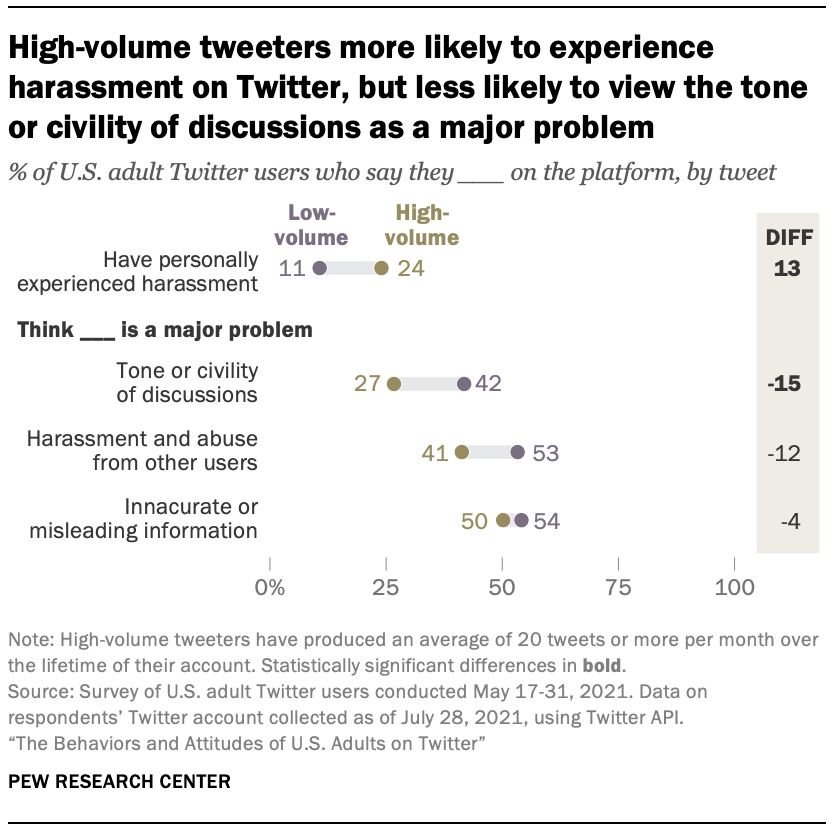
They also respond differently to the presence of certain negative interactions on the platform. High-volume tweeters are roughly twice as likely as others to say they have personally experienced harassing or abusive behavior on the platform (24%, vs. 11% of less active tweeters). But they are less likely to view the overall tone or civility of discussions on the site as a major problem (by a margin of 27% to 42%).
Among the other key findings of this research:
Although they produce the vast majority of content, highly active tweeters produce relatively few original tweets and receive little engagement from the broader Twitter audience. From June 12 to Sept. 12, 2021, original posts comprised just 14% of tweets from the top quarter of U.S. adults on Twitter by tweet volume. The vast majority of posts produced by this group were either retweets (49% of the total) or replies to other users (33%).
Posts from this group also receive little engagement from other users in the form of likes or retweets. Despite producing 65 tweets of any type per month on average during the period under observation, U.S. adults in the top 25% of users based on tweet volume received an average of just 37 likes and one retweet per month.
Democrats and Republicans on Twitter differ in their views of the major problems on the site and its overall impact on democracy. Nearly identical shares of Twitter users say the site is mostly good (37%) or mostly bad (38%) for American democracy, with 24% saying it has no impact either way. But Republican Twitter users (including Republican-leaning independents) are roughly twice as likely as Democrats and Democratic leaners to say the site is bad for American democracy (60% vs. 28%). Conversely, roughly half of Democrats who use the site say it is good for American democracy – just 17% of Republican users say the same.
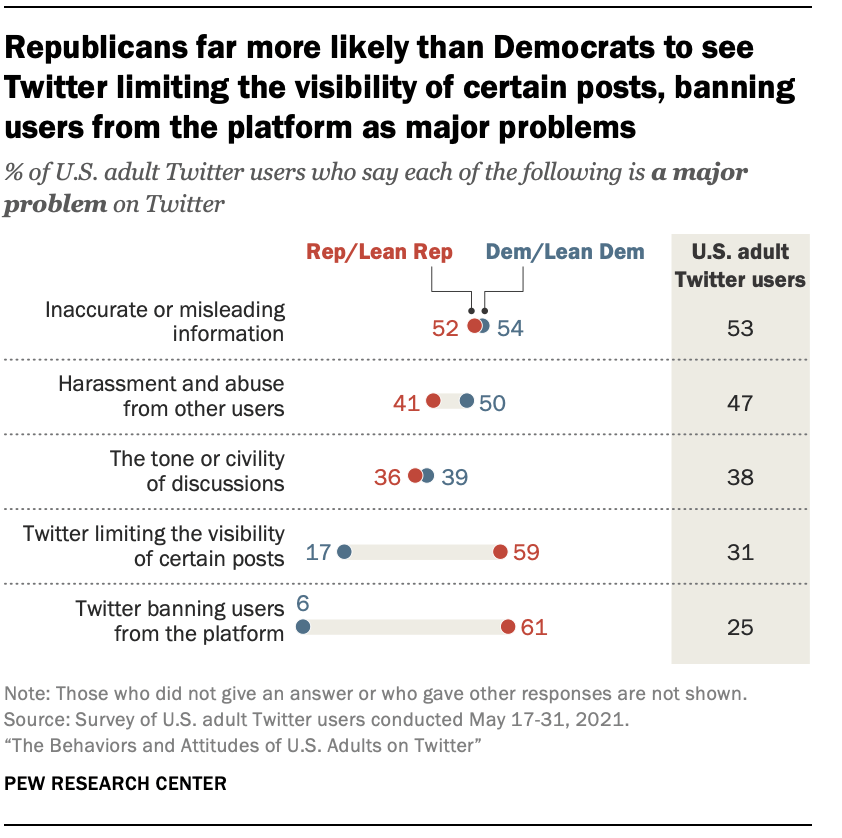
Meanwhile, similar shares of Democratic and Republican users say that issues such as the tone or civility of conversations on the site or the presence of inaccurate or misleading information are major problems. But Republican users are far more likely to say it is a major problem that Twitter limits the reach or visibility of certain posts (59% vs. 17%) or bans users from the platform (61% vs. 6%).
A majority of Twitter users – even those who say they have private profiles or are not sure of their privacy settings – have a public profile that is visible to anyone. Overall, 53% of Twitter users – and 65% of users who provided a handle that allowed the Center to verify their actual profile settings – say their profile is set to public, so that anyone can see it.
But an examination of the profiles of those users who provided a handle reveals that 89% of them are actually set to public. Among users who say their account is private or are not sure of their settings, 83% in reality have a public profile.
1. The views and experiences of U.S. adult Twitter users
U.S. adults on Twitter visit the site with varying degrees of intensity. In all, two-thirds (66%) of Twitter users say they visit the site at least once a week, and the remaining third say they do so less often. And a share of users – 10% of the total – are far more regular visitors, saying they use the site so frequently that they cannot count the number of times in a typical day.
One-in-five adult Twitter users under age 30 say they visit the site daily, too many times to count. And along with younger users, some 16% of liberal Democratic users visit the site this frequently. Smaller shares of more moderate Democrats – and of Republicans of any ideology – say the same. (Throughout this report, partisans include those who lean toward both parties.)
Largest shares of users cite entertainment, staying informed as most important reasons for using Twitter
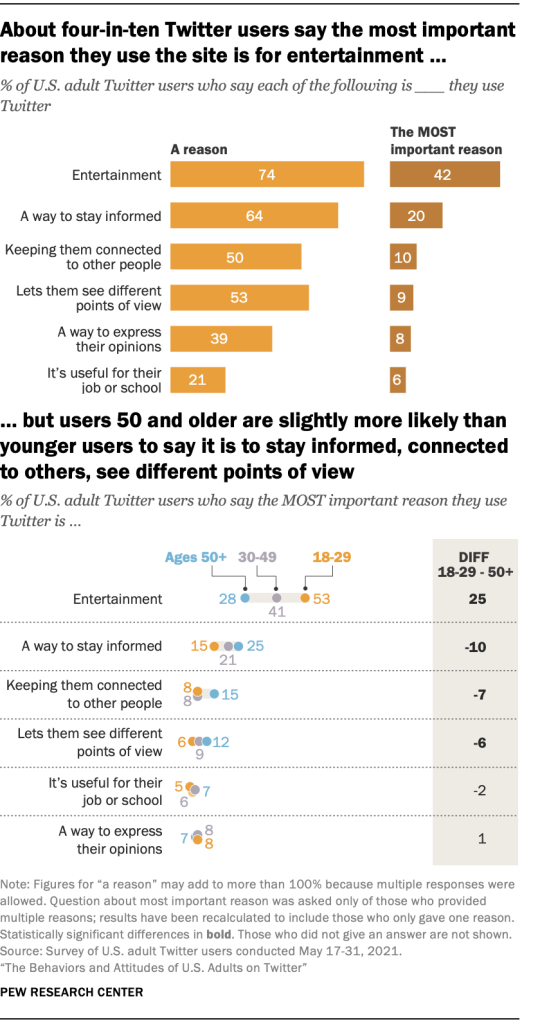
When asked about several specific reasons for using Twitter – as well as the one that was most important if they listed several reasons – the largest share of users (42%) report entertainment as the most important. This is about twice as high as the share (20%) who say staying informed is the most important reason. Smaller shares say the most important reason is to stay connected to other people, see different points of view, express their opinions, or because the site is useful for work or school.
These most important reasons vary by age. Twitter users ages 18 to 29 are far more likely to say that entertainment is their most important reason (53%) compared with older Twitter users – a 12 percentage point difference with those ages 30 to 49 and a 25-point difference with those 50 and older. Meanwhile, users 50 and older are slightly more likely than users 18 to 29 to say it’s that the site is a way to stay informed, keep themselves connected to other people or let them see different points of view – although differences are less pronounced.
The survey also finds that, for a majority of users, Twitter serves mostly as a way to see what others are saying rather than primarily serving as a means of expression.
When asked a separate question about which of these two factors is more of a reason they use the site, about two-thirds of Twitter users (64%) say they mostly use it to see what others are saying. Just 7% say they mostly use it to express their own opinions, while another 28% say it’s an equal mix of both.
46% of users say their Twitter use has increased their understanding of current events in the last year, but 26% say the same about their stress levels
Center research has long studied the impact of Twitter and other social media platforms on the state of the country overall, particularly as it relates to groups of Americans and the information environment. This survey focused on the impact of the site on the individual user over the past year in four areas.
While about half or more adult Twitter users say their use of the site in the past year had no impact on their understanding of current events, how much they know about the lives of celebrities and public figures, how politically engaged they feel, or their stress levels, some users report an increase or decrease in these four areas.
Nearly half of U.S. adult Twitter users say their use of the site has increased their understanding of current events over the past year, but 47% say it has had no impact. Meanwhile, 34% say the site has increased how much they know about the lives of celebrities and public figures (with 58% reporting no impact). Small shares say Twitter has decreased their understanding in both these areas.
Three-in-ten Twitter users (30%) say their use of the site has increased how politically engaged they feel, while 9% say it has decreased this and 60% say it has had no impact. And about a quarter of Twitter users say the site has increased their stress levels.
Twitter users ages 18 to 29 are more likely than those ages 30 to 49 or 50 and older to report their use of Twitter has increased their understanding of current events, the lives of public figures and their overall levels of political engagement. Indeed, larger shares of those ages 18 to 29 report any impact on their political engagement, whether that impact is positive or negative. This group is twice as likely as older users to say it has decreased how politically engaged they feel (although just 14% of younger Twitter users indicate this).
And while there are no age differences in the shares of those who say Twitter has increased their stress levels, 11% of adult Twitter users under 30 say their use has decreased their stress levels over the past year, compared with smaller shares of their older counterparts.
Democratic Twitter users are also more likely than Republican Twitter users to say their understanding of current events (by a 53% to 36% margin) and feelings of political engagement (35% to 22%) have increased in the last year due to their use of Twitter.
17% of users have experienced harassing or abusive behavior on Twitter, 33% say they see a lot of inaccurate or misleading information
The majority of Twitter users have not experienced harassing or abusing behavior on the site, but 17% of adult Twitter users say this has happened to them personally. There is little difference in the shares of users who say they have experienced this based on age, gender, educational attainment or political identification.
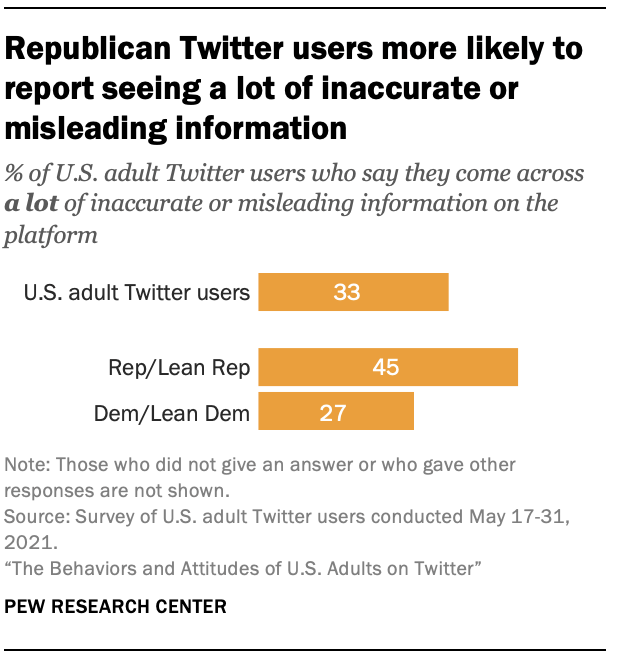
On the other hand, the vast majority of Twitter users (91%) say they come across at least some inaccurate or misleading information on the platform. And 33% say they come across a lot of this sort of content.
Republican Twitter users are more likely to say they come across a lot of this information than Democrats – an 18-point difference between the parties.
Republicans and Democrats differ in their views of whether Twitter is good or bad for American democracy, what the major problems are on the site
Overall, Twitter users are divided on the site’s impact on American democracy. Some 37% think its impact has been mostly good, but a nearly identical share (38%) say it has been mostly bad. The remaining 24% say it has had no impact on American democracy.
But these attitudes differ significantly based on political affiliation. About half of Democratic Twitter users (47%) say the site has had a mostly good impact, while 28% say that impact has been mostly bad. But among Republican users, fully 60% say the site has been mostly bad for American democracy and just 17% say its impact has been mostly good.
When asked about their views on some challenges and controversies facing Twitter and other social media platforms, around half of Twitter users say the presence of inaccurate or misleading information (53%) and harassment and abuse from other users (47%) are major problems on the site. And 38% say the same about the tone or civility of the discussions there. Smaller shares say that Twitter limiting the visibility of certain posts (31%) or banning users from the platform (25%) are major problems.
Republican users are far more likely to say that Twitter banning users from the platform or limiting the visibility of certain posts is a major problem. By contrast, Democrats are more likely than Republicans to see harassing or abusive behavior as a major problem on the site. Partisan views are similar when it comes to how large a problem inaccurate information and the tone or civility of discussions are.
Around one-in-five Twitter users think nobody sees their tweets, but about half consider how their activity on the site might portray them before doing something visible to others
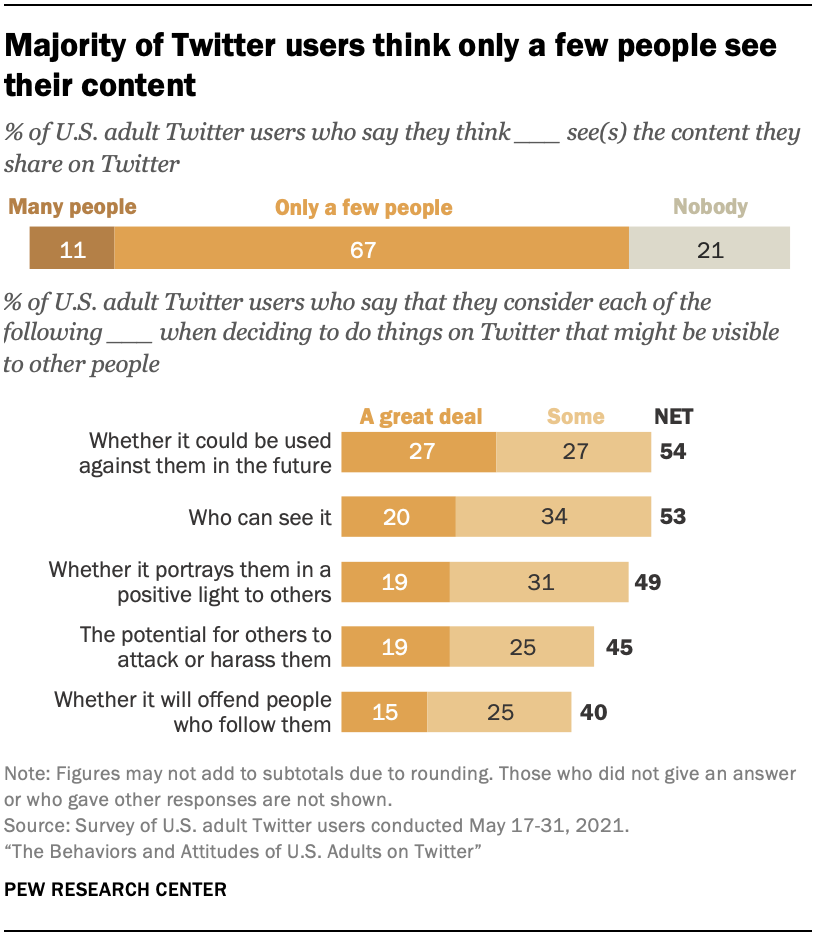
Most users assume their tweets have a very limited audience. Regardless of how often they tweet, roughly two-thirds of Twitter users think only a few people would see content they might share on the site. And about one-in-five Twitter users say they think nobody would see it.
Despite largely assuming a limited audience for their tweets, more than half of Twitter users consider whether the content they post publicly on Twitter could be used against them in the future before doing something that might be visible to other people on the site. And comparable shares consider who can see these things, or whether that activity portrays them in a positive light to others. This includes 27%, 20% and 19%, respectively, who say they consider each a great deal. Some 45% of users also consider the potential for others to attack or harass them a great deal (19%) or some (25%). And 40% say the same about whether it will offend people who follow them (including 15% who consider this a great deal).
For some users, these concerns are not just hypothetical. About one-in-five Twitter users (21%) have posted something on the site that they later regretted sharing. And this is true of a larger share – 31% – of users ages 18 to 29 compared with older Twitter users. Men are somewhat more likely to say they have experienced this than women (24% vs. 17%), as are Democrats compared with Republicans (23% vs. 16%).
Majority of users like others’ tweets rarely or on occasion, typically do so to show support or agreement
A relatively small share of Twitter users (16%) say they almost always like other users’ tweets when they use the platform, while the bulk of users do so only occasionally or rarely. Among the 87% of Twitter users who say they ever “like” tweets on the site, about two-thirds (67%) say they mainly do so to show their support or agreement rather than bookmarking the tweet (10%) or boosting its visibility (9%). And 12% of these users say there’s no particular reason they like tweets.
2. Comparing highly active and less active tweeters
In addition to surveying respondents who use Twitter about their experiences on the site, Pew Research Center also asked those Twitter users if they would be willing to share their handles for research purposes. In total, 1,026 respondents shared a valid Twitter handle. All of these accounts – regardless of their privacy settings – contained basic account metadata, such as the age of the account and total number of tweets during its existence.
Additionally, a subset of these accounts (n=917) were set to public – meaning their account activity was visible to anyone visiting their profile – over the time period of June 12 to Sept. 12, 2021. For these accounts, researchers were able to examine any tweets they might have posted in more granular detail over that time period and collect data about the content of the tweets themselves – such as how many likes and retweets each tweet received from other users.
A minority of users produce the majority of tweets from U.S. adults
As was true in the Center’s previous research on Twitter users, a minority of extremely active tweeters produced the overwhelming majority of all tweets made by U.S. adults between June 12 and Sept. 12, 2021. During this period, the top 25% of users by tweet volume produced 97% of all tweets (which includes original tweets as well as retweets, replies and quote tweets).
By definition, the most active tweeters produce far more tweets than other users – many of whom tweet infrequently, if ever. During the study period, this group produced a median of 65 tweets per month on average, compared with a median of no tweets per month from users in the bottom 75%. But these top tweeters also follow nearly four times as many accounts (469 vs. 125) and have substantially more followers (230 vs. 29) compared to the less active group.
Even so, these highly active tweeters typically receive modest engagement from the rest of the Twitter audience. In a typical month, the posts produced by high-volume tweeters would collectively receive an average of 37 likes and one retweet.
Although the top 25% of users produced the overwhelming majority of tweets within the study period, original tweets made up just 14% of their posts. By contrast, roughly 80% of tweets from this group are either direct retweets (49%) or replies to other tweets (33%). Replies and retweets similarly make up the majority of posts from less active tweeters as well.
Prolific tweeters differ substantially from other users in their self-described behaviors and attitudes toward the site
In addition to examining the on-site behaviors of users with public accounts over a three-month time period in 2021, the study also grouped users into high- and low-volume tweeter categories based on all users (those with public and private accounts alike) and the number of tweets they have produced over the life of their accounts. For the analysis that follows, high- and low-volume tweeters are defined based on this metric. High-volume tweeters are those who have produced 20 or more tweets per month over the life of their account, while low-volume tweeters have produced fewer than 20 tweets per month on average. 1
High- and low-volume tweeters tend to look relatively similar in terms of their basic demographic and attitudinal characteristics. Age is the primary distinguishing characteristic between these two groups. Twitter users in general tend to be younger and contain a larger share of Democrats and Democratic-leaning independents relative to nonusers. Among U.S. adults who use Twitter, high-volume tweeters tend to contain a larger share of 18- to 29-year-olds (44% are in this age group, compared with 20% of low-volume tweeters) and a lower share of those ages 30 to 49 (28% vs. 54%).
High-volume tweeters also tend to be much more intensive users of the site in general. They are roughly twice as likely to say they use the platform every day compared with their less prolific counterparts (58% vs 28% of low-volume tweeters). And around one-in-five (21%) say they access Twitter “too many times to count” in a day.
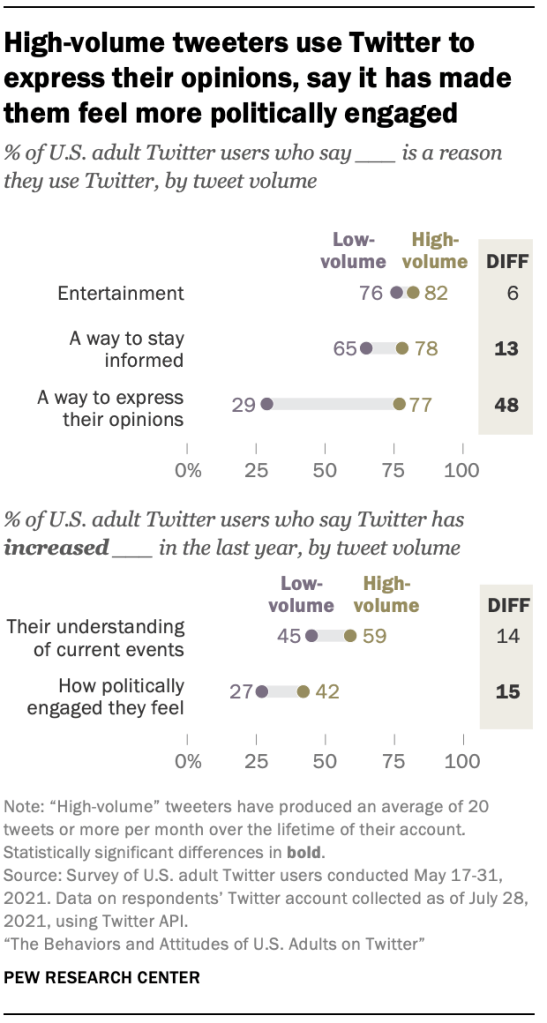
Echoing the findings in Chapter 1, a majority of U.S. adults who provided a valid Twitter handle say entertainment (78%) and staying informed (69%) are reasons why they use the site, while just under half (45%) say they use the platform as a way to express their opinion. High-volume tweeters are much more likely say they use Twitter to express their opinions: 77% of them do so, compared with 29% of lower-volume users.
Even so, only around one-in-five (17%) of these highly prolific tweeters say that expressing their opinion is their main reason for using the site. An identical share (17%) say they are primarily motivated by a desire to stay informed, while 47% say they are primarily motivated by entertainment.
Some 42% of high-volume tweeters say that Twitter has made them feel more politically engaged in the last year, significantly larger than the share of less prolific tweeters who say the same (27%). And about six-in-ten say the platform has increased their understanding of current events.
Meanwhile, high-volume tweeters are roughly twice as likely as other users to say they have personally experienced online harassment or abuse while on the site (24% vs. 11%). But they are less likely to view the tone or civility of discussions on the site as a major problem when compared with low-volume tweeters. By contrast, nearly identical shares of high- and low-volume tweeters feel that inaccurate and misleading information is a major problem on the site.
Many users are unsure or incorrect about their Twitter privacy settings
Among all U.S. adults on Twitter, roughly half say that their Twitter account is set to public so that anyone can see their tweets. Another 29% say it is set to private so only people who follow them can see their tweets, and 17% say they’re not sure what their privacy settings are. Among users who volunteered their profiles for research purposes, 65% say their account is public, 19% say their account is private and the remaining 17% say they’re not sure.
But in actuality, a direct examination of the privacy settings of these users’ accounts reveals that the vast majority (89%) of U.S. adults on Twitter have public accounts that are visible to anyone visiting the site. Put differently, 83% of Twitter users who say their accounts are private or who are not sure of their privacy settings actually have public accounts.
Acknowledgments
This report is a collaborative effort based on the input and analysis of the following individuals.
Research Team
Colleen McClain, Research Associate Regina Widjaya, Computational Social Scientist Gonzalo Rivero, Associate Director, Data Labs Aaron Smith, Director, Data Labs
Ashley Amaya, Senior Survey Methodologist Nick Bertoni, Senior Panel Manager Brian Broderick, Data Science Engineer Athena Chapekis, Data Science Assistant Andrew Grant, Communications Associate Arnold Lau, Research Methodologist Andrew Mercer, Senior Research Methodologist Travis Mitchell, Copy Editor, Digital Producer Meltem Odabaş, Computational Social Scientist Emma Remy, Data Science Analyst Alissa Scheller, Information Graphics Designer Rachel Weisel, Senior Communications Manager
Methodology
The American Trends Panel survey methodology
Overview
The American Trends Panel (ATP), created by Pew Research Center, is a nationally representative panel of randomly selected U.S. adults. Panelists participate via self-administered web surveys. Panelists who do not have internet access at home are provided with a tablet and wireless internet connection. Interviews are conducted in both English and Spanish. The panel is being managed by Ipsos.
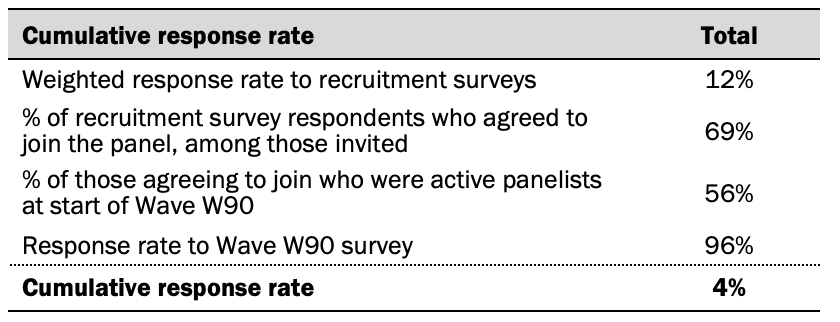
Data in this report is drawn from the panel wave conducted May 17 to May 31, 2021. The sample is comprised of panelists who indicated that they use Twitter on the Wave 85 survey conducted on the ATP in March 2021. A total of 2,548 panelists responded out of 2,643 who were sampled, for a response rate of 96%. The cumulative response rate accounting for nonresponse to the recruitment surveys and attrition is 4%. The break-off rate among panelists who logged on to the survey and completed at least one item is less than 1%. The margin of sampling error for the full sample of 2,548 respondents is plus or minus 3.4 percentage points.
Panel recruitment
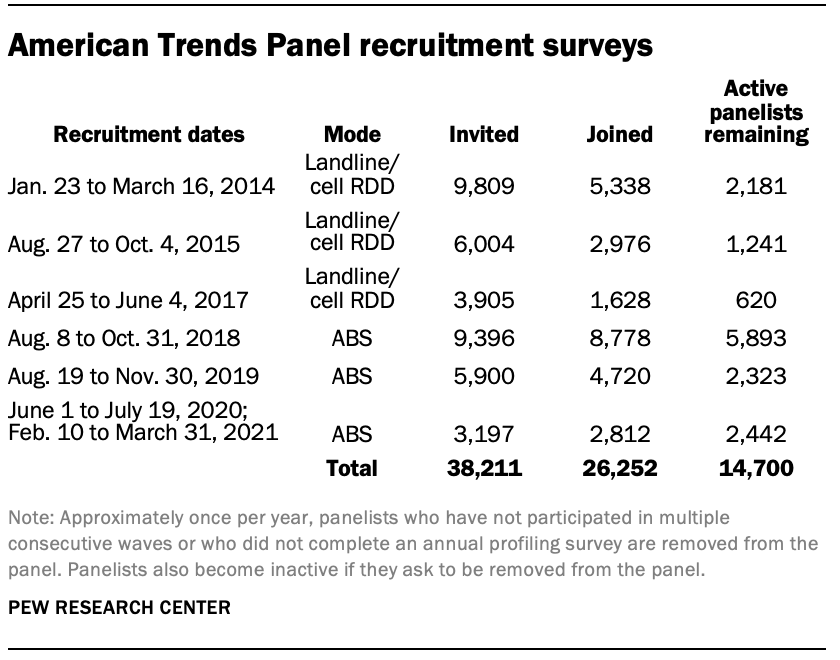
The ATP was created in 2014, with the first cohort of panelists invited to join the panel at the end of a large, national, landline and cellphone random-digit-dial survey that was conducted in both English and Spanish. Two additional recruitments were conducted using the same method in 2015 and 2017, respectively. Across these three surveys, a total of 19,718 adults were invited to join the ATP, of whom 9,942 (50%) agreed to participate.
In August 2018, the ATP switched from telephone to address-based recruitment. Invitations were sent to a random, address-based sample of households selected from the U.S. Postal Service’s Delivery Sequence File. Two additional recruitments were conducted using the same method in 2019 and 2020, respectively. Across these three address-based recruitments, a total of 18,493 adults were invited to join the ATP, of whom 16,310 (88%) agreed to join the panel and completed an initial profile survey. In each household, the adult with the next birthday was asked to go online to complete a survey, at the end of which they were invited to join the panel. Of the 26,252 individuals who have ever joined the ATP, 14,700 remained active panelists and continued to receive survey invitations at the time this survey was conducted.
The U.S. Postal Service’s Delivery Sequence File has been estimated to cover as much as 98% of the population, although some studies suggest that the coverage could be in the low 90% range.2 The American Trends Panel never uses breakout routers or chains that direct respondents to additional surveys.
Sample design
The overall target population for this survey was Twitter users ages 18 and older, living in the U.S., including Alaska and Hawaii. The sample consisted of 2,643 panelists who indicated that they use Twitter on the Wave 85 survey conducted on the ATP in March 2021.
The questionnaire was developed by Pew Research Center in consultation with Ipsos. The web program was rigorously tested on both PC and mobile devices by the Ipsos project management team and Pew Research Center researchers. The Ipsos project management team also populated test data which was analyzed in SPSS to ensure the logic and randomizations were working as intended before launching the survey.
Incentives
All respondents were offered a post-paid incentive for their participation. Respondents could choose to receive the post-paid incentive in the form of a check or a gift code to Amazon.com or could choose to decline the incentive. Incentive amounts ranged from $5 to $20 depending on whether the respondent belongs to a part of the population that is harder or easier to reach. Differential incentive amounts were designed to increase panel survey participation among groups that traditionally have low survey response propensities.
Data collection protocol
The data collection field period for this survey was May 17 to May 31, 2021. Postcard notifications were mailed to all ATP panelists with a known residential address on May 17, 2021.
Invitations were sent out in two separate launches: Soft launch and full launch. Sixty panelists were included in the soft launch, which began with an initial invitation sent on May 17, 2021. The ATP panelists chosen for the initial soft launch were known responders who had completed previous ATP surveys within one day of receiving their invitation. All remaining English- and Spanish-speaking panelists were included in the full launch and were sent an invitation on May 18, 2021.
All panelists with an email address received an email invitation and up to four email reminders if they did not respond to the survey. All ATP panelists that consented to SMS messages received an SMS invitation and up to four SMS reminders.
Data quality checks
To ensure high-quality data, the Center’s researchers performed data quality checks to identify any respondents showing clear patterns of satisficing. This includes checking for very high rates of leaving questions blank, as well as always selecting the first or last answer presented. As a result of this checking, 1 ATP respondent was removed from the survey dataset prior to weighting and analysis.
Weighting
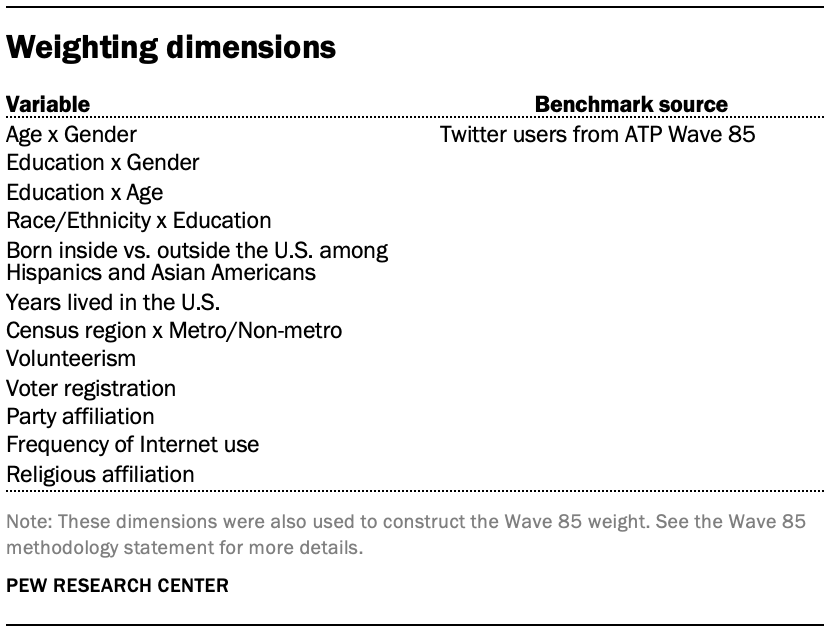
The ATP data was weighted in a multistep process that accounts for multiple stages of sampling and nonresponse that occur at different points in the survey process. First, each panelist begins with a base weight that reflects their probability of selection for their initial recruitment survey (and the probability of being invited to participate in the panel in cases where only a subsample of respondents were invited). The base weights for panelists recruited in different years are scaled to be proportionate to the effective sample size for all active panelists in their cohort. To correct for nonresponse to the initial recruitment surveys and gradual panel attrition, the base weights for all active panelists are calibrated to align with the population benchmarks identified in the accompanying table to create a full-panel weight.
For ATP waves in which only a subsample of panelists are invited to participate, a wave-specific base weight is created by adjusting the full-panel weights for subsampled panelists to account for any differential probabilities of selection for the particular panel wave. For waves in which all active panelists are invited to participate, the wave-specific base weight is identical to the full-panel weight.
In the final weighting step, the wave-specific base weights for panelists who completed the survey are again calibrated to match the population benchmarks specified above. These weights are trimmed (typically at about the 1st and 99th percentiles) to reduce the loss in precision stemming from variance in the weights. Sampling errors and test of statistical significance take into account the effect of weighting.
For this wave, the sample was weighted to align with benchmarks that were estimated among all Twitter users who responded to Wave 85.
The following table shows the unweighted sample sizes and the error attributable to sampling that would be expected at the 95% level of confidence for different groups in the survey.
Sample sizes and sampling errors for other subgroups are available upon request. In addition to sampling error, one should bear in mind that question wording and practical difficulties in conducting surveys can introduce error or bias into the findings of opinion polls.
Dispositions and response rates
Analysis of Twitter behavioral data
The analysis of Twitter users’ behaviors and activities on the site is based on a subsample of 1,026 respondents to the main survey who had previously agreed to share their Twitter handle for research purposes and provided a valid handle. Researchers from the Center used these handles to collect information about their on-site behaviors using the Twitter API.
The handles for these respondents were initially collected in a previous wave of the ATP fielded March 8 to March 14, 2021. These respondents were then included in the subsequent survey of all Twitter users that the main analysis in this report is based on.
Of the 2,548 adults who completed this survey, 1,099 (43%) had previously agreed to provide their Twitter handle. After the survey was fielded, researchers reviewed each account individually and removed any accounts that were suspended, invalid, or that belonged to institutions, products or international entities. The analysis of Twitter behavioral data in this report is based on the 1,026 respondents who both completed the survey and provided a valid, active handle.
This final sample of 1,026 U.S. adult Twitter users with valid, active handles was weighted using an iterative technique that matches gender, age, race, place of birth among Hispanics and Asian Americans, years lived in the U.S., education, region, party identification, volunteerism, voter registration, and metropolitan area to American Trends Panel March 2021 (Wave 85) survey respondents who indicated in that survey that they use Twitter. The margin of error for the full sample is plus or minus 6 percentage points.
How this report defines the highly active Twitter users and high-volume tweeters
This report uses two different analytic approaches to evaluate the behaviors and attitudes of Twitter users based on tweet volume.
The findings in this report that examine on-site behaviors – such as the share of tweets produced by different proportions of users, or the number of followers people have on the site – are based on tweets produced by respondents with public accounts during the time period of June 12, 2021, to Sept. 12, 2021. These users are grouped into categories based on the average number of tweets they produced each month over the three-month tweet collection period.
Findings in which respondents’ activities on Twitter are matched directly with their survey responses are based on Twitter account metadata obtained through the Twitter API. For any valid account (including those set to private) the Twitter API provides basic summary information such as the age of the account and total number of tweets over the life of the account. Researchers used these metadata figures to categorize respondents based on the average number of tweets per month they have produced over the total amount of time their account has been active.
Question wording and respondent consent language for collection of Twitter handles
Respondents were asked to provide their Twitter handles for research purposes using the following language:
In many of our surveys, we ask about how people like you use social media. But there’s a lot we cannot learn unless you allow us to connect information about your public Twitter behavior to your answers.
No matter how often you use Twitter, would you be willing to share your Twitter handle to help us with this research?
1 Yes
2 No
This project will ONLY collect information that an ordinary user would see when they visit your profile. We will treat this data just like we treat your survey responses and will NEVER share anything that can be linked back to you.
How we will use your Twitter handle
If you provide us with your Twitter handle, we will only be able to collect what an ordinary user would see when visiting your profile. The specific information we will have access to depends on the privacy settings of your Twitter account.
If your account is set to PUBLIC, we will be able to see the accounts you follow; the accounts that follow you; the text of any tweets you have posted; and basic information in your profile, such as your description and the age of your account. We will NOT have access to any private messages you have sent or received.
If your account is set to PRIVATE, we will be able to see how many accounts you follow or how many times you have tweeted – but will NOT be able to see any private messages you have sent or received; the actual content of your tweets; or the names of the accounts you follow or that follow you.
We expect that this research will be concluded in approximately 18 months. At that point we will ask you again whether or not you would like to provide your handle. If you provided your Twitter handle to us previously, that is why you are seeing this question again.
If at any point you wish to opt out of research related to your Twitter account, contact info@americantrendspanel.org. For more information about our privacy practices, please see our Privacy Policy.