Americans and Digital Knowledge in 2019
A majority of U.S. adults can answer fewer than half the questions correctly on a digital knowledge quiz, and many struggle with certain cybersecurity and privacy questions
For the latest survey data on Americans and digital knowledge, see “What Americans Know About AI, Cybersecurity and Big Tech.”
A new Pew Research Center survey finds that Americans’ understanding of technology-related issues varies greatly depending on the topic, term or concept. While a majority of U.S. adults can correctly answer questions about phishing scams or website cookies, other items are more challenging. For example, just 28% of adults can identify an example of two-factor authentication – one of the most important ways experts say people can protect their personal information on sensitive accounts. Additionally, about one-quarter of Americans (24%) know that private browsing only hides browser history from other users of that computer, while roughly half (49%) say they are unsure what private browsing does.
This survey consisted of 10 questions designed to test Americans’ knowledge of a range of digital topics, such as cybersecurity or the business side of social media companies. The median number of correct answers was four. Only 20% of adults answered seven or more questions correctly, and just 2% got all 10 questions correct.
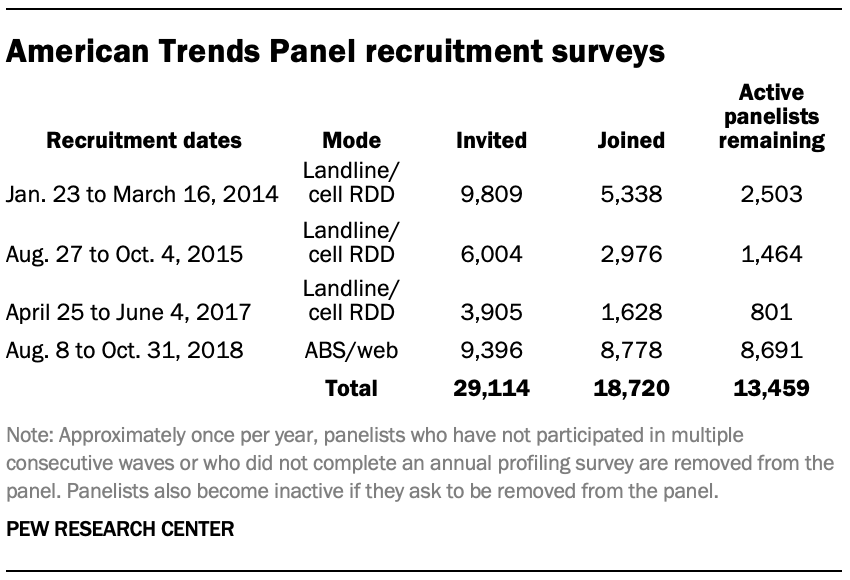
As was true in a previous Center survey, Americans’ knowledge of digital topics varies substantially by educational attainment as well as by age. Adults with a bachelor’s or advanced degree and those under the age of 50 tend to score higher on these questions. These are some of the key findings from a Pew Research Center survey of 4,272 adults living in the United States conducted June 3-17, 2019.

Americans are more knowledgeable about certain digitally focused topics than others
Americans’ understanding of these topics varies drastically across the 10 questions presented in the Center’s survey. To begin with, only three questions were answered correctly by a majority of adults. About two-thirds of U.S. adults (67%) know that phishing scams can occur across multiple platforms, including email, text messages, social media or websites. Some 63% of Americans understand that cookies are text files that allow websites to track users’ site visits and activities.
Similarly, 59% know that advertising is the largest source of revenue for most social media sites, rather than things such as exclusive licensing deals (4%) or corporate consulting (2%).
Additionally, 48% of adults correctly answered that a privacy policy is a contract between websites and users regarding how their data will be used, while 45% know that net neutrality refers to the principle that internet service providers should treat all traffic on their networks equally.
Other concepts in the survey are far less familiar to the public. Only three-in-ten adults correctly answered that starting a URL with “https://” means that the information entered on that site is encrypted (30%). A similar share (28%) accurately identified an example of two-factor authentication. (This involves confirming individuals are who they claim to be in at least two of the following ways: inputting information only the user knows, like a password; using an outside source they possess, like a phone number or token key; or through something like a fingerprint.) A somewhat smaller share – 24% of Americans – is aware that “private browsing” or “incognito mode” only hides online activity from other individuals using the same computer. (It does not mean that the user’s activities are masked and not being captured by the websites, the internet provider, or an employer if the browsing is being done on a work computer.)
Americans’ knowledge of the business side of social media companies is also relatively low. Just 29% of Americans correctly named WhatsApp and Instagram as two companies owned by Facebook. And when presented with a photo of Twitter co-founder and CEO Jack Dorsey, only 15% of adults correctly identified him.
It is important to note that while the share of adults who can correctly answer questions about these issues varies across topics, Americans are more likely to express uncertainty about the topic than give inaccurate answers in most cases. Indeed, the two-factor authentication question is the only question answered incorrectly by more than half of respondents.
Nearly one-in-five adults (17%) say they are not sure how to identify an example of two-factor authentication, and 15% say they do not know where phishing scams occur. These shares, however, are relatively small when compared with a number of other questions in this survey where “not sure” responses are far more common than incorrect answers. For example, 49% of adults each indicate they are unsure which two companies from a list of options are owned by Facebook as well as say they do not understand what private browsing entails. Still, the largest share of “unsure” responses comes on the question in which respondents are presented with a photo of Jack Dorsey: 77% report being unsure of whom the photo depicts.
Americans with higher levels of educational attainment are more likely to answer digital knowledge questions correctly

The public’s knowledge of digital topics varies substantially by educational attainment. Adults with a bachelor’s or advanced degree answered a median of six questions correctly, compared with four correct answers by those who have attended college but have not obtained a degree and three by those with a high school diploma or less. Roughly four-in-ten adults with at least a bachelor’s degree accurately answered seven or more questions (37%), compared with 20% of those with some college experience and just 9% of those with a high school education or less.
For all 10 questions, there are double-digit gaps between those who have a bachelor’s or advanced degree and those who have a high school education or less. And on five questions, the difference sits at roughly 30 percentage points. These include how cookies work (where there is a gap of 32 percentage points between those with at least a bachelor’s degree and those with a high school education or less); what the largest source of revenue for social media sites is (32-point gap); what a privacy policy is (30-point gap); what “https://” means in a URL (30-point gap); and what net neutrality is (30-point gap).
Younger adults generally score higher than older adults across digital knowledge questions

Beyond educational differences, digital knowledge also varies by age, though these gaps are less pronounced than those tied to education levels.
For example, 18- to 29-year-olds correctly answered a median of five out of 10 questions, compared with a median of three among those ages 65 and older.
The degree of these differences varies across the full set of questions. There are sizable gaps between the youngest and oldest age groups on knowing how private browsing functions (a 34-point difference); knowing that Facebook owns Instagram and WhatsApp (25 points) or being able to identify an example of two-factor authentication (23 points). But there are other questions with gaps that are far less pronounced – like identifying what “https://” means in a URL or knowing that advertising is the primary way social media companies generate revenue.