Pew Research Center

FOR RELEASE SEPTEMBER 11, 2017

How People Approach Facts and Information

People deal in varying ways with tensions about what information to trust and how much they want to learn. Some are interested and engaged with information; others are wary and stressed

BY John B. Horrigan

FOR MEDIA OR OTHER INQUIRIES:

Communications Department
202.419.4372
www.pewresearch.org

RECOMMENDED CITATION

Pew Research Center, September 2017, "How People Approach Facts and Information"

About Pew Research Center

Pew Research Center is a nonpartisan, nonadvocacy fact tank that informs the public about the issues, attitudes and trends shaping the world. It does not take policy positions. The Center conducts public opinion polling, demographic research, computational social science research and other data-driven research. It studies politics and policy; news habits and media; the internet and technology; religion; race and ethnicity; international affairs; social, demographic and economic trends; science; research methodology and data science; and immigration and migration. Pew Research Center is a subsidiary of The Pew Charitable Trusts, its primary funder.

© Pew Research Center 2026

Table of contents

  • About Pew Research Center
  • How People Approach Facts and Information
  • 1. The elements of the information-engagement typology
  • 2. Americans fall along a spectrum when it comes to information engagement
  • 3. People’s varying wish lists for information aids that might help them make decisions
  • Appendix: Details on information engagement and other metrics across groups
  • Acknowledgments
  • Methodology

How People Approach Facts and Information

People deal in varying ways with tensions about what information to trust and how much they want to learn. Some are interested and engaged with information; others are wary and stressed

When people consider engaging with facts and information any number of factors come into play. How interested are they in the subject? How much do they trust the sources of information that relate to the subject? How eager are they to learn something more? What other aspects of their lives might be competing for their attention and their ability to pursue information? How much access do they have to the information in the first place?

A new Pew Research Center survey explores these five broad dimensions of people’s engagement with information and finds that a couple of elements particularly stand out when it comes to their enthusiasm: their level of trust in information sources and their interest in learning, particularly about digital skills. It turns out there are times when these factors align – that is, when people trust information sources and they are eager to learn, or when they distrust sources and have less interest in learning. There are other times when these factors push in opposite directions: people are leery of information sources but enthusiastic about learning.

Combining people’s views toward new information ­­­– and their appetites for it – allows us to create an “information-engagement typology” that highlights the differing ways that Americans deal with these cross pressures. The typology has five groups that fall along a spectrum ranging from fairly high engagement with information to wariness of it. Roughly four-in-ten adults (38%) are in groups that have relatively strong interest and trust in information sources and learning. About half (49%) fall into groups that are relatively disengaged and not very enthusiastic about information or about gaining more training, especially when it comes to navigating digital information. Another 13% occupy a middle space: They are not particularly trusting of information sources, but they show higher interest in learning than those in the more information-wary groups.

Here are the groups:

The Eager and Willing – 22% of U.S. adults

At one end of the information-engagement spectrum is a group we call the Eager and Willing. Compared with all the other groups on this spectrum, they exhibit the highest levels of interest in news and trust in key information sources, as well as strong interest in learning when it comes to their own digital skills and literacy. They are not necessarily confident of their digital abilities, but they are anxious to learn. One striking thing about this group is its demographic profile: More than half the members of this group are minorities: 31% are Hispanic; 21% are black and 38% are white, while the remainder are in other racial and ethnic groups.

The Confident – 16% of adults

Alongside the Eager and Willing are the Confident, who are made up of the one-in-six Americans and combine a strong interest in information, high levels of trust in information sources, and self-assurance that they can navigate the information landscape on their own. Few feel they need to update their digital skills and they are very self-reliant as they handle information flows. This group is disproportionately white, quite well educated and fairly comfortable economically. And one-third of the Confident (31%) are between the ages of 18 and 29, the highest share in this age range of any group.

The Cautious and Curious – 13% of adults

The Cautious and Curious have a strong interest in news and information, even though they do not have high levels of trust in the sources of news and information – particularly national news organizations, financial institutions and the government. But they are interested in growth, with a great deal of interest in improving digital skills and literacy. This group differs very little from the general population’s average, although its members have somewhat lower levels of educational attainment than the mean.

The Doubtful – 24% of adults

The Doubtful are less interested in news and information than those in the previous groups. They are leery of news and information sources, particularly local and national news. They also have very busy lives, which could be why they also show little interest in updating their digital skills or information literacy. The Doubtful are the most middle-aged of the groups. They tilt towards being white and they are also relatively well-educated and above average in their economic status.

The Wary – 25% of adults

At the edge of the spectrum are the Wary. They are the least engaged with information. They have very low interest in news and information, low trust in sources of news and information and little interest in acquiring information skills or literacies. That places them at a distance from other Americans in terms of engagement with information. This group is heavily male (59%) and one-third are ages 65 or older.

What are the implications of the typology, especially for issues tied to digital divides and information literacy?

Typologies are useful because they add to the insights that can be gained by doing traditional analysis by demographics – such as gender, race, class, age and educational attainment.

One key takeaway from these typology findings is that there is not a “typical,” archetypal information consumer.  A variety of factors shape people’s engagement with information. There is clear variation among citizens about their interest in information, trust in various sources and their eagerness to gain further skills dealing with information.

This typology suggests that one size does not fit all when it comes to information outreach. For instance, information purveyors might need to use very different methods to get material to the Eager and Willing, who are relatively trusting of institutional information and eager to learn, compared with the tactics they might consider in trying to get the attention of the Cautious and Curious, who are open to learning but relatively distrusting of institutional information. Similarly, groups with messages might want to plan wholly different processes to reach the Confident (who are basically information omnivores), compared with the Wary (who are quite reluctant to engage with new material).

Secondly, the typology highlights the challenges faced by those focusing on digital divides and information literacy as they try to help people improve their access to information and find trustworthy material. On the one hand, significant numbers of people are interested in building digital skills and information literacy. On the other hand, about half of adults fall into the groups we call the Doubtful and the Wary, who have lower interest in getting assistance to help them get to more trustworthy material.

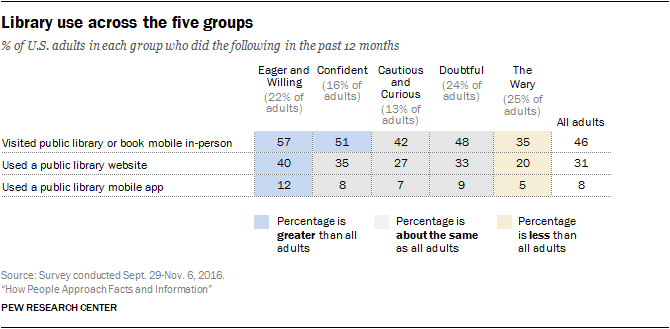
And a third takeaway from the typology highlights how useful it would be if there were trusted institutions helping people gain confidence in their digital- and information-literacy skills. Libraries might be relevant here. Library users stand out in their information engagement. Overall, about half (52%) of adults have visited a public library or connected with it online in the past year. Those library users are overrepresented in the two most information-engaged groups. Some 63% of the Eager and Willing were library users in the past year, while this is true for 58% of the Confident. Additionally, both groups are much more likely than others to say they trust librarians and libraries as information sources.

At the same time, some words of caution are warranted. First, as broad as they were, the questions in this survey did not cover the vast range of people’s connection to information and use of it. Nor did they comprehensively probe people’s attitudes about learning and personal growth. The poll covered particular contexts and it focused on digital access to information. Thus, the results are not projectable to all aspects of people’s vast experiences with media and information.

Another caution: While there are numerical descriptions of the groups, there is some fluidity in the boundaries of the groups. Unlike many other statistical techniques, cluster analysis does not require a single “correct” result. Instead, researchers run numerous versions of it (e.g., asking it to produce different numbers of clusters) and judge each result by how analytically practical and substantively meaningful it is. Fortunately, nearly every version produced had a great deal in common with the others, giving us confidence that the pattern of divisions was genuine and that the comparative shares of those who are relatively engaged and relatively wary of information are generally accurate.

A third caution is that the findings represent a snapshot of where adults are today in a changing information ecosystem. The groupings reported here may well change in the coming years as people’s comfort and confidence with accessing information digitally evolve and as technologists offer new ways for people to encounter and create information.

Even allowing for those caveats, these findings add insight to swirling debates about how people think about and use information.
1. The elements of the information-engagement typology

There are any number of ways to assess the public’s approach to facts and information. One method could involve case studies or experiments to test how people respond to specific information-evaluation challenges. Another  might attempt an in-depth assessment of a specific event and research how people learned about it and reacted to it.

In this study, Pew Research Center aimed to study broad patterns in people’s approach to information and report on a spectrum of engagement among Americans ranging from relatively high enthusiasm to relatively deep wariness. The information-user typology here was built around analyzing five batches of questions in the survey: First, it assessed people’s level of interest in some key news and information subjects. Second, it captured their trust in various information sources. Third, it explored areas where people are interested in learning and growing. Fourth, it probed aspects of their lifestyle that might tie to their ability to spend time with information. And fifth, it explored people’s technology assets.

This chapter runs through people’s answers to those questions and how they fit together in the typology.

1) Interest in key news and information topics

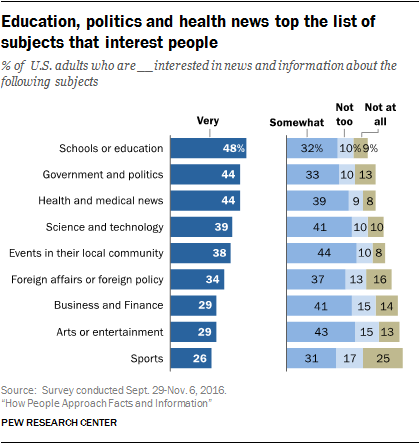
The questions covered people’s level of interest across nine different topics. A majority are relatively interested in each of the different categories, with education, politics, and health and medical news among the topmost subjects that interest people.

For the purposes of the typology, the model was built using the mean (average) number of topics that people said they are “very” interested in. The Eager and Willing said they are very interested in 4.47 topics; the Confident are very interested in 3.48; the Cautious and Curious are very interested in 3.45 of these topics; the Doubtful are very interested in 3.08 of them; and the Wary are very interested in 2.32.

2) Trust in information sources

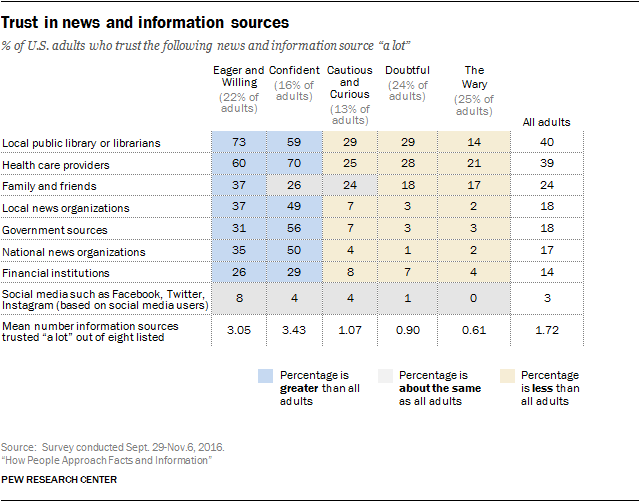
Beyond people’s interest in topics, the survey looked at people’s trust in eight information sources. Libraries and health care providers top the list of the most trusted sources that were queried, while social media is at the bottom.

Overall, 30% of American adults say they do not trust any information source on our list “a lot.” On average, American adults trust 1.7 of the eight sources “a lot.”

The typology used the mean number of these sources that people trust a lot. The figure is 3.43 for the Confident; 3.05 for the Eager and Willing; 1.07 for the Cautious and Curious; .90 for the Doubtful; and .61 for the Wary.

3) Learning outlook and interest

People’s engagement with information can be tied to their interest in learning more. Several of this survey’s questions borrowed from the analytical insights tied to whether people have a growth mindset or fixed mindset, developed by Stanford psychology professor Carol Dweck. Growth mindset refers to people’s attitudes about whether human beings are essentially fixed in their basic talents and traits, or whether they have the capacity to grow.

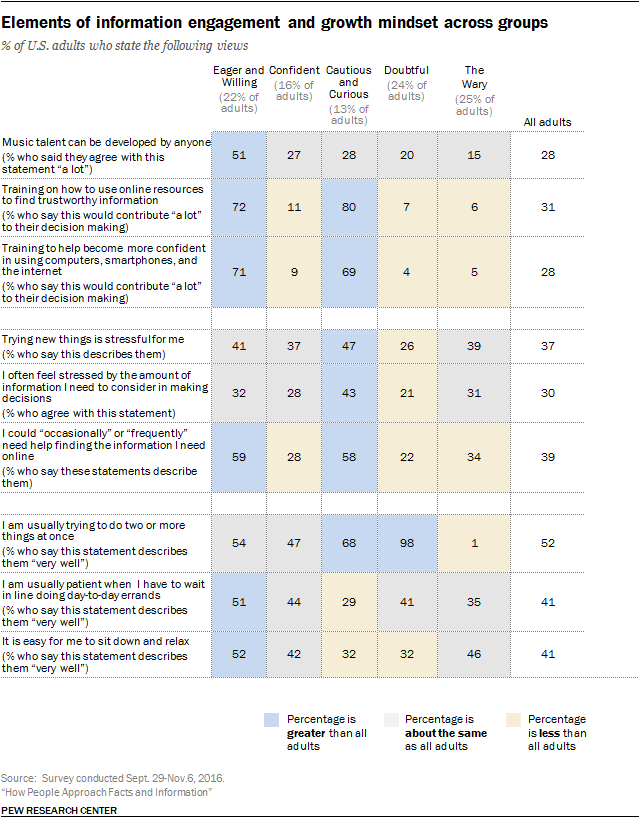
One question asked for people’s views about this statement: “Music talent can be developed by anyone.” Some 28% say this statement describes them “very well,”  and the variance among the groups on this answer was a meaningful input to the model.

Another question asked whether people think that training on how to use online resources for finding trustworthy information would help them in making decisions. Some 31% said that would help their ability to make decisions “a lot.” Again, there was notable variation among different groups around this answer.

The third personal growth question dealt with the degree to which people thought they might be helped in making decisions if they got training aimed at making them more confident in using digital technology. Some 28% of adults said such training would contribute “a lot” to their decision-making capacity. And those answers varied across the groups.

In all, 53% of Americans gave the strongest affirmative answer to at least one of these questions, and this became a useful predictor in helping establish which group people belonged in.

4) Lifestyle issues

Additionally, the survey sought insights about time pressures and other stresses in people’s lives that might tie to their ability and interest to engage with information. First, 39% of internet users (35% of all adults) say they “occasionally” or “frequently” could use help finding the information they need online. These answers were strikingly different across the various typology groups. Second, 52% of Americans say this statement describes them very well: “I’m usually trying to do two or more things at once.” Third, 37% of adults say this statement describes them very well: “Trying new things is stressful for me.” Fourth, 41% of the public says “I am usually patient when I have to wait in line doing day-to-day errands” describes them very well. Again, there was notable variance across the different groups in the way people answered these questions.

5) Digital access tools

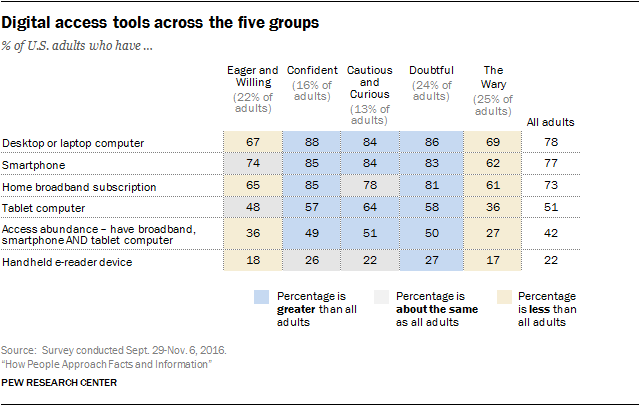
Finally, the survey covered the basic technology inventory of people’s lives and found that three kinds of tools and access mattered to the typology. In this survey, 77% of respondents have a smartphone; 73% have a home broadband subscription; and 51% have a tablet computer. Some 42% of adults have all three, and we think of this as “access abundance.” Statistical modeling showed those with such abundance had different engagement compared with those who two or fewer of those access tools.

Cluster analysis yields the typology

A statistical technique called cluster analysis yielded the five groups this report discusses. The technique places people into distinct categories based on the similarity of their answers to specific survey questions. Unlike many other statistical techniques, cluster analysis does not result in a single “correct” result. Instead, researchers run numerous versions of it­ – that is, by asking statistical software to produce different numbers of clusters. They then judge each result by how analytically practical and substantively meaningful it is. Nearly every version researchers tried for this report had a great deal in common with the others, giving us strong confidence in the comparative shares of those who were relatively information engaged and information wary.

2. Americans fall along a spectrum when it comes to information engagement

The cluster analysis yields five groups of people based on their information interests, their trust in a variety of sources, their assertions about their learning interests when it comes to digital information, some lifestyle issues, and their technology assets. These groups are distinguished in key respects by the variances in how they cope with trust (or lack of trust) in information and their desire (or not) to learn.

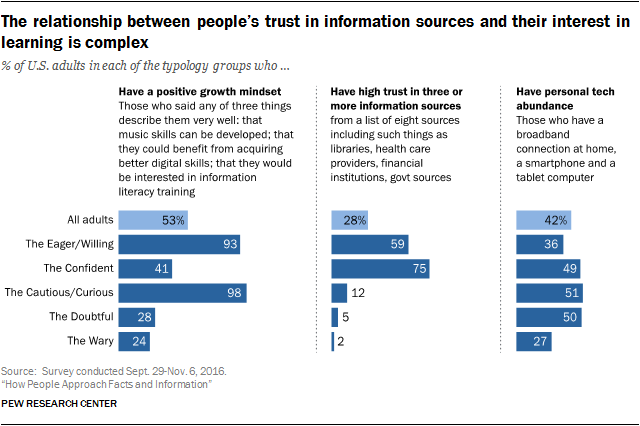
The chart below shows how people’s answers on several questions play out across the five groups. Note that the growth-mindset measure refers to the 53% who said any one of three things describe them very well – that music skills can be developed, that they could benefit from acquiring better digital skills, or that they would be interested in information literacy training. High trust refers to the 28% of all adults who trust three or more of the information sources about which they were asked. Personal tech abundance refers to the 42% of adults who have a broadband connection at home, a smartphone and a tablet computer.

The chart shows some of the variance in the connection between people’s trust in information sources and their interest in learning. This relationship is particularly evident in two groups: the Eager and Willing and the Confident. But the Cautious and Curious illustrate a different pattern. They are quite interested in learning, even though they hardly trust any of the information sources we queried.

Additionally, abundant access to the internet does not neatly associate with trust in information sources. For example, the Doubtful have below-average interest in news and information even though most have three key kinds of digital connections – home broadband, a smartphone and a tablet computer.

The other factors that influence how people sort into groups are linked to their level of skill in using the internet to find information and how busy they think they are, whether they think they are usually trying to do two or more things at once. As the chart below shows, these factors seem unimportant to the Wary, whose classification comes mainly from a low level of trust and lower levels of enthusiasm for learning. But they are important for the Doubtful, who are especially likely to say they regularly find themselves doing two things at once. The Cautious and Curious sometimes need help finding things online, but might be too busy to reach out for help.

Here is a fuller breakdown of how the groups differ (and all of the typology analysis is reported in the Appendix:

The Eager and Willing (22%)

The most ardent information-engaging group is the Eager and Willing, which makes up 22% of the adult population. This group has the highest levels of interest in news and information in a variety of topics, as well as a high degree of trust in information sources. More than any other group, they strongly trust their family and friends and libraries as information sources. (They are the most active library users, too.)

The Eager and Willing also have a strong interest in personal learning. They are more than twice as likely as all adults to say they would be very interested in digital skills or information literacy training. Perhaps this tied to the fact they report a high level of needing help finding the information they want online. They also wish, to an extent far greater than any other group, that a public library were closer to home and had expanded hours.

Relative to three of the other groups, they do not have particular abundance in digital information access tools and, perhaps for that reason, about six-in-ten  report at least occasional difficulty finding information online.

Demographically, the Eager and Willing are majority minority: Some 38% are white, while 52% are either black (21%) or Hispanic (31%). Compared with other groups, this group has lower incomes and educational attainment.

Key differentiators: The Eager and Willing have the highest levels of interest in news and information across a variety of topics. They have a strong orientation toward learning. This group also turns to the library for information and wishes hours were better or a library was closer to home.

The Confident (16%)

The Confident report the highest levels of trust in information sources, with particularly strong levels of trust in national news organizations, government sources and health care providers. They also have above-average interest in news, with special emphasis on government and politics and foreign affairs.

They have relative abundance of tech-access tools, with half (49%) having all three access devices, compared with the average of the overall population, which is 42%. The Confident do not feel they need additional training in digital skills or information literacy. That may be because of the group’s high levels of educational attainment. This group is also, on the whole, relatively well-off economically and younger, compared with other groups. The Confident are more likely than all but The Eager and Willing to have used a library in the past year. They also join the Eager and Willing in trusting libraries as information sources.

Key differentiators: The Confident have the highest overall level of trust in information sources. That is accompanied by high levels of educational attainment. Their self-assurance is evident in how little they feel they need to improve digital skills or information literacy, while they have strong interest in news and information.

The Cautious and Curious (13%)

The Cautious and Curious group falls in the middle of the typology. They are, on the one hand, somewhat above average levels of interest in news and information. Yet their trust in information sources falls below average. They express clear concerns about their digital skills and at the same time have interest in learning how to gain better skills. About six-in-ten of the internet users in this group occasionally or frequently have trouble finding things online – compared with 39% for the general population. At the same time, the Cautious and Curious are more than twice as likely as all adults to be interested in getting training on digital skills and information literacy. This arises even though those in this group report significant levels of stress over trying new things and that they have busy lives.

This group does have an abundance of information access points, with 51% having each of three access tools (home broadband, a smartphone, and a tablet computer). They have somewhat lower levels of educational attainment than average, but their household income is in line with the average.

Key differentiators: The Cautious and Curious have high interest in learning, but it clashes with other factors. They have relatively low levels of digital skills and lead busy lives. They also have some distrust of news and information sources. That means they fall below the Eager and Willing and the Confident in their engagement with information.

The Doubtful (24%)

This group has fairly typical levels of interest in information (just below average) and visit the library on par with others. Yet they have low levels of trust in information sources – especially national and local news organizations. They are also much more likely than average to say they are often trying to do two or more things at once and less likely than others to say it is easy for them to relax.

The Doubtful group does not exhibit a growth mindset when it comes to acquiring digital skills or information literacy, even though they are above average on measures of educational attainment and income. Additionally, this group has the highest rate of full-time employment among all groups. They also have the digital tools to engage with information. Some 50% have all three key digital access tools. It may be that their lack of time and low trust in information sources dampens their interest in following information. Nearly all (98%) find themselves sometimes trying to do more than one thing at a time, and they are the second lowest group in terms of metrics measuring trust in information sources.

Key differentiators: The Doubtful have low levels of trust in information sources and very busy lives. They fall below the Cautious and Curious in their interest in several information topics and they have virtually no interest in training.

The Wary (25%)

People in this group have relatively low levels of interest in information and very low levels of trust in information sources. The Wary do not exhibit much interest in acquiring digital skills or the wherewithal to determine what information is trustworthy. Other factors (e.g., how busy they are) do not have much role in their patterns of information interest or trust. For them, the lack of interest in learning digital and information-literacy skills as well as leeriness of information sources are the dominant factors contributing to their wariness about information.

Although the Wary are below average in access to information technology, they are not bereft of connectivity. Some 61% have broadband at home and 62% have smartphones. Only 39% have used the library in the past year (below the 52% national average). Demographically, they are heavily male (59%) and have only slightly lower levels of educational attainment than the norm. However, they are an older group: 33% are ages 65 or older vs. the 18% average.

Key differentiators: The Wary are the least likely to own any of the technology tools on our list. They have low trust in information sources, a low enthusiasm for learning and the lowest interest in any information topic. They are more stressed in some ways than the Doubtful.

3. People’s varying wish lists for information aids that might help them make decisions

One way to think about how people handle information demands is to examine their “wish list” of tools that might help them use information in making decisions. This produces some insight into the resources people say would help them cope with information demands.

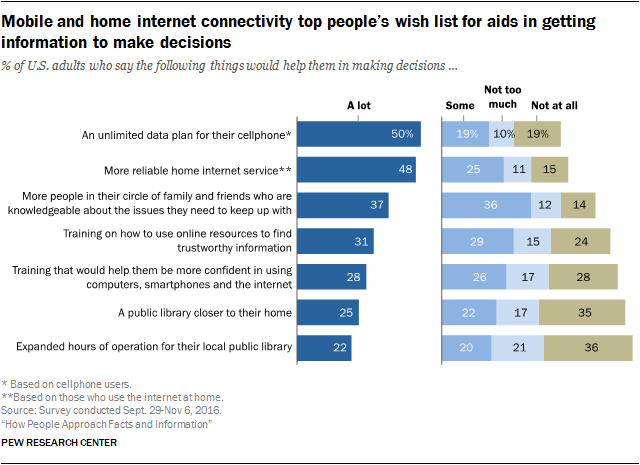
The survey asked people the degree to which certain resources would contribute to them using information to make decisions in their lives. The list was: an unlimited data plan for their cellphones (50% say that would help them “a lot” in making decisions); more reliable home internet service (48% say that would help them a lot); friends in their social networks who know about the issues they were wrestling with (37% say that would help a lot); training in using online resources to find trustworthy information (31% say it would help a lot); training that would help them be more confident in their computer or smartphone use (28% say that would help a lot);  a closer public library (25% say it would help a lot); and expanded hours of operation at their local library (22% say that would help a lot).

People’s answers to these questions often connected with their answers on their general levels of trust in information and interest in learning. For instance, the Eager and Willing are the most hungry for the variety of tools or resources that would help them use information better to make decisions. They are highly interested in training on digital skills or information literacy, as well as more reliable internet service or unlimited data caps. To an extent far greater than any other group, they say having a library with better hours or closer to their home would help them a lot in gathering information for decisions. They would also welcome more people in their social networks that are knowledgeable about issues they need to keep up with.

The other group that is particularly likely to say these tools would help them “a lot” is the Cautious and Curious. They share high levels of interest in various resources with the Eager and Willing, with the exception of easier access to libraries (either proximity or hours).

The Eager and Willing and the Cautious and Curious are also very likely to say that more reliable home internet service or higher data caps would help them a lot as they seek out information for decisions. These groups, in other words, represent tech consumers with strong awareness of the attributes of the information services they use – and a desire for something better. The Eager and Willing (22%) and the Cautious and Curious (13%) make up just over one-third of the adult population.

The Confident (16%) do not seem to have similarly high interest in resources that might help them cope with information flows. This could stem from the fact that this group is relatively well off financially and relatively assured that they know what they need to know and have what they need to have when it comes to digital tools and skills.

This leaves about half of the adult population (the Doubtful and the Wary) who are hesitant in dealing with information and who do not express interest in tools that might help them find what they need. They are not convinced that digital resources might aid them. This might also affect their capacity to engage with parts of the information society.

Many think libraries can help with information challenges

These findings complement previous Pew Research Center surveys about how people think about the role of libraries, particularly in helping meet the information needs of their communities. For instance, previous Center surveys have found that 80% of those ages 16 and above think libraries should offer digital skills training, especially for older adults and kids. Similar numbers  (76% of those ages 16 and older) say libraries should definitely have programs to teach patrons about online privacy and security.

This new survey contained a battery of new questions about the ways libraries might contribute to people’s information needs. Majorities of Americans think libraries help them with information issues:

  • 78% say their local library helps them find information that is trustworthy and reliable.
  • 76% believe libraries help them learn new things.
  • 65% argue that libraries help them grow as people.
  • 56% maintain that libraries help them get information that helps them make decisions.

Appendix: Details on information engagement and other metrics across groups

Acknowledgments

This report was made possible by The Pew Charitable Trusts, which received support for the project through a grant from the Bill & Melinda Gates Foundation. It is a collaborative effort based on the input and analysis of the following individuals.

Disclaimer: The findings and conclusions contained within are those of the authors and do not necessarily reflect positions or policies of the Bill & Melinda Gates Foundation.

Primary researcher

John B. Horrigan, Senior Researcher

Research team

Lee Rainie, Director, Internet and Technology Research Aaron Smith, Associate Director, Research Andrew Perrin, Research Assistant Claudia Deane, Vice President, Research

Editorial and graphic design

Margaret Porteus, Information Graphics Designer Shannon Greenwood, Copy Editor

Communications and web publishing

Shannon Greenwood, Associate Digital Producer Tom Caiazza, Communications Manager

Methodology

The analysis in this report is based on a Pew Research Center survey conducted Sept. 29-Nov. 6, 2016, among a national sample of 3,015 adults, 18 years of age or older, living in all 50 U.S. states and the District of Columbia. Some 838 respondents were interviewed on a landline telephone, and 2,258 were interviewed on a cellphone. The survey was conducted by interviewers at Princeton Data Source under the direction of Princeton Survey Research Associates International. A combination of landline and cellphone random-digit-dial samples were used; both samples were provided by Survey Sampling International. Interviews were conducted in English and Spanish. Respondents in the landline sample were selected by randomly asking for the youngest adult male or female who was at home. Interviews in the cellphone sample were conducted with the person who answered the phone, if that person was 18 years of age or older. For detailed information about our survey methodology, visit: https://alpha.pewresearch.org/pewresearch-org/methodology/u-s-survey-research/

The combined landline and cellphone samples are weighted using an iterative technique that matches gender, age, education, race, Hispanic origin and nativity, and region to parameters from the 2016 Census Bureau’s American Community Survey and population density to parameters from the Decennial Census. The sample also is weighted to match current patterns of telephone status (landline only, cellphone only or both landline and cellphone) based on extrapolations from the 2016 National Health Interview Survey. The weighting procedure also accounts for the fact that respondents with both landline and cellphones have a greater probability of being included in the combined sample and adjusts for household size among respondents with a landline phone. The margins of error reported and statistical tests of significance are adjusted to account for the survey’s design effect, a measure of how much efficiency is lost from the weighting procedures.

The following table shows the unweighted sample sizes and the error attributable to sampling that would be expected at the 95% level of confidence for different groups in the survey:

Sample sizes and sampling errors for other subgroups are available upon request.

In addition to sampling error, one should bear in mind that question wording and practical difficulties in conducting surveys can introduce error or bias into the findings of opinion polls. Pew Research Center undertakes all polling activity, including calls to mobile telephone numbers, in compliance with the Telephone Consumer Protection Act and other applicable laws.

Pew Research Center is a nonprofit, tax-exempt 501(c)(3) organization and a subsidiary of The Pew Charitable Trusts, its primary funder.