Pew Research Center

FOR RELEASE DECEMBER 19, 2016

Online Shopping and E-Commerce

New technologies are impacting a wide range of Americans’ commercial behaviors, from the way they evaluate products and services to the way they pay for the things they buy

BY Aaron Smith and Monica Anderson

FOR MEDIA OR OTHER INQUIRIES:

Communications Department
202.419.4372
www.pewresearch.org

RECOMMENDED CITATION

Pew Research Center, December 2016, "Online Shopping and E-Commerce"

About Pew Research Center

Pew Research Center is a nonpartisan, nonadvocacy fact tank that informs the public about the issues, attitudes and trends shaping the world. It does not take policy positions. The Center conducts public opinion polling, demographic research, computational social science research and other data-driven research. It studies politics and policy; news habits and media; the internet and technology; religion; race and ethnicity; international affairs; social, demographic and economic trends; science; research methodology and data science; and immigration and migration. Pew Research Center is a subsidiary of The Pew Charitable Trusts, its primary funder.

© Pew Research Center 2026

Table of contents

  • About Pew Research Center
  • Online Shopping and E-Commerce
  • 1. Online shopping and purchasing preferences
  • 2. Online reviews
  • 3. New modes of payment and the ‘cashless economy’
  • Acknowledgments
  • Methodology

Online Shopping and E-Commerce

New technologies are impacting a wide range of Americans’ commercial behaviors, from the way they evaluate products and services to the way they pay for the things they buy

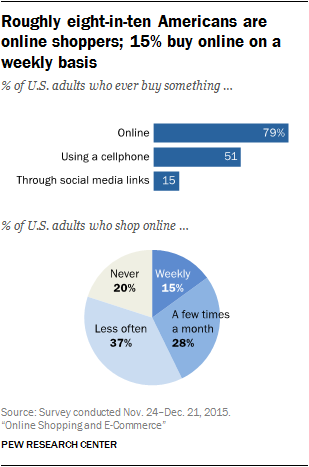
Americans are incorporating a wide range of digital tools and platforms into their purchasing decisions and buying habits, according to a Pew Research Center survey of U.S. adults. The survey finds that roughly eight-in-ten Americans are now online shoppers: 79% have made an online purchase of any type, while 51% have bought something using a cellphone and 15% have made purchases by following a link from social media sites. When the Center first asked about online shopping in a June 2000 survey, just 22% of Americans had made a purchase online. In other words, today nearly as many Americans have made purchases directly through social media platforms as had engaged in any type of online purchasing behavior 16 years ago.

But even as a sizeable majority of Americans have joined the world of e-commerce, many still appreciate the benefits of brick-and-mortar stores. Overall, 64% of Americans indicate that, all things being equal, they prefer buying from physical stores to buying online. Of course, all things are often not equal – and a substantial share of the public says that price is often a far more important consideration than whether their purchases happen online or in physical stores. Fully 65% of Americans indicate that when they need to make purchases they typically compare the price they can get in stores with the price they can get online and choose whichever option is cheapest. Roughly one-in-five (21%) say they would buy from stores without checking prices online, while 14% would typically buy online without checking prices at physical locations first.

Although cost is often key, today’s consumers come to their purchasing decisions with a broad range of expectations on a number of different fronts. When buying something for the first time, more than eight-in-ten Americans say it is important to be able to compare prices from different sellers (86%), to be able to ask questions about what they are buying (84%), or to buy from sellers they are familiar with (84%). In addition, more than seven-in-ten think it is important to be able to try the product out in person (78%), to get advice from people they know (77%), or to be able to read reviews posted online by others who have purchased the item (74%). And nearly half of Americans (45%) have used cellphones while inside a physical store to look up online reviews of products they were interested in, or to try and find better prices online.

The survey also illustrates the extent to which Americans are turning toward the collective wisdom of online reviews and ratings when making purchasing decisions. Roughly eight-in-ten Americans (82%) say they consult online ratings and reviews when buying something for the first time. In fact, 40% of Americans (and roughly half of those under the age of 50) indicate that they nearly always turn to online reviews when buying something new. Moreover, nearly half of Americans feel that customer reviews help “a lot” to make consumers feel confident about their purchases (46%) and to make companies be accountable to their customers (45%).

But even as the public relies heavily on online reviews when making purchases, many Americans express concerns over whether or not these reviews can be trusted. Roughly half of those who read online reviews (51%) say that they generally paint an accurate picture of the products or businesses in question, but a similar share (48%) say it’s often hard to tell if online reviews are truthful and unbiased.

Finally, this survey documents a pronounced shift in how Americans engage with one of the oldest elements of the modern economy: physical currency. Today nearly one-quarter (24%) of Americans indicate that none of the purchases they make in a typical week involve cash. And an even larger share – 39% – indicates that they don’t really worry about having cash on hand, since there are so many other ways of paying for things these days. Nonwhites, low-income Americans and those 50 and older are especially likely to rely on cash as a payment method.

Among the other findings of this national survey of 4,787 U.S. adults conducted from Nov. 24 to Dec. 21, 2015:

  • 12% of Americans have paid for in-store purchases by swiping or scanning their cellphones at the register.
  • Awareness of the alternative currency bitcoin is quite high, as 48% of Americans have heard of bitcoins. However, just 1% of the public has actually used, collected or traded bitcoins.
  • 39% of Americans have shared their experiences or feelings about a commercial transaction on social media platforms.
1. Online shopping and purchasing preferences

America has long been a nation of shoppers, and that is as true online as it is in the physical world. The earliest modern e-commerce transactions date to just 1994, but by 2015 Americans were spending nearly $350 billion annually online – or roughly 10% of all retail purchases, excluding automobiles and fuel. Pew Research Center surveys of digital commerce tell a similar tale. When the Center first asked about online shopping in a survey conducted in June 2000, just 22% of Americans indicated that they had ever made a purchase online. But in the intervening years that figure has increased nearly fourfold: Today, 79% of Americans say they make purchases online.

And in an era of widespread social media use and smartphone access, many Americans are incorporating these devices and platforms into their purchasing behaviors. Roughly half (51%) of Americans report making online purchases using their cellphones, while 15% have purchased something by following a link on social media sites such as Facebook or Twitter.

A substantial majority of Americans are online shoppers, but for most this behavior is a relatively infrequent occurrence. Some 15% of Americans say that they make purchases online on a weekly basis (4% do so several times a week, while 10% do so about once a week) and 28% shop online a few times a month. On the other hand, nearly six-in-ten Americans say they buy online less often than a few times a month (37%) or they never make any online purchases (20%).

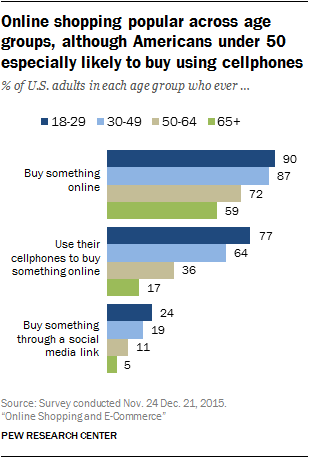
And while each of these online shopping behaviors are relatively common across a wide range of demographic groups, younger adults in particular are especially likely to utilize cellphones and social media platforms to engage in commercial activity. Some 90% of 18- to 29-year-olds ever buy items online, while 77% have purchased something using their cellphones and 24% have bought something by following a link on social media. By contrast, a majority (59%) of those 65 and older ever generally make online purchases–but only 17% have bought something using their cellphones and just 5% have done so through a social media link.

Two-thirds of online shoppers generally prefer buying from physical stores, although pricing differences are ultimately what drives most Americans’ purchasing decisions

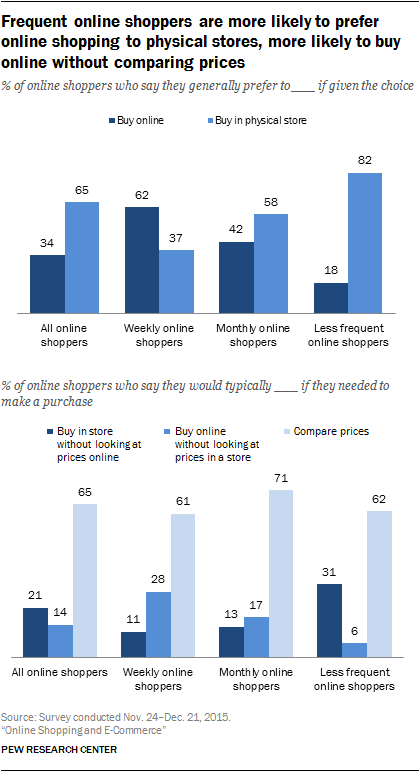
Despite the large share of Americans who engage in online shopping and the potential conveniences that come with buying online, a majority of online shoppers indicate that – all things being equal – they actually prefer to do their shopping in physical stores. Some 65% of online shoppers indicate that, when given the choice, they generally prefer to buy from physical locations; 34% indicate that they generally prefer to buy online.

As might be expected, the most dedicated online shoppers tend to express a relatively pronounced preference for shopping online as opposed to shopping in physical stores. Among Americans who make online purchases on a weekly basis, 62% indicate that they generally prefer to buy online, while 37% generally prefer to buy from physical stores. But among those who buy online on a monthly basis, 42% prefer online shopping while 58% prefer buying from physical locations. And among those who make online purchases even less frequently, just 18% prefer buying online – with 82% indicating that they prefer to shop in physical stores.

But even as many online shoppers express preferences for physical stores in the abstract, their ultimate decision of where to buy something often comes down to price. When asked a second question about their relative preferences for online and in-person shopping that incorporates pricing, fully 65% of online shoppers indicate that if they needed to make a purchase they would probably compare the price they could get online with the price they could get from physical stores and choose whichever one offered them the best deal. Another 21% of online shoppers say they would likely buy from stores without looking at prices online, while 14% indicate they would buy online without looking at prices in physical stores.

Users who frequently shop online are substantially more likely to say that they would typically choose to make purchases by simply buying online without visiting stores: 28% of weekly online shoppers say that they would likely do this if they needed to buy something, compared with 17% of monthly online shoppers and just 6% of those who buy online less often. But even among these frequent online shoppers, 62% say that they would typically compare the price they could get online and the price they could get in physical stores and choose whichever one is cheapest.

When buying something for the first time, Americans especially value the ability to compare prices and ask questions

Americans take a number of factors into consideration when shopping for something that they haven’t purchased in the past – especially the ability to compare prices from multiple sellers and to ask questions about what they are buying. When asked about the importance of seven different factors when buying something for the first time, 86% of Americans say that the ability to compare prices from several different sellers is either extremely (42%) or somewhat (44%) important, while a similar share say that being able to ask questions is extremely (42%) or somewhat (41%) important.

Other factors that Americans consider important include the ability to buy from stores or sellers they are familiar with (34% of Americans describe this as extremely important); the ability to read ratings or reviews that other people have posted online (32%); the ability to look at or try out the product in person (30%); and the ability to get advice or recommendations from people they know (23%). The ability to buy online – without having to make a trip to the store – ranks as the least important factor: just 42% of Americans say that this is at least somewhat important to them when buying something for the first time, and only 10% describe it as extremely important.

Regardless of their demographic characteristics, when buying something for the first time most Americans assign greater importance to being able to look at or try the product in person than they do to being able to buy online without making a trip to the store. However, frequent online shoppers are one of the few groups who place more importance on being able to buy online. Nearly three-quarters (72%) of weekly online shoppers say that being able to buy online without having to make a trip to the store is important to them when buying something for the first time (20% say it is extremely important). Meanwhile, a slightly smaller share (66%) says it is important to be able to try something out in person (with 15% saying this is extremely important).

Many Americans are using their cellphones while inside physical stores to help with purchase decisions or to get a better price

Today cellphone ownership is nearly ubiquitous, and roughly two-thirds of Americans have smartphones. And as the reach of these mobile devices have expanded, many consumers are using them to augment and assist with their physical and in-person purchasing experiences.

The survey asked about four different ways that people might utilize their mobile phones while making purchasing decisions inside physical stores and found that calls for advice and assistance are especially common: Nearly six-in-ten Americans (59%) say that they have used their cellphones to call or text someone while inside a store to discuss purchases they are thinking of making. Just under half (45%) have used their phones while inside a store to look up online reviews or to try and find a better price online for something they are thinking of purchasing. And a relatively small share of Americans (12%) have used their cellphones to physically pay for in-store purchases.

As noted above, a majority of Americans under the age of 50 have used cellphones to purchase something online – and this group is also especially likely to utilize their cellphones while making in-store purchasing decisions. Fully 70% of 18- to 49-year-olds have used their cellphones to call or text someone from inside a store to ask for purchasing advice, while 62% have used their phones to look up online reviews of something they were thinking of purchasing or to see if they could find a better price online. And nearly one-in-five (18%) have swiped their phones at the register to pay for purchases.

2. Online reviews

Consumers have long relied on advice and recommendations from others before making purchasing decisions, and Americans today have access to a vast library of customer ratings and reviews that they can consult when deciding if products or services are worth their money. This survey finds that a substantial majority of the public now incorporates these customer ratings and reviews into their decision-making processes when buying something new: Fully 82% of U.S. adults say they at least sometimes read online customer ratings or reviews before purchasing items for the first time, including 40% who say they always or almost always do so.

Reading online reviews is common across wide range of demographic groups, but those under 50 are especially likely to regularly incorporate them into their shopping experiences. A little more than half (53%) of 18- to 29-year-olds and 47% of 30- to 49-year-olds say they always or almost always read online reviews when buying something for the first time. Fewer adults ages 50-64 (34%) or 65 and older (23%) consistently engage in this type of online shopping behavior.

The frequency with which people read online reviews is also correlated with how often they shop online. Roughly two-thirds (67%) of weekly online shoppers say they nearly always read customer reviews before buying new items, compared with 54% of monthly online shoppers and 38% of those who say they shop online less often. Overall, online shoppers are eight times more likely than those who never shop online to say they typically check online reviews before buying something for the first time (49% vs. 6%).

In addition to reading online reviews, many Americans watch online videos to help them with purchasing decisions: 55% of U.S. adults say they have watched product review videos online. Product review videos are also more common among those under 50 than among those 50 and older (68% vs. 41%) and more common among men than among women (62% vs. 50%).

Many Americans express reservations over whether or not online reviews can be trusted

The trustworthiness of online reviews has come into question in recent years, as business owners and consumers alike have voiced concerns about the validity and truthfulness of the information posted on various online review sites. And when asked about this issue, Americans themselves are nearly evenly split. Roughly half (51%) of those who read online reviews say they generally give an accurate picture of the true quality of the product, but a similar share (48%) believes it is often hard to tell if online reviews are truthful and unbiased.

In general, users with greater experience utilizing online reviews are more comfortable with their accuracy and truthfulness. Around two-thirds (65%) of U.S. adults who say they always or almost always read online ratings and reviews believe that they are generally accurate – although even among this group a substantial minority (35%) says it can be hard to determine their truthfulness. But among those who say they only sometimes read online reviews, these figures are reversed: 38% say that online ratings and reviews are generally accurate, while 61% say it’s often hard to tell if they are truthful and unbiased. Similarly, Americans under the age of 50 are more likely than older adults to trust the accuracy of online reviews. Some 55% of those ages 18 to 49 who read online reviews feel that they are generally accurate, compared with 45% of those 50 and older.

And when it comes to the tone of online reviews, more Americans report being influenced by highly negative reviews than are influenced by highly positive ones. Some 54% of Americans who read online reviews indicate that they pay more attention to extremely negative reviews when trying to make decisions, while 43% pay more attention to extremely positive ones.

Around one-in-ten Americans nearly always post their own reviews of products, services and restaurants

Some 40% of Americans nearly always rely on online reviews when making purchasing decisions – but a much smaller share consistently write their own reviews of the products and services they themselves engage with. The survey asked respondents how often (if at all) they post their own online reviews of three different types of purchases: products they have bought, restaurants they have visited and services they have used. Around one-in-ten Americans nearly always post their own reviews about each of these items, while roughly half sometimes post their own reviews about products and services (a slightly smaller share – 43% – sometimes post their own reviews about the restaurants they visit).

There are only modest age differences when it comes to reviewing restaurants or other services, but Americans under the age of 50 are quite a bit more likely than older adults to leave their own product reviews. Fully 71% of 18- to 49-year-olds at least sometimes provide their own reviews of the products they purchase, compared with 49% of those ages 50 and older.

Roughly four-in-ten U.S. adults have expressed their feelings about companies or products on social media

Along with dedicated online review sites, social media platforms now provide an opportunity for consumers to share their thoughts and experiences about the products and services they use. And this survey finds that 39% of U.S. adults say they have shared their experiences or feelings about companies or products on social media sites like Facebook or Twitter. Some 55% of 18- to 29-year-olds have engaged in this behavior, as have half (50%) of those ages 30 to 49.

Those who have shared their customer experiences on social media report doing so for a mix of both positive and negative reasons. Among those who have talked about their experiences with a company or product on social media, 86% indicate that they have done so after a good experience, while 77% say that they have done so following a bad experience.

Many Americans view consumer reviews as more useful than government oversight on certain metrics

Issues pertaining to product safety and consumer protection have long been the domain of a number of federal, state and local government agencies. At the same time, Americans now have access to a host of reviews and ratings that might help them learn more about companies and products as well as navigate their way through good and bad consumer experiences. This survey asked Americans to assess the extent to which both of these approaches – government regulations versus reviews and ratings – do a good job of ensuring product safety, encouraging consumer confidence and making companies accountable.

On two of these issues in particular, Americans exhibit notably higher levels of trust in ratings and reviews rather than government regulations: A larger share feels that customer ratings and reviews help consumers feel confident about their purchases and a larger share feels that ratings and reviews make companies accountable to their customers. Some 46% of Americans feel that the availability of customer ratings and reviews helps “a lot” to make consumers feel confident about their purchases, nearly double the share (25%) who feels that government regulations help a lot in this regard. Similarly, 45% of the public says that consumer reviews help “a lot” to make companies accountable to their consumers, 15 percentage points higher than the share who feels that government regulations are equally helpful (30%).

This pattern extends to views about product safety as well, though the differences are narrower: 41% of Americans feel that access to consumer reviews helps “a lot” with ensuring the safety of products and services, slightly higher than the 33% who feel that government oversight helps a lot in this regard.

3. New modes of payment and the ‘cashless economy’

Physical currency has existed since the dawn of the modern economy, but its role is waning as new modes of payment have emerged: Today, 24% of Americans indicate that they make no purchases using cash during a typical week. At the same time, an identical share of Americans (24%) indicate that they use cash for all or almost all of their typical purchases, and about half of Americans (51%) fall somewhere in the middle: They say they typically make some purchases using cash and some purchases in other ways.

A plurality (if not outright majority) of most demographic groups indicate that they tend to mix and match cash and other modes of payment – but some groups are less reliant on cash than others. For instance, those with household incomes of $75,000 or more per year are substantially more likely than those earning less than $30,000 per year to say that they do not make any purchases using cash in a typical week (34% vs. 15%); conversely, lower income Americans are much more likely to say that they make nearly all of their purchases in cash (38% vs. 10%). Blacks also tend to be more firmly rooted in the cash economy: 42% of blacks use cash for nearly all of their purchases in a typical week, compared with 28% of Latinos and 19% of whites.

In addition, Americans under the age of 50 are less reliant on cash than those 50 and older – although these differences are somewhat less pronounced than are those pertaining to income and race. Some 28% of Americans ages 18 to 49 say that they make none of their purchases using cash in a typical week, compared with 20% of those ages 50 and older.

And while 24% of Americans indicate that they make no cash purchases during a typical week, an even larger share – 39% – indicates that they don’t particularly worry about having cash on hand at all times, since there are plenty of other ways to pay for things if they’re short on cash. On the other hand, 60% of Americans try to make sure that they have at least some cash on hand, just in case they need it. And as was true of the way they pay for purchases, Americans under the age of 50 are more likely than older adults to say that they don’t really worry about having cash on hand due to the range of other payment options available to them: 45% of 18- to 49-year-olds say this, compared with 31% of those 50 and older.

Around half of Americans have heard of the alternate currency bitcoin – but just 1% have actually used bitcoins themselves

Recently an entirely new type of alternative currency has emerged in the form of virtual “cryptocurrencies.” The most widely recognized of these virtual currencies is bitcoin, whose mysterious origin was the subject of a Newsweek cover feature. This survey finds that awareness of bitcoin is quite high: Overall, around half of Americans (48%) indicate that they have heard of bitcoin. Men are significantly more likely than women to have heard of bitcoin (60% vs. 37%), and a substantially larger share of whites have heard of bitcoin (54%) than blacks (28%) or Latinos (33%). College graduates (73% of whom have heard of bitcoin) and those from households earning $75,000 or more per year (69%) also have especially high levels of awareness.

But although many Americans have heard of bitcoin, actual usage is much rarer: just 1% of Americans say they have ever collected, traded or used bitcoin.

Acknowledgments

This report was made possible by The Pew Charitable Trusts. It is a collaborative effort based on the input and analysis of the following individuals:

Primary researchers

Aaron Smith, Associate Director, Research Monica Anderson, Research Associate Maeve Duggan, Research Associate        

Research team

Lee Rainie, Director, Internet, Science and Technology Research Kyley McGeeney, Research Methodologist Cary Funk, Associate Director, Research Nicholas Hatley, Research Assistant Kenneth Olmstead, Research Associate 

Editorial and graphic design

Margaret Porteus, Information Graphics Designer Shannon Greenwood, Copy Editor

Communications and web publishing

Dana Page, Senior Communications Manager Shannon Greenwood, Associate Digital Producer

Methodology

The American Trends Panel (ATP), created by Pew Research Center, is a nationally representative panel of randomly selected U.S. adults living in households. Respondents who self-identify as internet users and who provided an email address participate in the panel via monthly self-administered web surveys, and those who do not use the internet or decline to provide an email address participate via the mail. The panel is being managed by Abt SRBI.

Data in this report are drawn from the December wave of the panel, conducted Nov. 24-Dec. 21, 2015, among 4,787 respondents (4,317 by web and 470 by mail). The margin of sampling error for the full sample of 4,787 respondents is plus or minus 1.94 percentage points.

Members of the American Trends Panel were recruited from two large, national landline and cellphone random-digit-dial (RDD) surveys conducted in English and Spanish. At the end of each survey, respondents were invited to join the panel. The first group of panelists was recruited from the 2014 Political Polarization and Typology Survey, conducted from Jan. 23 to March 16, 2014. Of the 10,013 adults interviewed, 9,809 were invited to take part in the panel and a total of 5,338 agreed to participate.1 The second group of panelists was recruited from the 2015 Survey on Government, conducted from Aug. 27 to Oct. 4, 2015. Of the 6,004 adults interviewed, all were invited to join the panel and 2,976 agreed to participate.2

Participating panelists provided either a mailing address or an email address to which a welcome packet, a monetary incentive and future survey invitations could be sent. Panelists also receive a small monetary incentive after participating in each wave of the survey.

The ATP data were weighted in a multistep process that begins with a base weight incorporating the respondents’ original survey selection probability and the fact that in 2014 some panelists were subsampled for invitation to the panel. Next, an adjustment was made for the fact that the propensity to join the panel and remain an active panelist varied across different groups in the sample. The final step in the weighting uses an iterative technique that matches gender, age, education, race, Hispanic origin and region to parameters from the U.S. Census Bureau’s 2013 American Community Survey. Population density is weighted to match the 2010 U.S. Decennial Census. Telephone service is weighted to estimates of telephone coverage for 2015 that were projected from the July-December 2014 National Health Interview Survey. It also adjusts for party affiliation using an average of the three most recent Pew Research Center general public telephone surveys and for internet use using as a parameter a measure from the 2014 Survey of Political Polarization. Sampling errors and statistical tests of significance take into account the effect of weighting. Interviews are conducted in both English and Spanish, but the Hispanic sample in the American Trends Panel is predominantly native born and English speaking.

The following table shows the unweighted sample sizes and the error attributable to sampling that would be expected at the 95% level of confidence for different groups in the survey:

Sample sizes and sampling errors for other subgroups are available upon request.

In addition to sampling error, one should bear in mind that question wording and practical difficulties in conducting surveys can introduce error or bias into the findings of opinion polls.

The web component of the December wave had a response rate of 68.4% (4,317 responses among 6,308 web-based individuals in the panel); the mail component had a response rate of 66% (417 responses among 712 non-web individuals in the panel). Taking account of the combined, weighted response rate for the recruitment surveys (10.0%) and attrition from panel members who were removed at their request or for inactivity, the cumulative response rate for the December ATP wave is 3%.3