Pew Research Center

FOR RELEASE DECEMBER 21, 2015

Home Broadband 2015

The share of Americans with broadband at home has plateaued, and more rely only on their smartphones for online access

BY John B. Horrigan and Maeve Duggan

FOR MEDIA OR OTHER INQUIRIES:

Communications Department
202.419.4372
www.pewresearch.org

RECOMMENDED CITATION

Pew Research Center, December 2015, "Home Broadband 2015"

About Pew Research Center

Pew Research Center is a nonpartisan, nonadvocacy fact tank that informs the public about the issues, attitudes and trends shaping the world. It does not take policy positions. The Center conducts public opinion polling, demographic research, computational social science research and other data-driven research. It studies politics and policy; news habits and media; the internet and technology; religion; race and ethnicity; international affairs; social, demographic and economic trends; science; research methodology and data science; and immigration and migration. Pew Research Center is a subsidiary of The Pew Charitable Trusts, its primary funder.

© Pew Research Center 2026

Table of contents

  • About Pew Research Center
  • Home Broadband 2015
  • 1. Home broadband adoption: Modest decline from 2013 to 2015
  • 2. The growing value people place on broadband
  • 3. Barriers to broadband adoption: Cost is now a substantial challenge for many non-users
  • 4. One-in-seven Americans are television “cord cutters”
  • Acknowledgments
  • Methodology
  • Appendix

Home Broadband 2015

The share of Americans with broadband at home has plateaued, and more rely only on their smartphones for online access

Three notable changes relating to digital access and digital divides are occurring in the realm of personal connectivity, according to new findings from Pew Research Center surveys. First, home broadband adoption seems to have plateaued. It now stands at 67% of Americans, down slightly from 70% in 2013, a small but statistically significant difference which could represent a blip or might be a more prolonged reality. This change moves home broadband adoption to where it was in 2012.
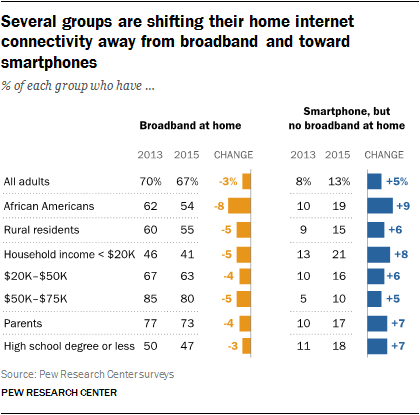
Several groups are shifting their home internet connectivity away from broadband and toward smartphones

Second, this downtick in home high-speed adoption has taken place at the same time there has been an increase in “smartphone-only” adults – those who own a smartphone that they can use to access the internet, but do not have traditional broadband service at home. Today smartphone adoption has reached parity with home broadband adoption (68% of Americans now report that they own a smartphone), and 13% of Americans are “smartphone-only” – up from 8% in 2013. Some of the most significant changes in these adoption patterns are taking place among African Americans, those with relatively low household incomes and those living in rural areas.
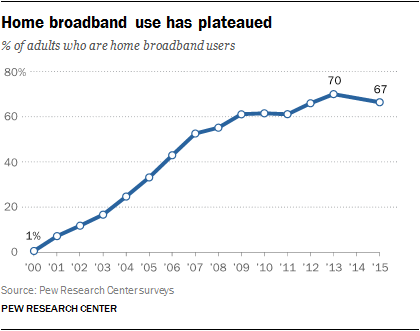
Home broadband use has plateaued

Third, 15% of American adults report they have become “cord cutters” – meaning they have abandoned paid cable or satellite television service. Many of these cord cutters say that the availability of televised content from the internet and other sources is a factor in their move away from subscription television services.

Those who are smartphone-reliant face challenges

At one level, the picture in these new data can be viewed benignly by those who are concerned about connectivity and digital divides. Overall, “advanced internet access” – that is, those with either a smartphone or a home broadband subscription – has changed little since 2013. Some 80% of adults have either a smartphone or a home broadband subscription in 2015, compared with 78% who said this in 2013.

Still, the fact that more Americans have only a smartphone for online access at home has consequences for how people get information. Those who are “smartphone-dependent” for access do encounter distinct challenges. Previous Pew Research Center findings show that they are more likely than other users to run up against data-cap limits that often accompany smartphone service plans. They also more frequently have to cancel or suspend service due to financial constraints. Additionally, a recent Pew Research Center survey found that those who use digital tools for job searches face challenges when it comes to key tasks such as filling out job applications and writing cover letters.

In general, when given a choice, people prefer to use their smartphone for getting in touch with family or friends but, for watching video, they prefer a device with a larger screen that uses a home broadband connection. At the same time, many “smartphone-only” users say that the reason they do not have broadband at home is because their smartphone lets them do all they need to do online, underscoring the device’s utility for those without a home high-speed subscription.

More people now say home broadband access is important

As these changes have unfolded, two other shifts underscore the tension between the potential benefits that digital technologies provide and the day-to-day financial constraints of many households. On one hand, Americans – both broadband users and those who do not have broadband – are increasingly likely to view home broadband as a key tool for accessing information that is important to their lives. But at the same time, the monthly cost of broadband service is now cited by a plurality of non-adopters as the most important reason for not having a home broadband subscription:

  • Cost is the major reason most people do not have broadband connections

    Roughly two-thirds (69%) of Americans indicate that not having a home high-speed internet connection would be a major disadvantage to finding a job, getting health information or accessing other key information – up from 56% who said this in 2010.

  • Among non-broadband adopters, 33% cite the monthly cost of service as the main reason they lack broadband at home, with an additional 10% citing the cost of a computer as their main reason for not having broadband service.

These changes are related: Non-broadband adopters who view a lack of home service as a major disadvantage are also more likely to cite the monthly cost of broadband as the primary reason they do not subscribe. Price sensitivity, in other words, is greatest among those who are most likely to see the advantages of a home broadband subscription.

Non-broadband users now show a strong appreciation of the importance of home service in ways they did not five years ago

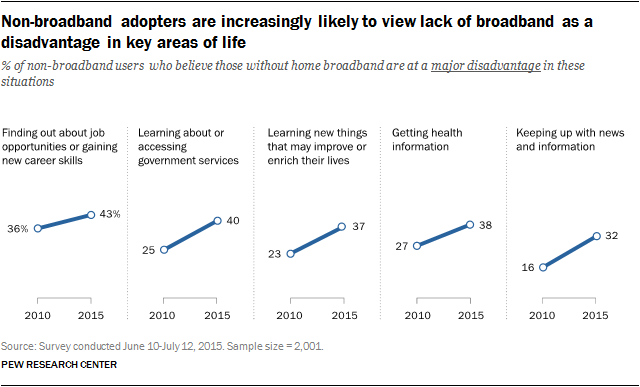
In 2010 and 2015, Pew Research Center asked Americans whether they thought being without a home broadband connection was a major disadvantage in several different topical areas. There has been a substantial increase over that period in the share of adults who say that not having a home high-speed connection is a major disadvantage when looking for job opportunities, accessing government information and in other areas.

In addition, those without home high-speed service are much more likely now than in the past to say that lacking a home subscription is a major disadvantage when it comes to accessing government services, searching for employment, following the news, learning new things, or getting health information. Today, two-thirds (65%) of non-adopters say that lacking home broadband service is a major disadvantage in at least one of these areas, compared with just under half (48%) who said so in 2010. Specifically:

  • 40% of non-high speed users say that being without broadband is a major disadvantage for learning about or accessing government services, compared with 25% who said this in 2010.
  • 37% say that lacking broadband at home is a major disadvantage for learning new things that might enrich their lives, up from 23% in 2010.

Non-broadband adopters are increasingly likely to view lack of broadband as a disadvantage in key areas of life

There are other signs that people are changing connection patterns: 15% of American adults are “cord cutters” who used to have cable or satellite TV, but currently do not
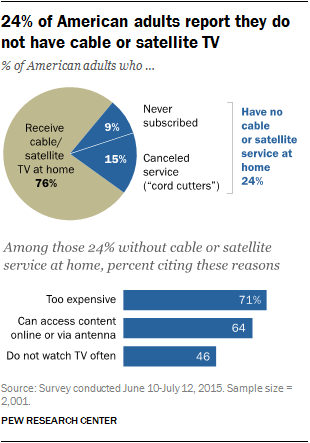
24% of American adults report they do not have cable or satellite TV

The changes in home broadband and smartphone connectivity are not the only shifting trends in connectivity among Americans. Some 15% of adults now qualify as “cord cutters” – meaning they once had either cable or satellite TV but no longer do. Another 9% never had either cable or satellite service.

Young adults are the most likely cord cutters; 19% of adults between the ages of 18 and 29 have severed the ties that they once had with cable or satellite service. Another 16% of young adults say they have never had pay TV in the first place.

Affordability is a main driver for those without cable or satellite, as is the ability to view the content they want to watch somewhere else. Some 71% of those without cable or satellite say they lack these services in part because the cost is too expensive, while 64% say they can access the content they want using an over-air antenna, on the internet or using streaming services.

Other key findings from the new survey include:

Large numbers of non-broadband households have never had home high-speed service in the past, and few have interest in subscribing in the future.

Overall, 33% of American adults do not have broadband at home. Within this group of non-adopters, 36% had a subscription in the past, while 59% say they have never had a broadband subscription plan at home. In addition, just 25% of non-adopters are interested in subscribing to broadband service in the future, while 70% say they are not interested in doing so.

The upshot is that, looking across the 33% of adults who are non-adopters of home broadband, nearly half (46%) seem unlikely to purchase home broadband service any time soon, in that that they have never had broadband in the past and also say that they are not interested in getting service in the future.

Among non-adopters, price sensitivity – where the monthly cost of service is the chief barrier to adoption – is most prominent among those who have had service in the past, and/or are interested in getting it in the future.

Some 40% of non-adopters who have had service in the past, or are interested in subscribing in the future, say the monthly cost of a subscription is the most important reason they lack service currently. On the other hand, 25% of those who are “hard-to-reach” – meaning they have never had broadband service and express no interest in having it in the future – say price is the most important barrier to adoption.

Most of the material in this report – specifically the findings on barriers to broadband adoption, how people view lack of broadband as a disadvantage, and cord cutting – is based on a national telephone survey of 2,001 Americans ages 18 and older conducted between June 10 and July 12, 2015. Comparison of 2013 and 2015 results for broadband and “smartphone-only” adoption are based on a September 2013 survey of 6,010 adults and a combined analysis of surveys conducted March 17-April 12, 2015 (1,934 adult respondents); June 10-July 12, 2015 (2,001 respondents); and October 13 -November 15, 2015 (2,752 respondents), for a total of 6,687 respondents cases for analysis.
1. Home broadband adoption: Modest decline from 2013 to 2015

Broadband adoption in the United States has experienced a modest decline in recent years, falling from 70% in 2013 to 67% in 2015. Those figures compare a September 2013 Pew Research Center survey that has a large sample size of 6,010 adults with combined surveys from April, July and November 2015 that total 6,687 adult respondents. These changes in home broadband adoption are concentrated among lower- to middle-income households, rural households and African Americans. There has also been a drop in home broadband adoption among parents of children under the age of 18.

Smartphones keep overall advanced internet access steady, although more Americans are “smartphone-only”

As Pew Research Center surveys have documented, smartphones have rapidly become a staple for many Americans. Our July 2015 survey shows that 68% of Americans now have a smartphone, an increase from 55% two years ago. This increase in smartphone adoption has compensated for the downturn in home broadband adoption in two ways:

  • More Americans are more likely to have both means of online access (in other words, a smartphone as well as home broadband service) than was the case two years ago. As of July 2015, 55% of adults report having both a smartphone and a home broadband subscription, up from 47% in 2013.
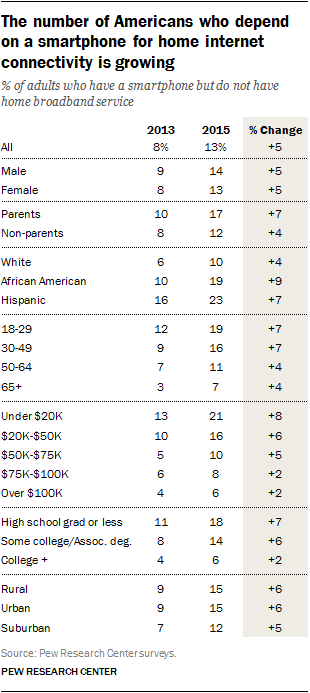
  • More Americans are “smartphone-only” in 2015 than was the case in 2013. Today 13% of adults rely on their smartphone for online access at home (that is, they have a smartphone but no home broadband subscription), compared with 8% in 2013.
The number of Americans who depend on a smartphone for home internet connectivity is growing

The consequence is that the “advanced internet access” picture, which we define as having either a smartphone or a home broadband subscription, has changed little between 2013 and 2015. Today 80% of American adults have either a smartphone or a home broadband connection, a small change from 2013, when 78% had one of these two access means.1

The increase in “smartphone-only” adoption mirrors the decline in home broadband adoption

The increase in the “smartphone-only” phenomenon largely corresponds to the decrease in home broadband adoption over this period. The rise in “smartphone-only” adults is especially pronounced among low-income households (those whose annual incomes are $20,000 or less) and rural adults. African Americans, who saw a marked decline in home broadband adoption, also exhibited a sharp increase in “smartphone-only” adoption (from 10% to 19%), as did parents with school-age children (from 10% in 2013 to 17% in 2015).

Previous Pew Research Center surveys have explored various challenges that the “smartphone-dependent” face. In particular, those who have smartphones only or have limited online access options tend to be younger, lower-income, and are more likely to be non-white. They also are more likely than other users to run up against data-cap limits that often accompany smartphone service plans, and more frequently have to cancel or suspend service due to financial constraints.

The increase in “smartphone-only” adoption, along with the corresponding decline in home broadband subscriptions, captures two facets of contemporary society: rapid innovation in the information technology space and stagnant household incomes. The rate of adoption of smartphones since the introduction of the iPhone in 2007 has been striking. It has taken about half the time for smartphone adoption to double from one-third of adults to two-thirds than was the case for broadband – which was also a technology adopted by Americans at very rapid pace.2

At the same time that innovation in information technology has transformed people’s communications patterns in the past decade, household incomes have declined relative to year 2000 levels, according to a new analysis by Pew Research Center. Notwithstanding some gains in recent years, U.S. median household income in 2014 was still below its level at the start of the Great Recession in 2007. The losses were greatest among lower- and middle-income households in which nearly 8-in-10 American adults reside. Given the role that affordability of service plays in people’s choice to forgo a home broadband subscription (see Section III below), strained household budgets may play a role in the drop in high-speed subscriptions. Smartphones help fill the access gaps for some of these households, particularly as people increasingly see home broadband access as crucial in a variety of areas.

2. The growing value people place on broadband

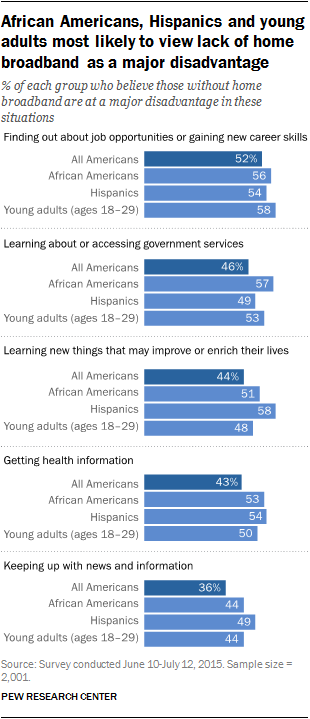
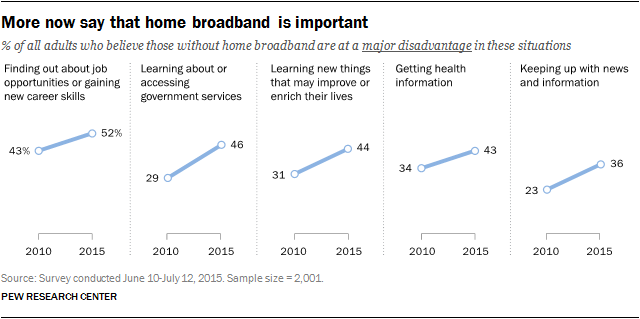
As these shifts in technology adoption patterns are unfolding, Americans are increasingly likely to view home broadband service as important to accessing information or carrying out a variety of important tasks. A substantial majority of Americans feel that people without home broadband service are at a disadvantage when it comes to keeping up with news or information, getting health information, learning new things, accessing government services or engaging in a job search. Indeed, 52% of Americans feel that non-broadband adopters are at a major disadvantage when it comes to accessing job opportunities or improving their career skills. Approaching half (46%) say lacking broadband is a major disadvantage for accessing or learning about government services.

Taken together, 69% of Americans believe that people lacking broadband at home are at a major disadvantage in at least one of these five areas (getting news and information, getting health information, learning new things, accessing government services or looking for job opportunities).

Not only do most Americans say that not having a broadband subscription at home is a major disadvantage, but more say this in 2015 than was the case in 2010.

More now say that home broadband is important

More than half (56%) of all adults in 2010 said not having broadband was a major disadvantage in at least one of these areas – a figure well below the 69% level for 2015 in the same five areas of inquiry.

African Americans, Hispanics and young adults most likely to view lack of home broadband as a major disadvantage

African Americans, Hispanics and young adults are generally more likely to view the lack of home high-speed access as a major disadvantage in various facets of people’s lives. For African Americans, this is true particularly for getting health care information and learning about or accessing government services. Among Hispanics, the difference is largest, relative to the average, for learning about things that might improve or enrich their lives.

In general, non-broadband adopters are less likely to see the lack of a home broadband subscription as a major disadvantage when compared to broadband users. But at the same time, these non-adopters are substantially more likely to view a lack of broadband service as a disadvantage than was the case in 2010. In some cases, such as for accessing government services and keeping up with news and information, the share of non-home high-speed users who see not having service as a major disadvantage has grown markedly since 2010. In fact, the bulk of the overall increase since 2010 in Americans’ views about the importance of broadband is attributable to increases among home non-broadband users.

In 2015, 65% of non-broadband households say not having service is a major disadvantage in one of the five areas listed in the chart above. That compares with 69% among all Americans and 70% for those in households with a broadband subscription.

By contrast, in 2010, 48% of respondents without a home high-speed connection said the lack of service was a major disadvantage; that compared with 56% among all adults and 61% for broadband households.

Scrutinizing those numbers closely suggests that non-broadband households, over the five year time interval, showed a larger growth in the sense that not having a home high-speed connection conferred disadvantages. In fact, the growth in the share of non-adopting households seeing the lack of broadband as a disadvantage is more than twice the rate of that for broadband adopters – a 35% to 15% margin.

Non-broadband adopters are increasingly likely to view lack of broadband as a disadvantage in key areas of life

3. Barriers to broadband adoption: Cost is now a substantial challenge for many non-users

For the 33% of Americans who do not currently have broadband service at home, financial concerns – the monthly cost of a broadband subscription most prominently, but also the cost of a computer – loom large as barriers to non-adoption. At the same time, for many non-broadband users who own a smartphone, the functionality of these mobile devices makes traditional broadband a lesser priority. Still, other non-adopters indicate that they have options for online service outside their home, or that suitable broadband service is hard to get in their area.

Non-broadband users cite a number of reasons why they do not use high-speed connections

Most non-users point toward multiple reasons for why they do not have high-speed service at home. The typical (median) non-broadband user cites two reasons for not subscribing to home broadband service, while 43% list three reasons or more.

In some form, cost is the chief reason that non-adopters cite when permitted to identify more than one reason they do not have a home high-speed subscription. Overall, 66% of non-adopters point toward either the monthly service fee or the cost of the computer as a barrier to adoption.

When presented with a follow-up question asking them to identify the most important reason they do not have a home broadband subscription, non-adopters are again more likely to cite the monthly cost of broadband service than any other reason. Smartphone users differ in that the capability of their smartphone rivals the monthly cost of broadband as the main reason they go without service.

Cost is the most important barrier to adopting broadband

Price sensitivity – the sense that the monthly fee is too much – is a larger concern for non-adopters who are more likely to recognize the importance of a home high-speed connection. As noted earlier, two-thirds (65%) of non-adopters in 2015 say that being without broadband at home is a major disadvantage of some sort – an increase from 48% who said this in 2010 across the same five subject areas. Among the 2015 group of non-adopters who see lacking broadband as a major disadvantage, 38% cite price as their main barrier to adoption. This compares with just 22% who cite the monthly service fee as their primary barrier among non-users who do not see home broadband service as particularly critical.

The inverse relationship is worth emphasis. Many more non-adopters in 2015 say that being without broadband is a major hindrance in some way than said so in 2010. As this view of the importance of a home high-speed subscription has grown, so has the sense that the monthly fee is the sticking point in having home service.

A majority of non-broadband users have never had broadband at home, and just one-quarter of them are interested in getting it in the future

Some 36% of non-broadband users say they had high-speed service at home in the past, while 59% indicate that they have never had a home broadband subscription. And just one-quarter (25%) of non-broadband users say they are interested in having broadband internet service at home in the future, while 70% are not interested.

Those who say they had high-speed internet service at home in the past tend to be relatively young. More than half (56%) of those who once had service are under age 50, compared with 34% of those who never had broadband. It is also notable that parents with children who are minors (under the age of 18) at home are more likely to have had broadband in the past than non-parents; among those who had service in the past, 30% are parents with minor children, while 19% of those who never had service are parents of minor children.

Nearly half of those who do not have broadband at home – or 15% of all Americans – are in a “hard-to-reach” category that suggests they may not be broadband subscribers any time soon

The survey asked non-broadband users whether they ever had service at home and whether they have interest in subscribing in the future. Those who answered in the negative for both questions – that is, those who have never had broadband in the past and do not have an interest in subscribing to service in the future – come to 46% of all non-adopters. They fall into the “hard-to-reach” category of non-adopters, not only because of their stated preferences and past behavior. They also, demographically, contrast sharply with other non-adopters on characteristics that align with a low likelihood of home broadband adoption. The “hard-to-reach” are:

  • less educated: Just 8% of the “hard-to-reach” have a college degree, compared with 14% of other non-adopters;
  • older: 39% of the “hard-to-reach” are age 65 or older, compared with 19% for remaining non-adopters;
  • less connected to technology: Just 44% of the “hard-to-reach” are internet users, and just 29% have smartphones; the figures for other non-adopters are 72% and 53% respectively.
“Hard-to-reach” are less likely to cite monthly fee as their most important reason for not having home broadband service

The other notable characteristic of the “hard-to-reach” is that they are less likely to cite the monthly access fee as their most important reason for not having service.

Barriers to smartphone adoption: Cost is cited most frequently as the main reason people do not have a smartphone, though many say they simply do not need one

One-third of Americans do not have a smartphone. These are the reasons they provide when asked to identify the main reason they do not have this type of device:

  • 36% indicate that smartphones are too expensive (either the data plan or the device itself);
  • 29% say they do not need one or are happy with their current phone;
  • 15% are uninterested in getting one or have not gotten around to it;
  • 9% say it is too complicated.

The reasons cited are very similar to what non-smartphone users said in 2012, when 45% of adults had a smartphone.

4. One-in-seven Americans are television “cord cutters”

An additional element in people’s portfolio of tools to access information is more traditional – whether they have a subscription to a cable or satellite television service. A shift in how people watch TV is underway, as the new Pew Research Center data suggest 15% of American adults are now “cord cutters” – that is, they indicate that they once had a cable or satellite TV connection, but no longer subscribe. Another 9% of Americans have never had a cable or satellite subscription at all, meaning that a total of 24% of Americans currently do not subscribe to cable or satellite TV in their homes (76% of Americans subscribe to pay TV service at home).

There are generational aspects to this phenomenon, as young adults are the least likely age group to have a cable or satellite subscription. Some 65% of those ages 18 to 29 have cable or satellite service at home, compared with 73% of adults ages 30 to 49 and 83% of those 50 or older. One-sixth of young adults (16%) report they never had a cable or satellite subscription, while 19% “cut the cord.”

For these young people, alternative access to content is crucial. Some 75% of young adults without a cable or satellite subscription say they can access content they want to watch either online – perhaps by binge watching their favorite shows through an online service like Netflix, Hulu or Amazon Prime – or via an over-the-air antenna. Overall, 64% of those without cable or satellite TV cite alternative access to content as a reason they do not have cable or satellite service at home.

Income also comes into play for those without pay TV. Some 63% of homes with annual incomes under $20,000 have either cable or satellite service, compared with 86% of households whose annual income exceeds $75,000. Cord cutters are more likely to live in lower income households as well. In homes whose annual incomes are $20,000 or below, 21% have cut the cord, while 14% of households above that income threshold have cut the cord.

In the context of their other digital access tools, cord cutters – as well as those without cable or satellite services more broadly –exhibit slightly different adoption patterns from the population as a whole. For those without cable or satellite service at home:

  • 70% have smartphones;
  • 54% have a home broadband subscription;
  • 25% are “smartphone-only.”

In terms of overall “advanced internet access,” (that is, a broadband subscription and/or a smartphone) those without a paid TV subscription show about the same level as the population as a whole – 80% for them, compared with 81% for all adults.

For “cord cutters,” (the 15% of all adults who once had a cable or satellite subscription but no longer do) the access patterns look like this:

  • 75% have smartphones;
  • 58% have a home broadband subscription;
  • 27% are “smartphone-only.”

Just over four-in-five (84%) have “advanced internet access,” that is either a smartphone or home broadband subscription.

Those without pay TV – and cord cutters especially –rely on a different mix of access tools for digital content, a mix that emphasizes smartphones over a home broadband subscription. And these preferences are driven in many cases by affordability. Some 71% of those without cable or satellite say these services are too expensive for them, with 74% of cord cutters saying this.

Acknowledgments

This report is a collaborative effort based on the input and analysis of the following individuals:

Primary researchers

John B. Horrigan, Senior Researcher Maeve Duggan, Research Associate

Research team

Lee Rainie, Director, Internet, Science, and Technology Research Aaron Smith, Associate Director, Research Andrew Perrin, Research Assistant Claudia Deane, Vice President, Research

Editorial and graphic design

Margaret Porteus, Information Graphics Designer Shannon Greenwood, Copy Editor

Communications and web publishing

Shannon Greenwood, Assistant Digital Producer Dana Page, Senior Communications Manager

Methodology

Much of the analysis in this report is based on a Pew Research Center survey conducted June 10-July 12, 2015 among a national sample of 2,001 adults, ages 18 years and older, living in all 50 U.S. states and the District of Columbia (701 respondents were interviewed on a landline telephone, and 1,300 were interviewed on a cellphone, including 749 who had no landline telephone). Specifically, findings pertaining to non-adopters and their reasons for not having service, people’s views on the disadvantages of not having broadband, and cord cutters, are based on the July 2015 survey.

Analysis of change in broadband and “smartphone-only” adoption from 2013 to 2015 are based on a September 2013 survey of 6,010 adults, ages 18 years and older, and combined surveys from April 2015 (1,934 adults); July 2015 (2,001 adults); and November 2015 (2,752 adults), for a total of 6,687 adult respondents.

The survey was conducted by interviewers at Princeton Data Source under the direction of Princeton Survey Research Associates International. A combination of landline and cellphone random digit dial samples were used; both samples were provided by Survey Sampling International. Interviews were conducted in English and Spanish. Respondents in the landline sample were selected by randomly asking for the youngest adult male or female who is now at home. Interviews in the cell sample were conducted with the person who answered the phone, if that person was an adult (age 18 or older). For detailed information about our survey methodology, see https://alpha.pewresearch.org/pewresearch-org/methodology/u-s-survey-research/ .

The combined landline and cellphone sample is weighted using an iterative technique that matches gender, age, education, race, Hispanic origin and nativity and region to parameters from the 2013 Census Bureau’s American Community Survey and population density to parameters from the Decennial Census. The sample also is weighted to match current patterns of telephone status (landline-only, cellphone-only or both landline and cellphone), based on extrapolations from the 2014 National Health Interview Survey. The weighting procedure also accounts for the fact that respondents with both landline and cellphones have a greater probability of being included in the combined sample, and adjusts for household size among respondents with a landline phone. The margins of error reported and statistical tests of significance are adjusted to account for the survey’s design effect, a measure of how much efficiency is lost from the weighting procedures.

The following table shows the unweighted sample sizes and the error attributable to sampling that would be expected at the 95% level of confidence for different groups in the July 2015 survey:

Sample size 1

The table below shows the unweighted sample sizes and the error attributable to sampling that would be expected at the 95% level of confidence for different groups in the September 2013 survey and the combined April, July and November 2015 surveys:

Sample size 2

Sample sizes and sampling errors for other subgroups are available upon request.

Appendix

% of adults who have home broadband

% of adults who have home broadband

% of adults who are smartphone-only

% of adults who are smartphone-only