Pew Research Center

FOR RELEASE JULY 23, 2015

An Elaboration of AAAS Scientists’ Views

A deeper examination of views about key science topics by members of the American Association for the Advancement of Science

FOR MEDIA OR OTHER INQUIRIES:

Communications Department
202.419.4372
www.pewresearch.org

RECOMMENDED CITATION

Pew Research Center, July 2015, "An Elaboration of AAAS Scientists’ Views"

About Pew Research Center

Pew Research Center is a nonpartisan, nonadvocacy fact tank that informs the public about the issues, attitudes and trends shaping the world. It does not take policy positions. The Center conducts public opinion polling, demographic research, computational social science research and other data-driven research. It studies politics and policy; news habits and media; the internet and technology; religion; race and ethnicity; international affairs; social, demographic and economic trends; science; research methodology and data science; and immigration and migration. Pew Research Center is a subsidiary of The Pew Charitable Trusts, its primary funder.

© Pew Research Center 2026

Table of contents

  • About Pew Research Center
  • An Elaboration of AAAS Scientists’ Views
  • Why Elaborate on Scientists’ Views?
  • Elaborating on the Views of AAAS Scientists, Issue by Issue
  • Characteristics of the Sample
  • About this Report
  • About the Survey

An Elaboration of AAAS Scientists’ Views

A deeper examination of views about key science topics by members of the American Association for the Advancement of Science

In January 2015, the Pew Research Center released findings from two surveys; the findings illustrated substantial gaps on major science issues between the views of citizens and U.S. members of the American Association for the Advancement of Science (AAAS), the world’s largest multidisciplinary scientific professional society, despite broadly similar views about the contributions of science and the overall place of science in American society. Established in 1848, the AAAS publishes Science magazine, one of the most widely circulated peer-reviewed scientific journals in the world. It is an open-member organization that brings together a wide segment of the scientific community.

The 111-page report and 34-page follow-up report on the results of the surveys focused primarily on the views of AAAS members as a whole. A key strength of this group as a window into the views of the scientific community stems from the breadth of their disciplinary backgrounds and experiences. At the same time, findings among AAAS members as a whole also leave important questions. For instance, do scientists who work in particular disciplines have views on issues that are different from those with other disciplinary backgrounds? Our survey showed that 87% of the AAAS members surveyed believe that climate change is caused by humans; is that figure even higher among Earth scientists or others whose work centers on ecology and the environment?

Another question: Do scientists who are actively engaged in research have different views from others who may be less embedded in producing scientific research? Fully 88% of AAAS members in the sample believe that genetically modified foods are safe to eat; is there agreement on this issue among active research scientists and AAAS members who have not recently received research grants?

While we cannot address every question about views in the scientific community, our sample of AAAS membership is broad enough and deep enough to allow for more in-depth exploration of views among key subgroups. In particular, the sample allows us to distinguish between AAAS members based on their education, training, engagement with research and current employment status. Compared with our earlier releases based on the AAAS survey, this report provides a more finely grained portrait of scientists.

We recognize that definitions of who is a “scientist” and what is “science” vary.1 Moreover, we understand that there are many useful ways to examine the views of scientists; Pew Research Center will continue to explore these issues and ways that subgroups of scientific experts think about them in the coming years. The AAAS sample, therefore, is hopefully the first in a series of avenues for empirically documenting whether there are differences in views among subsets of the scientific community.2 To that end, this analysis compares views among the full sample of 3,748 AAAS members with those AAAS members who fall into three narrower definitions of the term “scientist.”

Some differences and similarities in views among AAAS members, such as discipline groups, were also noted in the prior Pew Research reports. This report looks in more detail at views among subgroups of AAAS members.

  1. Narrower Subgroups Among All AAAS Members Surveyed

    Working Ph.D. Scientists (N=1,627): 

    One group we analyze meets a narrower definition of scientist; the group includes only those with the highest-level training (either a Ph.D. or medical-related doctorate) in fields related to the medical, natural or physical sciences and who are currently in the full-time workforce. This narrower set of fields includes those who identify their primary discipline as: biology/medicine, chemistry, Earth sciences, physics and astronomy or math and computer sciences. It omits engineers connected with the AAAS, as well as those who identify their primary discipline as a social science, history or policy science, and it omits those who identify their primary discipline as something outside of these broad categories.
  2. Active Research Scientists (N=1,246): A second, even more narrow, group we call “Active Researchers” is made up of the subset of AAAS members who report having received a research grant (from any funding source) within the past five years, and who meet all of the criteria outlined above as a “Working Ph.D. Scientist.” These research grants are, primarily, federal grant funds, but some are based on state-level, industry, private or other funding sources.
  3. Domain Experts: The third group is narrower still. We isolate for analysis those in the AAAS member sample whose specialty area is particularly relevant to the policy area explored in our question. For example, when looking at views on space issues, we highlight the opinions of AAAS members who identify as physicists and astronomers, as well as those who are engineers. For our questions on global warming, we highlight the views of Earth scientists. We also show AAAS members in each discipline who have a doctorate degree and are in the full-time workforce for those interested in the opinions of a narrower group of domain experts. Even so, it is worth noting that AAAS members within each discipline may or may not have specialized expertise in the specific topics of the survey such as GMOs, vaccines or climate science. We don’t know whether the biomedical scientists in the AAAS sample have a specialized expertise on childhood vaccines, for example. In some ways, then, even these domain expert comparisons could be seen as broad slices of the relevant scientific community.

Obviously, these three groups of AAAS members are overlapping. They cover key sub-populations of AAAS scientists whose views might be relevant to those who want more in-depth insight our findings.

As suggested above, there are a large number of possible ways to think about relevant subgroups of scientists. We also provide a set of detailed appendix tables showing the policy views and characteristics of each primary discipline group among AAAS members, plus the views of those who are not in the subpopulations. These additional tables also show responses of those in the AAAS survey by respondents’ employment status, employment sector and education level.

Here are some of the patterns we find in this detailed analysis, which covers the 13 science issues Pew Research highlighted in our original report:

Views among AAAS members who meet narrower definitions of the term “scientist” closely resemble those for the AAAS sample as a whole.

Views among these more narrow subgroups of AAAS members are quite similar to those for the sample as a whole. For instance, 87% of all the AAAS members in our survey said they believe climate change is mostly due to human activity, compared with 88% of Working Ph.D. Scientists90% of Active Research Scientists and 93% of working Ph.D. Earth scientists who hold the same view.3 Similarly, 88% of all the AAAS members in the sample say it is safe to eat genetically modified foods, as do 90% of Working Ph.D. Scientists, 91% of Active Research Scientists, 92% of working Ph.D. biomedical scientists and 89% of working Ph.D. chemists.

Over the 13 issues queried in our surveys, the largest difference between all the AAAS members surveyed and Working Ph.D. Scientists is 4 percentage points. For example, 72% of Working Ph.D. Scientists say foods grown with pesticides are generally safe, as do 68% of all the AAAS members surveyed. On other topics, views between these two ways to think about the scientific community connected with the AAAS are the same or roughly the same. For example, 65% of all AAAS members surveyed favor building more nuclear plants, the same share as among Working Ph.D. Scientists.

Opinion Differences Between Public and AAAS Scientists

Similarly, views among Active Research Scientists and the full AAAS sample are quite similar; differences between the groups range from 1 percentage point to 4 percentage points on these issues. For example, 92% of Active Research Scientists in this sample favor the use of animals in scientific research, compared with 89% among all AAAS members surveyed. Views among domain experts are more varied with few or modest differences on some topics and substantial opinion differences across disciplinary groups on other topics. We have more to say on these data below.

Certainly, one possible reason there is so little variance among those in the full sample and those in different, narrower groupings of scientists is that those in the narrower groups make up a significant portion of the full sample. We also show in Appendix A tables how the views of these various categories of scientists compare with those who are not in those groups.

Opinion Differences Between Public and AAAS Scientists, Among Selected Domain Experts

Narrowing the definition of scientist does not change the basic finding that the scientific community has notably different views from those of the general population on key science-related issues.

No matter how AAAS members are categorized, their views starkly differ from the public’s on key scientific issues such as global warming and its causes, human evolution, vaccination strategies and the safety of eating genetically modified foods or foods grown with pesticides.

To the extent that there are differences, the direction of opinion across these more narrowly defined subsets of AAAS members tends to place scientists’ opinions slightly further from those of the general public for all save one of the 13 topics. The exception concerns views about the benefits of government investment in the International Space Station. On that issue, 68% of all AAAS members surveyed, while 65% of Working Ph.D. Scientists, say the space station has been a good investment for the United States. Among the general public, 64% say the space station has been a good investment.

On topics related to their areas of expertise, the views of domain experts sometimes differ from the views of those in other scientific fields.

Opinions on these topics across disciplinary groups are more varied. On a topic such as evolution, there is near consensus among all disciplinary groups that humans and other living things have evolved over time. On other topics, there is more variety of opinion among those with disciplinary backgrounds related to the topic in question. On space issues, for example, AAAS physicists are less inclined than either engineers or all AAAS members to consider astronauts essential to the future of the U.S. space program. In addition, fewer AAAS physicists than either AAAS engineers or AAAS members as a whole consider government investment in the International Space Station to be good for the country. AAAS physicists also are somewhat more inclined than are Earth scientists to support building more nuclear power plants, although a majority of both groups favor building more such plants.

About the Survey

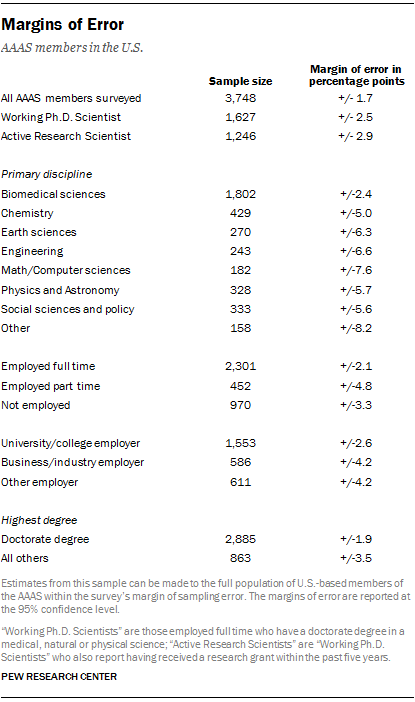
The survey was conducted online with a random sample of 3,748 U.S.-based members of AAAS from Sept. 11 to Oct 13, 2014. The margin of sampling error for estimates about the full U.S.-based membership of AAAS is +/- 1.7 percentage points. The margin of error for Working Ph.D. Scientists is +/- 2.5 percentage points; for Active Research Scientists it is +/- 2.9 percentage points. See Appendix B for details about the survey methodology.

Comparisons are made here to a survey of the general public conducted August 15-25, 2014, by landline and cellular telephone among a nationally representative sample of 2,002 adults. The survey tracks public attitudes about science in society and maps the contours of opinion on a wide range of issues within the domain of science and technology. The margin of error for results based on the full sample is +/- 3.1 percentage points. See the January 2015 report for more details.

Why Elaborate on Scientists’ Views?

This report revisits the subject matter of a January release in which Pew Research Center compared the public’s and scientists’ viewpoints on key scientific issues. Specifically, this report takes a closer look at how opinions vary among different groups of scientists.

There are several reasons to explore scientists’ views further. The first is to get closer to “the experts.” If specialized or more narrowly-defined communities of scientists have different views from the broader community of AAAS members, it could be an important insight into the current state of expert opinion.

A second, closely related, reason is to better understand the extent to which the perspectives of field experts are accepted by the broader scientific community. This could point to areas of broad scientific consensus, such as evolution, and areas where there is more division, such as space exploration and energy. As new scientific discoveries and thinking emerges, tracking the views of both domain-area specialists and broader scientific communities could illuminate the processes underlying the dissemination and acceptance of new scientific findings.

A third reason is to better document the boundaries of the scientific community. Understanding who counts as a scientist has long been a subject where seasoned analysts, along with the overall public, hold differences of opinion.4 Thus, it may be helpful to examine the views of subsets of AAAS members in order to empirically assess the degree to which narrowing the definition of scientist either strengthens or weakens the degree of consensus – and sense of coherent community – among those engaged with science.

Elaborating on the Views of AAAS Scientists, Issue by Issue

The following material covers the various views of subsets of AAAS members on each of the 13 issues that were highlighted in our original report about the gaps between scientists and citizens.

Climate Change

Widespread Agreement on Climate Change

There are wide differences between the general public and AAAS scientists overall when it comes to beliefs about climate change. Fully 87% of AAAS members say climate change is occurring due to human activity, 9% say climate change is mostly due to natural patterns and just 3% of this group says there is no solid evidence the Earth is getting warmer. By contrast, among the general public, half of adults say the Earth is warming due to human activity, 23% say warming is mostly due to natural patterns in the Earth’s environment, and a quarter (25%) say there is no solid evidence the Earth is warming.5

Scientists also are considerably more inclined than the general public as a whole to see climate change as a problem. Fully 77% of AAAS members say climate change is a very serious problem. In a 2015 Pew Research survey, 46% of U.S. adults said “global warming” was a very serious problem. The share of the general public saying that global warming is a very serious problem has fluctuated in Pew Research polling, between a low of 32% in 2010 to a high of 47% in 2009.

Views about climate change are quite similar among those in narrower and more specialized groups of scientists and the full AAAS sample: 88% of Working Ph.D. Scientists say the Earth is warming mostly due to human activity. And 90% of Active Research Scientists say the same. In 2009, 84% of all AAAS members surveyed said the Earth was warming mostly because of human activity.

Earth Scientists Views on Climate Change

An overwhelming majority of AAAS members across all major disciplines believe that climate change is mostly due to human activity. Those domain experts with a primary specialty in the Earth sciences hold about the same views as all AAAS members surveyed (89% say climate change is mostly due to human activity). The figure rises to 93% among Earth scientists with a doctorate degree who are currently in the full-time workforce.

Views about the seriousness of climate change also tend to be quite similar across subgroups of AAAS members, including those who are Working Ph.D. Scientists (78% say it is a very serious problem), Active Research Scientists (79%) and domain experts who are Earth scientists (77%).

The Pew Research findings on beliefs about climate change are broadly in keeping with a number of other studies, which have shown a high share of experts in the Earth sciences and climatology saying the Earth is warming due to human activity. For example, a survey conducted circa 2008 found 90% of Earth scientists saying average global temperatures had risen and 82% saying that human activity was “a significant contributing factor in changing mean global temperatures.” Those with more direct expertise in climate science were even more likely to say human activity was a significant factor in climate change: 98% of those in the most narrowly defined category of expertise said that in this sampling.6

Energy Issues

Offshore Drilling

Allowing More Offshore Oil Drilling

When it comes to offshore oil drilling, there is a 20-point gap between the public’s and AAAS members’ views. AAAS members oppose more offshore drilling by a margin of 66% to 32%. By contrast, about half of Americans (52%) favor allowing more offshore oil drilling in U.S. waters, while 44% are opposed.

Allowing More Offshore Oil Drilling

Views about offshore oil drilling are about the same among Working Ph.D. Scientists; 31% of this group favors allowing more offshore oil drilling and 67% opposes this. Views among Active Research Scientists are similar, with 30% in favor and 68% opposed to more offshore oil drilling.

A majority of domain experts in Earth science fields oppose more offshore oil drilling. By comparison, the engineers connected with the AAAS are more closely divided. A 56% majority of this group favors allowing more offshore drilling. And, the AAAS engineers who are employed full time are closely divided over offshore drilling, with 47% favoring and 50% opposed to allowing more offshore drilling.7

Building nuclear power plants

Building More Nuclear Power Plants

When it comes to nuclear power, there is a 20-point gap between AAAS members’ and the general public’s views, with the AAAS community more inclined than the general public to build more nuclear power plants. Fully 65% of AAAS members favor building more nuclear power plants, while 33% are opposed. Those figures are similar to the subsets of AAAS members who are Working Ph.D. Scientists and Active Research Scientists. By contrast, about half of Americans (51%) oppose building more nuclear power plants, while 45% are in favor.

A majority of AAAS members support more nuclear power plants, regardless of disciplinary specialty. Physicists and engineers are more strongly in favor of building more nuclear power plants than are those in other specialties. For example, 79% of all physicists surveyed and 75% of engineers connected with AAAS favor building more nuclear power plants. The views of Earth scientists are similar to those of all members; 66% among this group favor more nuclear power plants and 32% are opposed.

Some Variation in Views About Building More Nuclear Power Plants by Discipline

Hydraulic Fracturing

Increased Use of “Fracking”

A minority of the public (39%) supports the increased use of hydraulic fracturing (commonly known as fracking) to extract oil and natural gas from underground rock formations, while about half (51%) are opposed.8 By comparison, opinion about fracking among AAAS scientists is more negative: 31% of AAAS members surveyed favor the increased use of fracking while 66% are opposed. Similarly, 29% of Working Ph.D. Scientists favor fracking and 28% of Active Research Scientists say the same.

Increased Use of “Fracking”

However, scientists’ views about fracking vary across domains. AAAS-linked engineers favor the increased use of fracking by a margin of 53% to 45%. Among AAAS members with a specialty in the Earth sciences, support for fracking tilts more negative, with 42% in favor to 55% opposed. By comparison, AAAS members from other disciplines express less support for fracking; a quarter (25%) of AAAS members with a specialty in the biomedical sciences favors the increased use of fracking, while 73% oppose.

Genetically engineered plants as a fuel replacement

Increased Use of Bioengineered Fuel

One newer form of energy development — increased use of genetically engineered plants as a fuel alternative to gasoline — draws strong support among both AAAS scientists and the general public. Fully 78% of all AAAS scientists surveyed favor increased use of this technology, as do 68% of Americans. Similarly, 80% of Working Ph.D. Scientists favor the increased use of bioengineered fuel as do 79% Active Research Scientists.

Global Population Growth and Resource Strain

Growing World Population and Resources

AAAS scientists are particularly likely to express concern about world population growth’s likely effects on the planet’s natural resources. Fully 82% of AAAS members surveyed say population growth will be a major problem because there will not be enough food and resources to go around, while 17% say this will not be a major problem because the world will find a way to stretch its natural resources. Views among subsets of AAAS members are similar: 83% of Working Ph.D. Scientists and 83% of Active Research Scientists say world population growth will be a major problem.

By comparison, a smaller majority of Americans express concern about world population growth and natural resources: 59% of adults have a pessimistic view about the effect of population growth, saying it will be a major problem. Nearly four-in-ten (38%) take the view that growth will not be a major problem because the world will find a way to stretch its natural resources.

Space Issues

Views About the Space Station

A majority of Americans see the International Space Station as a good investment: 64% say the space station has been a good investment for the country, 29% say it has not. Views among AAAS members also are largely positive: 68% say the space station has been a good investment for the country and 31% dissent from that view. Among working Ph.D. scientists, 65% say the space station has been a good investment for the country.

Views about investment in the space station are similarly positive among the engineers connected with the AAAS. Fully 70% of engineers in the survey who are working full time consider the space station a good investment for the country, as do 67% of all engineers in the survey.

Another group of domain experts, physicists in the AAAS canvassing, are more divided in their views. Among all physicists surveyed, 51% say the space station has been a good investment and 48% say it has not. Among physicists who are employed full time and hold a doctorate degree, opinion tilts (43% to 56%) toward those who say the space station has not been a good investment.

Role of Astronauts for Future U.S. Space Program

While sending humans into space has been a prominent feature of the U.S. space program in past decades, the future role of human astronauts in the U.S. space program is unclear.9 The Pew Research survey asked respondents to consider whether the use of human astronauts in the U.S. space program is essential or not essential, given the relative costs of manned vs. robotic space exploration. A majority of Americans (59%) take the view that human astronauts are an essential part of future U.S. space exploration. By contrast, AAAS scientists, whether grouped broadly or narrowly, are more closely divided over whether human astronauts are essential in the space program going forward. Among all AAAS members, 47% say human astronauts are essential and 52% say they are not. Opinions are the same among the subsets of Working Ph.D. Scientists and Active Research Scientists.

Engineers connected with the AAAS also are closely divided over the future role of astronauts in the U.S. space program. Half of full-time-employed engineers say astronauts are essential to include in the future U.S. space program and half disagree. A majority of AAAS physicists say astronauts are not essential. Among Ph.D. physicists who are employed full time, 65% say astronauts are not essential, with a minority of 35% saying astronauts are essential.

Childhood Vaccines

Childhood Vaccines

There is an 18-point gap between the general public and AAAS members overall when it comes to whether vaccines for childhood diseases, such as measles, mumps, rubella and polio, should be required or left up to parental choice. Fully 86% of all AAAS members surveyed say childhood vaccines should be required; just 13% say parents should be able to decide. By comparison, 68% of the general public says such vaccines should

Childhood Vaccines

be required, while 30% say parents should be able to decide whether or not to vaccinate their children.

Views among subsets of AAAS members are similar to those in the full sample. Fully 87% of Working Ph.D. Scientists and a similar share of Active Research Scientists say vaccines should be required. And among domain experts – the AAAS members whose primary discipline is in a biomedical field – views are about the same. Fully 87% of this group says vaccines should be required and 13% say parents should be able to decide.

Food Safety

Safety of Eating Foods Grown With Pesticides

On food safety issues, the Pew Research survey found a large opinion gap between the general public and the scientific community.

Safety of Eating Foods Grown With Pesticides

Fully 68% of AAAS members consider eating foods grown with pesticides to be generally safe, and 31% say it is generally unsafe. By contrast, 69% of U.S. adults say eating such foods generally is unsafe, while 28% say it is safe. There is a 40 percentage point gap between the two groups.

Active Ph.D. Scientists are slightly more lopsided: 72% of this group says the foods grown with pesticides are generally safe and 27% say they are not safe, yielding a slightly larger difference between this group and the general public.

The domain experts who are chemists connected with the AAAS even more strongly hold the view that foods grown with pesticides are safe for consumption. Fully 81% of AAAS chemists who are employed full time and hold a doctoral degree say such foods are safe, as do 77% of all chemists surveyed.

Safety of Eating Genetically Modified Foods

The largest gap between the public and AAAS members occurs in views about the safety of genetically modified organisms (GMOs). Fully 88% of all AAAS members surveyed say they consider genetically modified (GM) foods to be generally safe. By contrast, a minority of adults (37%) say eating GM food generally is safe, while 57% say they believe it is unsafe.

Safety of Eating Genetically Modified Foods

Views about the safety of GMOs are similar among subsets of AAAS members. Nine-in-ten Working Ph.D. Scientists say eating GM foods is safe, as do 91% of Active Research Scientists.

Similarly, 91% of the domain experts who are biomedical scientists connected with the AAAS say GM foods are generally safe, as do 88% of chemists.

Use of Animals in Scientific Research

Use of Animals in Scientific Research

There is strong consensus among AAAS members in support of using animals in scientific research. Among all AAAS members surveyed, 89% favor such research. Those figures are slightly higher among Working Ph.D. Scientists and Active Research Scientists (92% in each group favor research using animals).

By comparison, the general public is closely divided when it comes to the use of animals in research. Some 47% favor and a nearly equal share (50%) oppose animal research. Public support for the use of animals in research is down slightly from 52% in 2009.

Use of Animals in Scientific Research

The domain experts connected to the AAAS with a background in a biomedical discipline also are overwhelmingly in favor of animal research. Not surprisingly, 96% of those who report having conducted animal research within the past 5 years favor the use of animals in research but so, too, do 86% of those who have not conducted such research in recent years.

Views about Evolution

Virtually all AAAS members surveyed say “humans and other living things have evolved over time”: 98% of AAAS members in our sample say this and 99% of Working Ph.D. Scientists and Active Research Scientists say so. And nine-in-ten AAAS members say evolution has occurred due to natural processes, such as natural selection; a small minority (8%) says that evolution was guided by a supreme being.

Views about Human Evolution

These views contrast sharply with beliefs about evolution among the general public. About two-thirds (65%) of Americans say humans and other living things have evolved over time while 31% say “humans and other living things have existed in their present form since the beginning of time.”

Views about Human Evolution

Roughly half of adults who say humans have evolved over time believe that evolution has occurred from natural processes such as natural selection (35% of all adults), while a somewhat smaller share (24% of all adults) believe a supreme being guided the evolution of humans and other living things.

There is near consensus among all AAAS members, regardless of discipline, that humans and other living things have evolved over time. Among domain experts who are biomedical specialists, 98% say humans have evolved and nine-in-ten say evolution is due to natural processes.

Characteristics of the Sample

AAAS is the largest multidisciplinary scientific society in the world. Those eligible to participate in this survey reflect a broad definition of the professionally engaged scientific community in the U.S. They come from a range of disciplines and backgrounds, with about half identifying their primary specialty area in the biomedical disciplines. They are about evenly divided between those who consider their primary focus to be basic knowledge and applied research.

Compared with the total science and engineering workforce, AAAS members also are distinctive because a large share have a background in the biological and medical sciences and many are employed in the educational sector.10

Members of the AAAS are a highly educated group. An overwhelming majority has some postgraduate education, including 72% who have at least one doctoral level degree. Those in science and engineering occupations typically have more schooling than the general public. But, AAAS members as a whole stand out for their high levels of education even in comparison to the broader science and engineering workforce.11

Profile of AAAS Members Surveyed

A majority (56%) of AAAS members have received research funding within the past five years. Seven-in-ten AAAS members currently working full time have received funding within the past five years, as have 76% of those working in an academic setting.

Those with recent funding are most likely to have received federal grant funds for research (78%); 46% received direct research support from a university or college and about a third received funding from a private foundation. Smaller shares report funding from industry sources (25%), state government (15%) or from a scientific professional association (6%).

As a group, AAAS members differ from the general public in a number of ways. AAAS members are lopsidedly male (71%) and older than the general public as whole (median age 59 years). Both a gender skew favoring men and a relatively older age are also characteristic of the total U.S. workforce in science and engineering.12

About this Report

This report is based on a survey of U.S. members of the American Association for the Advancement of Science (AAAS), one of the world’s largest organizations dedicated to scientific inquiry. The report explores the degree to which there is variation in views about science-related topics among surveyed AAAS members depending on their discipline, education, employment status and research experiences.

This report elaborates findings first released in January of this year. That initial report analyzed data from two surveys by Pew Research Center conducted in collaboration with the AAAS: a wide-ranging and diverse canvassing of 3,748 AAAS members based in the U.S. and a representative survey of 2,002 U.S. adults (those ages 18 and older). The January report focused on a comparison of the general public and AAAS scientists as a whole. A follow-up report examined in more detail the ways in which scientists interact with citizens and journalists and their reasons for doing so. A further analysis released this month looked at the underpinning of the general public’s views about science-related topics based on their political and ideological outlooks, their level of education and science knowledge, their religious affiliations, and differences associated with various demographic factors.

The current report is based on both the survey of AAAS members and U.S. adults. The report is a collaborative effort based on the input and analysis of the following individuals. Find related reports online at pewresearch.org <https://alpha.pewresearch.org/pewresearch-org/internet/packages/science-and-society/>

Lee Rainie, Director Internet, Science, and Technology Research Cary Funk, Associate Director, Research Brian Kennedy, Research Associate Monica Anderson, Research Analyst Maeve Duggan, Research Associate Kenneth Olmstead, Research Associate Andrew Perrin, Research Assistant Dana Page, Communications Manager Shannon Greenwood, Assistant Digital Producer Margaret Porteus, Information Graphics Designer

The fieldwork for both surveys was conducted by Princeton Survey Research Associates International. Contact with AAAS members invited to participate in the survey was managed by AAAS staff with the help of Princeton Survey Research Associates International; AAAS also covered part of the costs associated with mailing its members. All other costs of conducting the pair of surveys were covered by the Pew Research Center. Pew Research bears all responsibility for the content, design and analysis of both the AAAS member survey and the survey of the general public.

Acknowledgements

Special thanks go to Jeanne Braha and Tiffany Lohwater of AAAS who facilitated the interactions between Pew Research and AAAS staff to conduct the survey of members. Thanks also go to Ian King, director of marketing at AAAS, as well as Elizabeth Sattler and Julianne Wielga, who prepared the random sample of members and sent out all contacts with AAAS members selected for participation. We also are grateful to the team at Princeton Survey Research International who led the data collection efforts for the two surveys.

About the Survey

The survey was conducted online with a random sample of 3,748 U.S.-based members of the American Association for the Advancement of Science (AAAS) from Sept. 11, 2014, to Oct. 13, 2014. AAAS is the world’s largest general scientific society, and includes members from all scientific fields. Founded in 1848, AAAS publishes Science, one of the most widely circulated peer-reviewed scientific journals in the world. Membership in AAAS is open to all. The survey was conducted under the direction of Princeton Survey Research Associates International.

Sampling

A simple random sample of AAAS members was selected for participation by the staff of AAAS. Eligibility was limited to U.S. members, but otherwise used a broad definition of the scientific community. AAAS members of any discipline or background were eligible to participate, except for those whose membership type indicated that they were primary or secondary educators. AAAS staff and institutional members also were ineligible.

The sample was designed to replicate that used in the 2009 survey of AAAS members, and thus to maximize comparability of samples between the two time points. While it’s possible that the composition of AAAS members could have changed in substantive ways over time, comparisons of population characteristics in the AAAS membership database for 2009 and 2014 as well as sample characteristics from survey respondents suggest that AAAS member characteristics have stayed about the same on a variety of demographic and professional characteristics.

Weighting

Survey-based estimates of the population of AAAS members could be biased if some members are more or less likely than others to participate in the survey. To help ensure sample representativeness, the data were weighted to match population characteristics of AAAS membership for three characteristics: membership category, fellowship status and email availability. Membership categories of the organization adjust for a somewhat lower response rate among student members and a somewhat higher response rate among other membership types, including emeritus and professional memberships. AAAS fellows also had somewhat higher response rates compared with non-fellow members and thus weighting adjusts for that differential response rate. As expected, those with no email availability responded at somewhat lower rates, perhaps due to the greater difficulties this group faces participating in an online survey. Weighting also included an adjustment for contact via email or mail-only. Post data collection statistical adjustments require procedures that reflect departures from simple random sampling. The total design effect for this survey is 1.10.

Margins of Error

The margins of error table shows the unweighted sample sizes and the error attributable to sampling that would be expected at the 95% level of confidence for different subgroups. The survey’s margin of sampling error is the largest 95% confidence interval for any estimated proportion. For example, the margin of error for the entire sample is ±1.7 percentage points. This means that in 95 out of every 100 samples drawn using the same methodology, estimated proportions based on the entire sample will be no more than 1.7 percentage points away from their true values in the population, in this case, U.S.-based scientists in the AAAS. Sampling errors and statistical tests of significance used in this report take into account the effect of weighting. In addition to sampling error, one should bear in mind that question wording and practical difficulties in conducting surveys can introduce error or bias into the findings of opinion polls.

Survey Administration

Respondent Contact

A total of 19,984 members were mailed a letter requesting participation in the survey. The bulk of selected members (n=18,682) had both an email address and a physical address in the membership database while some had only a physical address available (n=1,302). Multiple contacts via postal mail and email, if available, were made to encourage participation in the online survey.

The invitation letter described the nature and purpose of the survey and included the URL and other access information to the online survey, it used a letterhead showing both AAAS and the Pew Research Center logos, and was signed by the head of each organization. An initial email was also sent to those with email addresses containing information similar to that on the advance letter in addition to a hyperlink to the survey login. A postcard reminder was sent to all who had not yet responded to the survey about two weeks after the initial mailing. A follow up email or letter (if no email address) was sent to those who had not yet responded roughly three weeks after the initial mailing. The online survey was closed as of Oct 13, 2014.

A total of 3,748 members completed the survey for an overall response rate of 18.8%.