Pew Research Center

FOR RELEASE APRIL 21, 2015

Americans’ Views on Open Government Data

Many hope that more transparency and data sharing will help journalists, make officials more accountable and improve decisions. But very few think agencies are doing a great job of providing useful data.

BY John B. Horrigan and Lee Rainie

FOR MEDIA OR OTHER INQUIRIES:

Communications Department
202.419.4372
www.pewresearch.org

RECOMMENDED CITATION

Pew Research Center, April 2015, "Americans’ Views on Open Government Data"

About Pew Research Center

Pew Research Center is a nonpartisan, nonadvocacy fact tank that informs the public about the issues, attitudes and trends shaping the world. It does not take policy positions. The Center conducts public opinion polling, demographic research, computational social science research and other data-driven research. It studies politics and policy; news habits and media; the internet and technology; religion; race and ethnicity; international affairs; social, demographic and economic trends; science; research methodology and data science; and immigration and migration. Pew Research Center is a subsidiary of The Pew Charitable Trusts, its primary funder.

© Pew Research Center 2026

Table of contents

  • About Pew Research Center
  • Americans’ Views on Open Government Data
  • Introduction
  • Connecting with Government or Government Data
  • Users’ Views on Potential Impacts of Open Data and Open Government
  • Grouping Users of Open Data and Open Government Applications
  • Appendix A: Demographic Detail on Responses to Selected Questions
  • Appendix B: Key Data Points for Groups
  • Methods

Americans’ Views on Open Government Data

Many hope that more transparency and data sharing will help journalists, make officials more accountable and improve decisions. But very few think agencies are doing a great job of providing useful data.

Government reformers and advocates believe that two contemporary phenomena hold the potential to change how people engage with governments at all levels. The first is data. There is more of it than ever before and there are more effective tools for sharing it. This creates new service-delivery possibilities for government through use of data that government agencies themselves collect and generate. The second is public desire to make government more responsive, transparent and effective in serving citizens — an impulse driven by tight budgets and declining citizens’ trust in government.

The upshot has been the appearance of a variety of “open data” and “open government” initiatives throughout the United States that try to use data as a lever to improve government performance and encourage warmer citizens’ attitudes toward government.

This report is based on the first national survey that seeks to benchmark public sentiment about the government initiatives that use data to cultivate the public square. The survey, conducted by Pew Research Center in association with the John S. and James L. Knight Foundation, captures public views at the emergent moment when new technology tools and techniques are being used to disseminate and capitalize on government data and specifically looks at:

  • People’s level of awareness of government efforts to share data
  • Whether these efforts translate into people using data to track government performance
  • If people think government data initiatives have made, or have the potential to make, government perform better or improve accountability
  • The more routine kinds of government-citizen online interactions, such as renewing licenses or searching for the hours of public facilities.

The results cover all three levels of government in America — federal, state and local — and show that government data initiatives are in their early stages in the minds of most Americans. Generally, people are optimistic that these initiatives can make government more accountable; even though many are less sure open data will improve government performance. And government does touch people online, as evidenced by high levels of use of the internet for routine information applications. But most Americans have yet to delve too deeply into government data and its possibilities to closely monitor government performance.

Among the survey’s main findings:

As open data and open government initiatives get underway, most Americans are still largely engaged in “e-Gov 1.0” online activities, with far fewer attuned to “Data-Gov 2.0” initiatives that involve agencies sharing data online for public use.

65% of Americans in the prior 12 months have used the internet to find data or information pertaining to government.

In this early phase of the drive for open government and open data, people’s activities tend to be simple. Their connection to open data could be as routine as finding out the hours of a local park; or it could be transactional, such as paying a fine or renewing a license.

Internet Use to Find Data or Information Pertaining to the Government
Minorities of Americans say they pay a lot of attention to how governments share data with the public and relatively few say they are aware of examples where government has done a good (or bad) job sharing data. Less than one quarter use government data to monitor how government performs in several different domains.

Few Americans think governments are very effective in sharing data they collect with the public:

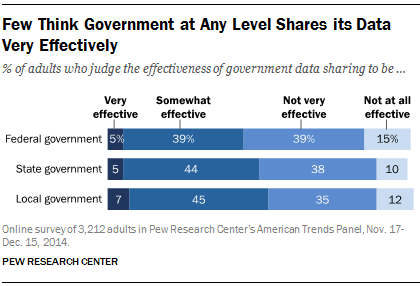
  • Just 5% say the federal government does this very effectively, with another 39% saying the federal government does this somewhat effectively.
  • 5% say state governments share data very effectively, with another 44% saying somewhat effectively.
  • 7% say local governments share data very effectively, with another 45% responding somewhat effectively.

Somewhat larger numbers could think of examples in which their local government either did or did not do a good job providing information to the public:

  • 19% of all Americans could think of an example where the local government did a good job providing information to the public about data it collects.
  • 19% could think of an example where local government did not provide enough useful information about data and information to the public.

Relatively few Americans reported using government data sources for monitoring what is going on:

  • 20% have used government sources to find information about student or teacher performance.
  • 17% have used government sources to look for information on the performance of hospitals or health care providers.
  • 7% have used government sources to find out about contracts between government agencies and outside firms.

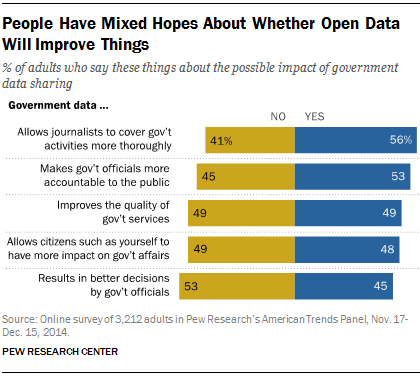
Americans have mixed hopes about government data initiatives. People see the potential in these initiatives as a force to improve government accountability. However, the jury is still out for many Americans as to whether government data initiatives will improve government performance.

People Have Mixed Hopes About Whether Open Data Will Improve Things

When looking at government performance, however, people are less optimistic, with less than half of Americans saying open data can help the quality of government services or officials’ decisions.

Additionally, 50% say they think the data the government provides to the public helps businesses create new products and services.

People’s baseline level of trust in government strongly shapes how they view the possible impact of open data and open government initiatives on how government functions.

Those Who Trust Government Are More Likely to Think There Are Benefits to Opening Government Data
[tweetable url="http://pewrsr.ch/1O8ymfU" alt="23% of Americans trust the federal government to do the right thing at least most of the time."]
  • 76% of those who generally trust the federal government say government data can help government officials be more accountable.
  • 73% believe government data can help journalists cover government more thoroughly.
  • 71% back the idea that government data results in better government decisions.
  • 70% agree with the notion that government data can enable people to have a greater impact on government affairs.
  • 69% say government data can improve the quality of government services.

Americans’ perspectives on trusting government are shaped strongly by partisan affiliation, which in turn makes a difference in attitudes about the impacts of government data initiatives.

Democrats Have a Somewhat More Upbeat View of the Impact of Open Data

Some 48% of this sample say they are Democrats or lean that way, while 41% identified as Republicans (or as leaning toward the Republican Party). Those with different partisan views have different notions about whether they trust government. Some 31% of those identifying as Democrats (or leaning that way) say they trust the federal government to do the right thing most of the time, compared with 15% of those identifying as Republicans (or leaning that way).

Americans are for the most part comfortable with government sharing online data about their communities, although they sound cautionary notes when the data hits close to home.

People’s comfort with government sharing varies across a range of topics:

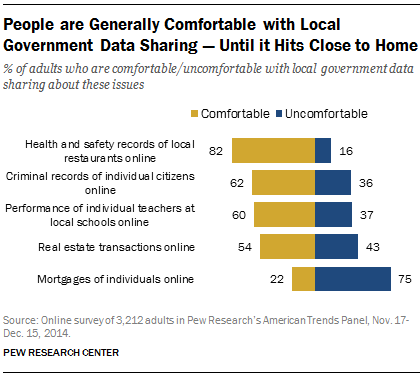
  • 82% of adults say they are comfortable with government sharing data online about the health and safety records of restaurants.
  • 62% are okay with government sharing information about criminal records of individual citizens online.
  • 60% can accept government sharing data about the performance of individual teachers at schools online.
  • 54% are comfortable with government sharing data about real estate transactions online.
  • Only [tweetable url="http://pewrsr.ch/1O8ymfU" alt="Only 22% of Americans are comfortable w/ the gov sharing information about mortgages of individual homeowners online."]22% are comfortable with government sharing information about mortgages of individual homeowners online.

Smartphone users have embraced information-gathering using mobile apps that rely on government data to function, but not many see a strong link between the underlying government data and economic value.

One of the issues for proponents of open government and open data is whether people are aware that government data undergird key businesses. Perhaps the most prominent example is that government weather-related data are the foundation of large numbers of weather-forecasting companies and analysts. In addition, government-created geolocation data are often the centerpiece of Global Positioning Systems (GPS) that are widely used in smartphones and other location-tracking systems.

The Pew Research survey asked the 68% of the sample who have smartphones several questions about their use of government-created data material:

  • 84% have used weather apps to find out the forecast nearby.
  • 81% have used map apps to navigate through a city or neighborhood.
  • 66% have used an app to find out about nearby stores, bars or restaurants.
  • 31% have used apps to get information about public transportation.
  • 14% have used apps such as Uber or Lyft to hire cars.

Despite widespread use of commercial applications that rely on government data, just 9% (among all Americans) say that the data government shares with the public helps a lot with the private sector’s creation of new products and services, while another 41% says it helps somewhat.

People’s outlooks about open data and open government sort into four distinct groups that depend on their engagement with government data and online applications, as well as their level of optimism about how government data initiatives might impact government.

Some 17% of all adults — Ardent Optimists — have truly signed on to government data initiatives. They use online resources to connect with government and have strong levels of understanding about the details of government data. They are highly likely to think government data will improve how government performs, how citizens can impact government and how journalists can do their jobs.

Another 20% are steady users of online government resources, but are skeptical that they will have any payoff to government performance. These Committed Cynics use the internet to find the government information they need and have relatively high levels of awareness of when governments do a good job sharing information about data. But a minority thinks government data will improve government services, decisions or their ability to impact the government. This group has low levels of trust in government.

Some 27% like the idea that data can improve how government performs, but these Buoyant Bystanders are not likely to use the tools that the data enables to connect with government. Strong majorities think government data initiatives can foster greater government accountability and better government services. This group brings more trust in government to the table than other groups, but they do not often use the internet to get information about government or carry out transactions.

Finally, 36% of the general population can be called Dormant Doubters. They do not often use the internet to transact or find out about government and they also do not think government data initiatives are apt to improve government services or make it more accountable. They have low levels of trust in government to begin with, which may influence their perspectives on whether data initiatives can improve government.

For stakeholders hopeful that open data and open government can have an impact on the public’s view of government, these groupings put these hopes in the context of where people are today. A minority — 17% — see the potential clearly. A slightly greater number — 20% — are relatively familiar with government data initiatives, but remain wary that these initiatives will have much impact on government performance. Larger numbers offer a mix of encouragement and caution as to whether open data and open government could become more meaningful to them as these initiatives evolve. Some 27% of Buoyant Bystanders see the appeal, but for whatever reason do not use the tools of open data and open government that much. The Dormant Doubters (36%) are in the category whose future interest and inclinations are uncertain. To the degree they might ponder open-data initiatives, they seem to be wondering whether these initiatives can make a difference and are reluctant to start exploring something for which they see little potential impact.

A potentially significant barrier to government data initiatives lies in the connection between trust in government and skepticism among some citizens about whether these initiatives will bolster government performance. The greater a person’s trust in government, the greater the likelihood she believes government data initiatives will improve government performance. That sets up a chicken-and-egg dilemma. Do government data initiatives spark high levels of trust in government? Or do low levels of trust in government attenuate the benefits to civic engagement that are a motive for many government data initiatives? In highlighting this dynamic, this research points to the challenges and possibilities in ongoing efforts in the open data and open government arena.

About this Survey

The analysis in this report is based on findings from a nationally representative survey of 3,212 American adults (ages 18+) by the Pew Research Center on its American Trends Panel. It was fielded November 17-December 15, 2014. The survey was conducted in English and Spanish on the web and in postal mail. The margin of error for the full sample is plus or minus 2.0 percentage points.
Introduction

With the proliferation of cheap and portable storage of digital data and advances in the speed and availability of communications networks for moving bits around, data have become important in nearly every corner of society. Anything that can be digitized can be shared and data that can be shared can often be transformed — sometimes in ways that surprise those who generated the data in the first place. In areas such as commerce, entertainment, and news, the impacts of large volumes of data are visible for many Americans in a number of activities. It is evident in everyday Web browsing, the videos people watch, the reviews they read as the purchase products, and how they jointly tackle community problems.

When it comes to the government, the role of data may seem less prominent. Whereas some businesses appear to be data engines, government remains to many people a brick-and-mortar operation, with service delivery and deliberation taking place in buildings or in phone calls. Elected officials routinely conduct online “town hall” meetings and the image is animated by how many still think of electoral politics — playing out face-to-face between the candidate and voters.

Yet data and government activity increasingly go hand in hand. Collecting data is at the heart of any number of government functions, such as the decennial Census or data collection that measure economic change or climatological activity. Government also collects so-called “administrative data” as part of doing its business — data on who votes, who is buying real estate, who is driving cars, and more.

In recent years, governments at all levels have begun to understand the opportunities connected to government data. Similarly, advocates for more effective and efficient government have their own hopes for making government more transparent and helpful to citizens. In broad terms, the opportunities that officials and reformers envision fall into two categories:

Economic: Advocates hope that if government shares data effectively with the general public, entrepreneurs will think of ways to create commercial value from it — thereby spurring job creation.

Civic engagement: Proponents believe that governments should use data to better serve citizens at lower cost. In turn, improved government services will make citizens have more favorable views toward government.

These opportunities are on the supply side, that is, the benefits that come from opening the data floodgates, with government officials or citizens creating new things. This report focuses on the demand side, exploring where users of government services find themselves as government data shapes new ways of government-citizen interaction.

Past research has documented how people use the internet to connect with government — usually to find information or conduct transactions. In light of the growing volume and availability of government data and data about government, this report digs more deeply into users’ views. The main questions are:

  • How aware are Americans of the efforts by governments to share data with the public?
  • Does open data help Americans better keep track of government performance?
  • Do Americans think open data have made — or have the potential to make — government do its job better?
  • How do Americans use data-driven tools to carry out transactions with government or find information about government?

Background and Definitions: Open Government and Open Data

Open Data and Open Government are related notions and often thought to be interchangeable. Yet they are not quite the same, and indeed open government is about more than open data.2 One (Open Government) is an end and the other (Open Data) is a means to that end. Open Government is a policy posture of the Obama Administration and many governors and mayors of all political persuasions. The notion is to use modern technology and other tools to help citizens better understand how government works, more effectively engage with government, create economic value, and improve government service delivery.

Open government: Although the term “open government” has gained currency on the heels of several Obama Administration initiatives, its origin is decades old. In the 1950s, in congressional deliberations that culminated a decade later in the Freedom of Information Act (FOIA), open government was seen (and the term first used) as a pathway to more government accountability. As the discourse and case law regarding FOIA evolved, the word “transparency” also entered the picture.3 Government had certain legislative mandates to share information about its operations with the public. Such transparency was a value in itself while also providing an accountability check on government officials. At the same time, government had to protect against the release of sensitive information (whether that pertains to individuals or national security).

Open data: It is both a subset of open government and a way to implement it. Whereas open government is a broad set of policy principles, such as “transparency, participation, and collaboration,” open data initiatives create the technical conditions so that the government can realize those principles. The Obama Administration made open government a priority from its earliest days, calling on the United States’ first Chief Technology Officer to develop an “Open Government Directive” that resulted in the development of open data policies.4 Out of this directive came “Project Open Data” which argues that government agencies’ principles toward data should be:

  • Public: Agencies should have a presumption that their data should be open, subject to laws and imperatives of privacy, confidentiality, security, or other valid restrictions.
  • Accessible: Data should be machine readable and easily retrievable and searchable.
  • Described: Open data should be clearly described so that users can understand how to use them, as well as the data’s strengths and weaknesses.
  • Reusable: Under open licenses, there should be no restrictions on use.
  • Complete: Data should be published in primary forms.
  • Timely: Data should be released as quickly as necessary to preserve its value.
  • Managed post-release: Agencies should designate a point-of-contact for data releases to respond to queries.5

As the issue has evolved in the past several years, open data has become associated with the two opportunities noted at the outset: economic growth and better government. Nick Sinai, former Deputy Chief Technology Officer sums up the thinking in saying the government wants “to continue opening up data that fuels private-sector innovation or helps build a more efficient and accountable government.”6

Operationally, advancing this agenda has meant convening and highlighting best practices. The U.S. Department of Commerce has taken an active role in bringing together stakeholders from industry and government to exchange views on government data — what industry sees as barriers to sharing and how government views possible constraints to doing so. In cooperation with the White House Office of Science and Technology Policy and GovLab at New York University, the Commerce Department hosted a June 2014 meeting to search for ways “to improve data management, dissemination, and use” with the hope that data will be “a cornerstone of economic opportunity for businesses and entrepreneurs.” An outcome of this convening was the creation of a Chief Data Officer position within the Commerce Department to promote the sharing of the department’s extensive data resources.7

At the municipal level, activists and public officials see data as a route to better democracy. As articulated by Stephen Goldsmith and Susan Crawford, technology and data analytics can, in combination with innovative government leadership, improve how government delivers services and even act preemptively to address problems that affect communities’ quality of life. That, they believe, can spark greater public trust in government and empower citizens’ voices in civic dialogue, thus “thickening the bonds of democracy and vibrancy of civic life.”8 Goldsmith and Crawford highlight examples of data-driven municipal innovation in New York, Boston, and Chicago, as well as states such as Indiana, but note the relevance of such initiatives in cities of all sizes and in all parts of an increasingly urbanized world.

These ideas and initiatives are on the cutting edge, which means knowledge and understanding of them will not be distributed evenly. This survey sets a benchmark for where American adults are in the nascent phase of open data and open government initiatives. The report that follows reveals tensions and opportunities as Americans acclimate to government that uses and generates more data:

  • The survey unearthed relatively high levels of broad and simple engagement with government data as people use the internet to access government services and information. At the same time, the survey shows relatively low levels of public awareness of government initiatives to open the data vaults for the public and entrepreneurs.
  • There is optimism among many citizens that government data can improve government accountability (against some caution that open data can improve government performance), along with some level of concern about government sharing data that may hit too close to home.
  • There is an uneven distribution of attitudes and uses of online government resources across the population.

Connecting with Government or Government Data

Two-thirds of Americans use the internet to connect with government

Using the internet to interact with the government is hardly foreign to the American public. When the Pew Research Center took an early look at e-government applications in a 2003 survey, some 44% of Americans had used the internet to contact the government (for some reason other than a tax issue).9 A 2009 survey showed that 61% of Americans looked for information about government or did a transaction online with government.10

The figures released in this report are not comparable trend numbers to those previous surveys because the polls asked different questions about people’s online behaviors with government. However, the findings generally suggest more Americans are using the government’s online resources over time — no surprise given the growing numbers of online Americans over that time frame and the governments’ investment in online applications during that period.

Even though the questions asked in this survey also differ from past Pew Research Center surveys, the findings reveal that relatively high levels of Americans use the internet to transact with the government or gather information about government activities. In the past 12 months, about one-third of Americans used the internet or an app to access information or data provided by the three levels of government:

  • 37% have used the internet or an app to get information or data about the federal government
  • 34% have done so with respect to their state government
  • 32% have used online tools to look for data or information about their local government

This comes to 49% of all adults who have done at least one of these three things with respect to using digital tools to find out about government or data it provides. Higher incomes households are more likely to have one of these three things. Two-thirds (66%) of those living in households with annual incomes over $75,000 have used the internet or apps for government information. (See the Appendix A for tables with detailed demographic breakouts for these and other survey results.)

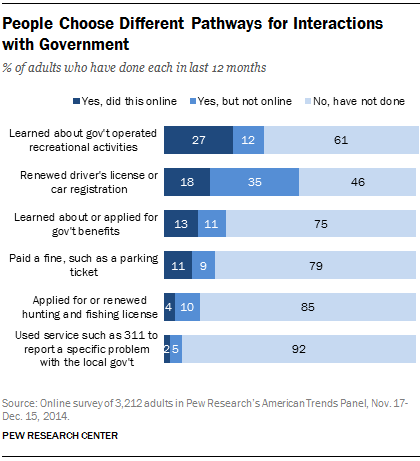
Americans use the internet often in dealing with various layers of government, but in many instances traditional offline methods dominate. Across six different activities people might go online to engage with the government, 46% of American adults did at least one of them online in the prior 12 months. Some 55% of Americans did at least one of the six listed activities offline in the prior 12 months.

People Choose Different Pathways for Interactions with Government

Collecting the incidence of Americans who either went online or used an app connected to any level of government or did at least one of the six activities listed above online yields a sense of how many Americans in the prior 12 months have used the internet to connect with government. This number comes to 65%. That is, two-thirds of adults have, in the previous 12 months, used the internet to find out something about government, or the data it provides, whether they are thinking generally about their state, local, or federal government, or when asked about specific online activities.

Small numbers think governments are very effective in making data available

Although many Americans have used the internet or an app to search for government information or transact with the government, probing the ins-and-outs of government data is a different thing. What separates government online today compared with 10 years ago is that, in the past, governments typically provided online information: websites listing hours of operation or interfaces to databases that might have more detailed information. Today, many governments are trying to provide underlying data that it collects for public use — and touting it as a feature to the general public. The kinds of entrepreneurial activity new government data sources can spur range from home energy management to analytics for investment decisions.11

At the same time, many government data initiatives play out within government, with their impacts felt only through programmatic impacts. In Indiana, for example, the state Department of Child Services has fostered data sharing across different state bureaucracies to help case workers address child abuse problems more effectively. In Boston, improved data sharing within government helped the city’s 311 call system migrate to the Citizen’s Connect web-based system to address citizen complaints about garbage collection or traffic.12

In both entrepreneurial and service delivery examples, data are inputs that eventually connect to outcomes that consumers and citizens experience. However, as with many products, the inputs may be obscure to the average user. For these reasons, it is perhaps understandable that people are less attuned to them than more traditional online government applications. This shows up when exploring how effectively they think government shares the data it collects with the general public.

Few Think Government at Any Level Shares its Data Very Effectively

Few people think that governments — no matter what the level — are very effective at sharing data with the public. Just 11% of adults across all three levels of government think this about any level of government. Sizable numbers occupy the middle — three-quarters or somewhat more say governments do this somewhat or not very effectively. Still, 44% think the Federal government shares data at least somewhat effectively and roughly half say this about state and local governments.

The main difference between those who think governments share data very effectively compared with those who do not think they share data effectively at all is party affiliation. Among those (11%) who think all levels of government share data effectively, 57% identify as Democrats (including those who lean Democratic) and 34% as Republicans (including those who lean Republican).

People’s tepid awareness of government data shows up when they are asked to state whether they could think of an example where government has done a good job providing information to the public about the data it collects and if they could think of an example where government does not provide enough useful data and information about the data it collects.

  • 19% could think of an example where their local government did a good job providing information to the public about data it collects.
  • 19% could recall an instance in which local government did not provide enough useful information.

This comes to a minority of respondents — 31% altogether — who could think of a positive or negative example of local government providing to the public information about its data collection activities.

Those who could give an example of how government did a good job or did a bad job sharing data were offered the chance, in an open-ended fashion, to describe it. These comments — a non-scientific dive into people’s perspectives— provide additional context on how people see government data. Among those that offered positive examples, comments suggest that they value the availability of government data on demography, crime, the economy, and government budgets. Many comments touch on basic information, with some noting they appreciate the ease of finding out about park hours, leaf collection, or the time and place of public meetings. Transparency, in other words, is a key value for many commenters on government data-sharing practices.

For those citing examples where government did a bad job sharing data, many communicated frustration with how governments presented data online. These respondents seemed to struggle at getting what they want online when they sought out data or information on a particular topic. Some respondents also criticized their local governments for not updating their websites about things such as road construction or development projects. Finally, some respondents expressed suspicions that their local government had a disposition against being transparent, meaning these respondents doubted that government data and information were complete or reliable.

Two additional things emerge from the comments of respondents who opted to share thoughts about how their local governments share data — both the good and the bad. First, these commenters seem to engage with government data as information-seekers, rather than as heavily engaged citizen-analysts. Second, many commenters express a desire to have more context and meaning be part of their interactions with government data. They value demographic or budget data, but would appreciate additional information (e.g., trends, understanding cost and benefits of projects) that might involve greater analysis of the data. This desire signals an opportunity for those interested in putting government data to better use for the public.

Another sign that Americans are not close followers of government data initiatives is evident when they are asked whether their local government has done more or less with respect to data sharing. Just 7% say government has provided more information about the data it collects in the past 12 months and 14% say it has provided less information. Large numbers either do not know (39%) or think government has provided about the same amount of information about the data it collects (also 39%).

The story is mixed for using government sources to find out about different topics. For topics that have cross-cutting resonance for many people, sizable minorities of Americans have used a government source to search for information:

  • 38% have searched for climate, weather or pollution levels.
  • 38% have searched for transportation issues, including road conditions and public transit.
  • 36% have searched for crime reports in their area.
Few Think Government at Any Level Shares its Data Very Effectively

When it comes to more detailed searches that involve monitoring government performance, fewer users take advantage of government sources for these purposes:

  • 20% have used government sources to find information about student or teacher performance.
  • 17% have used government sources to look for information on the performance of hospitals or healthcare providers.
  • 7% have used government sources to find out about contracts between government agencies and outside firms.

Whether it is perceptions about government’s effectiveness in sharing data, recollections of local governments sharing data or use of government sources to monitor performance, only a minority have deep connections to data resources that really dig into government.

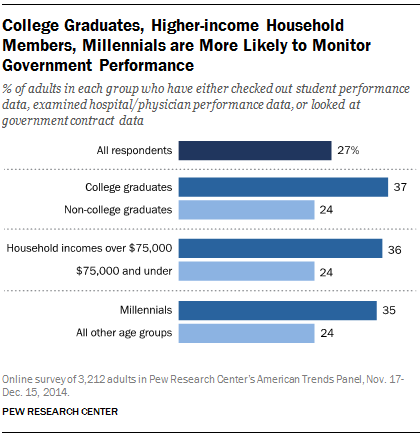
Overall, some 27% of Americans have done at least one of the three activities listed above that pertain to monitoring government performance. The main differences across demographic categories are education, income and age. Some 37% of college graduates have done one of the activities associated with monitoring government performance, as do 36% of those whose household incomes exceed $75,000 per year. Some 35% of millennials have done one of the three activities associated with monitoring government performance.

People often use government data, even if they do not recognize that — especially those who rely on weather and location apps

Although most people do not go too deeply into the inner workings of government data, the story is different when it comes to applications that rely on government data. The survey asked smartphone users in the sample — about two-thirds in all — whether they used specific apps on their smartphone. Here is what smartphone users say:

  • 84% of smartphone owners use weather apps that let them know the weather forecast where they are.
  • 81% use map apps that allow them to navigate through a city or neighborhood.
  • 66% use apps that let them know about nearby restaurants, bars or stores.
  • 31% use apps that inform them about public transportation, such as bus or train schedules.
  • 14% use apps such as Uber or Lyft that allow them to hire nearby cars.

Nearly all smartphone owners (92%) have used at least one of these apps.

These apps are location-based services that build off of the Global Positioning System, while weather apps also rely on data from the U.S. government’s National Weather Service. For the most part, smartphone users are fine with letting their devices share their location with app providers. Some 56% share their location for at least some of their apps (38% do so for some of them, 18% for all of them).

Yet smartphone users have mixed views on the bargain that usually goes with downloading apps: share behavioral data with app providers in exchange for a free or cheap app. Specifically:

  • 47% say this describes their views: Allowing apps to know their location is worth it because of the services they get. 51% say it does not describe their views.
  • Just 20% agree with the idea that sharing their location with apps created from government data improves how government provides services. Fully 79% say it does not describe their views.
  • 35% say this statement describes their views: “I usually read the ‘terms of service’ statements of location apps before I agree to allow my location data to be collected.” Some 63% says it does not describe their views.

The findings point to a familiar dynamic in how people approach many online consumer applications. They like the convenience of internet-enabled applications, use them when they need them, but express caution at having their use of data understood or monitored by others. And most do not often delve into the details.

Through their usage patterns, people clearly indicate that mobile apps have value to them, notwithstanding some hesitancy in sharing personal data that help make them run, particularly when it means sharing data with government. People are supportive of the notion that government sharing data with the public creates value for the economy, if not that wholeheartedly. Some 50% of all Americans say the data the government shares with the public helps businesses create new products and services at least somewhat. But only 9% think this helps “a lot” and 41% say it helps “somewhat.” The remainder either think the impact is minor (34% say government data helps the economy either not much or not at all, and 16% had no opinion). Smartphone users are only slightly more likely to say this — 53% say government data sharing helps businesses create new products and services.

When government data hits close to home, people have mixed views

Another dimension of government data initiatives which the survey explored was people’s attitudes about applications involving government sharing data online. Some of those applications relate to information about individuals or their communities. People’s level of comfort with data sharing varied depending on the different uses of the data.

In general, people are fairly comfortable about the government putting online data on topics such as health and safety records of restaurants or criminal records. However, as the questions touch on things that are close to home, some worry arises. Three-quarters are uncomfortable about information about people’s mortgage being posted to the internet. About four- in-ten (43%) are uncomfortable about government providing online general information about real estate transactions.

People are Generally Comfortable with Local Government Data Sharing — Until it Hits Close to Home

When looking across all five topics, some 82% of adults are uncomfortable with at least one of the items listed and 66% are uncomfortable with two. This suggests that, even in light of solid levels of comfort with government providing specific information about individuals and communities online, there is a degree of concern in the general population about this practice — especially when it comes to people’s homes.

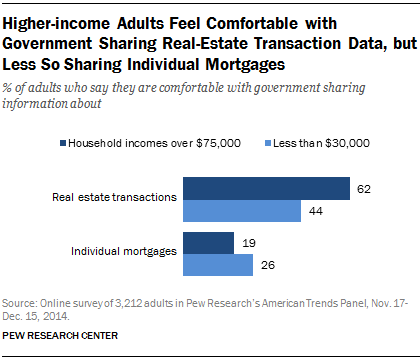
As to demographics, an interesting pattern emerges when looking at people’s levels of comfort about sharing real estate information generally versus sharing information on individual mortgages. When it comes to income, relatively well-off and lower income respondents present contrasts. More than half (62%) of those in homes with annual incomes over $75,000 per year are comfortable sharing information about real estate transactions online, while less than half (44%) of those in homes where annual incomes fall beneath $30,000 say this. For online sharing of individual mortgage information, just 19% of those in higher income homes are comfortable with this while a larger share (26%) of lower income respondents say this. The same pattern is true for education. Some 65% of college graduates feel comfortable sharing information about real estate transactions versus 44% of those with high school educations or less; 19% of college grads are fine sharing individual mortgage information online compared with 24% of less educated respondents.

Higher-income Adults Feel Comfortable with Government Sharing Real-Estate Transaction Data, but Less So Sharing Individual Mortgages

People more likely to own homes (i.e., well-off respondents) are more skittish about sharing individual mortgage information online than those less likely to own homes. Those who are better off financially are more likely to be comfortable about having general information about real estate available online than lower-income homes, perhaps because such information is useful to well-off households who are more likely to be active in the real estate market.

There are also differences across racial and ethnic categories. Whites are somewhat more likely than African Americans and Hispanics to say they are comfortable having information about real estate shared online; 56% of whites are, compared with 51% of Hispanics and 49% of African Americans. However, African Americans and Hispanics are significantly more likely to be comfortable with having information about individual mortgages shared online. Specifically:

  • 30% of African Americans are comfortable with individual mortgage information being shared online.
  • 29% of Hispanics say this.
  • 18% of white respondents say this.

The differences could be attributable, in part at least, to lower homeownership rates for African Americans and Hispanics. Some 42.1% of African Americans own their home and 44.5% of Hispanics do; this compares with the 72.3% figure for whites and 64.0% for all Americans.13

Users’ Views on Potential Impacts of Open Data and Open Government

People’s views about the possible impact of government data initiatives sort roughly into two categories along the lines of government accountability and government performance. Americans are generally optimistic that open data can improve accountability — directly by encouraging government officials to be more accountable to the public or indirectly by helping journalists do their jobs better. When it comes to metrics of government performance (i.e., whether open data will improve the quality of services), people’s views are decidedly mixed.

People Have Mixed Hopes About Whether Open Data Will Improve Things

Focusing on accountability, 56% say government data initiatives can help journalists cover government better and 53% say these initiatives could make government officials more accountable. This comes to two-thirds (66%) of adults saying open data would accomplish at least one of the two goals, with 34% not accepting these notions.

For measures about government performance, half of adult Americans say government open data efforts could improve the quality of government services and 45% say open data could results in better decisions by government officials. Just under half (48%) think government data means they are likely to have more of an impact on government affairs.

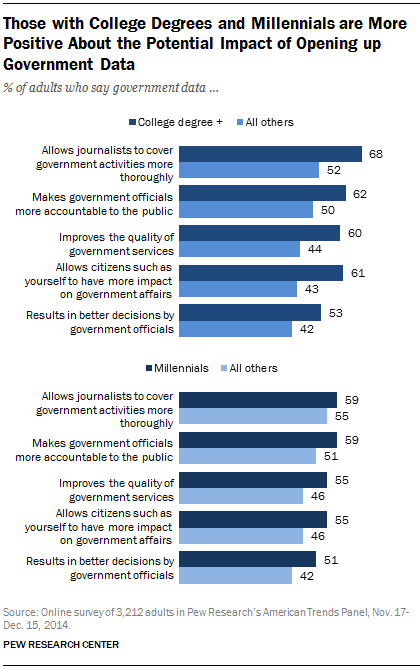
Younger and better educated adults are more likely to be optimistic about the possibilities of government data than others. The table below shows that those with college degrees exceed the survey average by as many as a dozen percentage points; millennials are also more likely than others, by steady margins, to be optimistic about data’s impact on government.

Those with College Degrees and Millennials are More Positive About the Potential Impact of Opening up Government Data

People’s attitudes toward trusting government help shape their views about whether data initiatives will bring benefits

Beneath these results showing optimism about government data’s impacts are people’s baseline attitudes about government. And indeed how people view the possible benefits of data initiatives varies with how they view two things: 1) Their trust in government and 2) Whether they believe they can have an impact on their community.

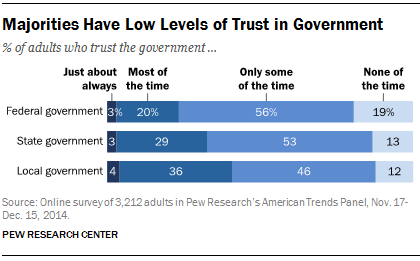
Majorities Have Low Levels of Trust in Government

Only a minority of Americans believe any level of government can be trusted most or just about all the time, though four-in-ten Americans believe this about local government.

Younger Americans are somewhat more likely to trust the federal government most of the time (28% of adults under the age of 30 do), as well as Hispanics and African Americans (33% and 29%, respectively, trust the federal government to do the right thing).

Those who say they trust the government at least most of the time are more likely than those who do not to say open data initiatives could have positive impacts. Those who are likely to trust the federal government most or about all the time are very likely to see positive impacts from government data initiatives.

The differences in attitudes of possible impacts are more striking when comparing responses of those who trust the federal government most of the time to those who do not. The following table shows the wide gaps — at least 20 percentage points and in one case more than 30.

The findings suggest that people’s trust in government — the federal government in particular — has a lot to do with how they view the potential benefits of government data initiatives. The issue for those with high hopes for data initiatives and civic engagement is that relatively few (23%) Americans trust the federal government to do the right thing either always or most of the time.

Trust, political leanings, and behavior: Democrats are more likely to trust government and be optimistic about data’s impacts, but party identification has little impact on using the online government data applications

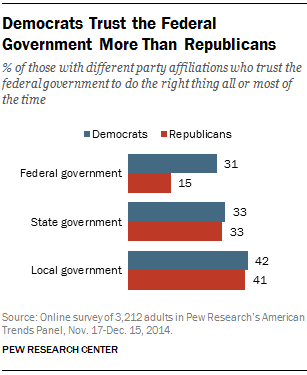
Democrats Trust the Federal Government More Than Republicans

With trust in government strongly shaping people’s attitudes about the potential benefits of government data initiatives, and party identification likely to have something to do with people’s trust in government, it makes sense to explore the role of respondents’ political leanings. In this survey, 48% of respondents say they are either Democrats (or lean that way) and 41% identify as Republicans (or lean that way), with the remainder saying they are independent. Democrats are about twice as likely as Republicans to say that the federal government can be trusted to do the right thing most of the time (31% vs. 15%). The table to the right shows how trust plays out for each of the three levels of government when comparing political affiliation — with the differences in trust of the federal government being the obvious difference between Republicans and Democrats. Note that past Pew Research Center surveys find that trust in government among Republicans and Democrats varies depending on which party holds the presidency. When a Republican holds the presidency, Republicans’ level of trust in the federal government is high, while Democrats’ trust in the federal government exceeds that of Republicans when a Democrat is president.

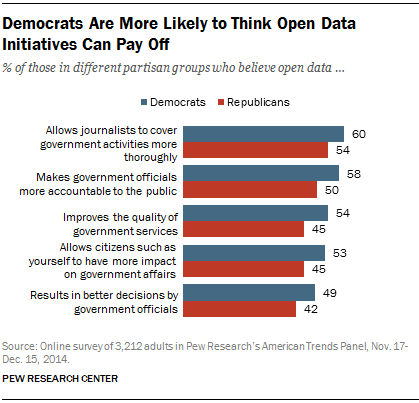
Democrats Are More Likely to Think Open Data Initiatives Can Pay Off

Turning to attitudes about the impact of government data, Democrats are generally more likely to see potential benefits in government data initiatives than Republicans. The gaps are in the 6 to 9 point range across all questions, which is narrower than the margins between Democrats and Republicans for trust in the federal government.

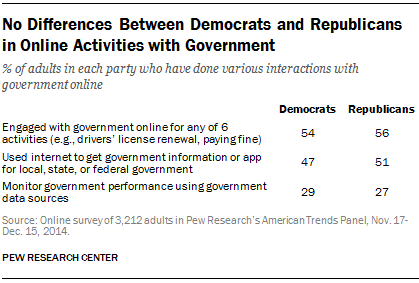
It is also worth looking at differences between Republicans and Democrats on behavior — that is, their use of online tools for interacting with government. The table below compares the collected incidence of several kinds of activities: use of the internet or an app to find out about any of the three levels of government, whether people had done any of six things online (such as renewing a drivers’ license or paying a toll), or whether they had monitored certain aspects of government performance online (e.g., teacher performance, hospital or health care provider performance, or looking at crime reports).

No Differences Between Democrats and Republicans in Online Activities with Government

As the table to the right shows, there are small — and not statistically significant — differences between Democrats and Republicans when the focus is on behavior. Being a Republican or a Democrat has nothing to do with whether a person uses online tools and government data sources to find out about something or carry out a transaction with government.

The analysis shows that party identification influences Americans’ trust in government, which in turn shapes people’s views on whether government data initiatives will bear fruit in terms of government performance and accountability. Yet party identification has very little to do with people’s choices on whether to use government data or the internet to engage with government.

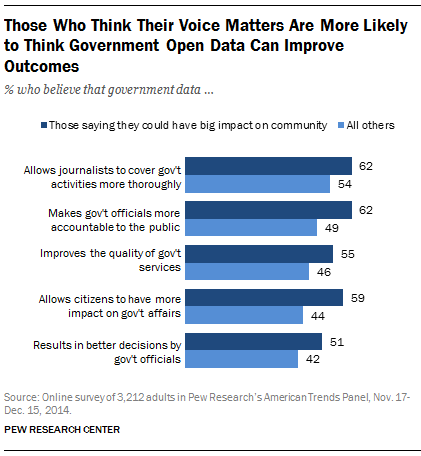
Those who think their voices count are more likely to think that government data initiatives can improve government and civic life

Similar, though less pronounced, patterns are evident when people were asked whether they felt they could have an impact on making their community a better place to live. Among all American adults:

  • 32% say they could have a big impact
  • 37% say they could have a moderate impact
  • 23% say they could have a small impact
  • 7% say they could have no impact at all

Here’s how those who say they could have a big impact responded to questions about government data initiatives compared with everyone else.

Those Who Think Their Voice Matters Are More Likely to Think Government Open Data Can Improve Outcomes

Grouping Users of Open Data and Open Government Applications

The preceding findings reveal cross-currents among citizens as they use the internet to connect with government. Most Americans have gone online to carry out transactions with the government and many are aware of government data initiatives. And people are generally optimistic that such initiatives can make the government more accountable, though many question whether open data will improve government performance. Yet fewer adults use the internet to dig into government performance and some harbor concerns about the government sharing data about their homes or communities online.

These tensions suggest the possibility there are different groups of users with different perspectives on open data/open government initiatives. Some people may be ardent users of open government applications and very optimistic about how such applications can improve government. Others may use the applications, but not think they will make much difference to government operations. Still others may be discouraged about the whole thing — light users and unimpressed with potentially positive impacts. Understanding these patterns, and the relative sizes of the groupings, might be illuminating to stakeholders interested in the public’s posture toward open data and open government initiatives.

The following analysis is based on a statistical technique called cluster analysis. It is employed to place respondents in categories based on how they respond to certain questions. In the analysis to follow, respondents’ answers to questions on behaviors (e.g., use of online government applications) and attitudes (e.g., views on open data initiatives’ impacts) form the basis of the groups. The questions included for analysis were:

  • Whether respondents had done transactions with government online
  • Whether they felt it was easy to find out how different levels of government perform
  • Whether respondents think different levels of government are effective in sharing their data with the general public
  • Whether they have used a government app in the prior 12 months
  • Whether they can think of examples where local government has done a good job (or not) providing information to the public about data it collects
  • Whether respondents used the internet to monitor government performance (e.g., teachers’ performance or government contracts)
  • Whether they are comfortable with the government sharing data on specific topics (e.g., mortgages)
  • How they view the possible impacts of government data initiatives (e.g., improving quality of services)

It is worth noting what variables are not in this typology. Respondents’ answers about their trust in government and ability to impact their community were not included, nor were insights about respondents’ technology use (e.g., whether they use the internet or applications such as Facebook). That is because the typology’s focus is on responses to questions about open data and open government, not technology use or other attitudinal measures.

Grouping Users of Open Data and Open Government Applications

The typology yields a four-way grouping of users of open data/open government applications that runs across two dimensions: use of applications (light to heavy) and perceptions of government data initiatives’ possible impacts (pessimistic to optimistic).

Ardent Optimists: Some 17% of all adults are heavy users of open government/open data applications, fairly likely to use them to monitor government performance, and highly likely to think that open data and open government initiatives can improve outcomes. Half (50%) of those in this group have gone online to learn about government operated recreational activities (nearly twice the 27% average) and 22% have gone online to learn about government benefits (against the 13% average). They also are more attuned to what governments are doing when it comes to data. Some 13% in this group thinks the federal government shares data very effectively, the same number says this about state government, and 17% say this about local government. This is more than twice the average in each case. Nearly 4 in 10 (38%) can think of an example where local government has done a good job providing data (twice the average) and 28% can think of an example where local government did not provide enough useful information — 9 points above the average.

Ardent Optimists’ greater level of activity and awareness is accompanied by positive attitudes about how open data/government initiatives can impact outcomes. Nearly all in this group (97%) think government data can improve the quality of government services and 90% or more think government data can help journalists cover government more thoroughly, make government officials more accountable, allow citizens to have greater impact on government, and result in better decisions by government officials.

The characteristics of Ardent Optimists significantly shape the attitudes they bring to thinking about government. Some 38% trust the federal government at least most of the time, half (48%) say this about state government, and 61% trust local government at least most of the time. This exceeds the average by between 15 and 21 percentage points across the three categories. Almost half (47%) say they can have a big impact on their community compared with the 32% figure for all respondents.

Demographically, Ardent Optimists are well off financially (22% live in households where the annual income exceeds $100,000 compared with the 15% average) and well-educated (43% have college degrees against the 28% average). They are also more likely to be men; 57% are. (See Appendix B for tables with details on demographics and responses to specific questions for this and all groups). Politically, a clear majority of Ardent Optimists are Democrats: 57% identify as Democrats (or leaning that way), while 36% are Republicans.

Committed Cynics: This group — 20% of adults — is marked by engagement with government’s online applications and relatively strong awareness of data initiatives, but not a lot of hope that government data will improve how government functions. Similar to Ardent Optimists, Committed Cynics do take advantage of government’s online offerings; 38% have used the internet to find out about government-operated recreation activities such as parks and one-quarter (24%) have renewed a driver’s license or car registration online. Most have used a government app or gone online for government information or data; 91% have done this relating to state government, 80% for the federal government, and 71% for state government. These figures are more than twice the average and are comparable to incidence in this area for Ardent Optimists. The Committed Cynics do pay some attention to what local governments are doing with data — 25% can think of an instance in which local government did a good job sharing data with the public and 30% can think of a time when local government did not provide useful data.

Committed Cynics’ use of government data and online applications does not translate into very positive views about possible impacts of government data. Some 42% of Committed Cynics think government data can help journalists cover government better, but only 32% say government data can make officials more accountable. Some 28% say government data can help citizens have more impact on government affairs. Just one in five (21%) say data can help improve government services and fewer (17%) say data can result in better decisions by government.

It is little surprise, then, that Committed Cynics come to their contemplations about data and government with low levels of trust in government. Just 13% trust the federal government at least most of the time, 23% trust state government most of the time, and 37% say this about their local government. Only their response for trust in local government approaches the 40% figure for all Americans.

Like Ardent Optimists, Committed Cynics are well off economically; 23% live in homes with annual incomes over $100,000. They are more likely to be well educated than average (36%) have college degrees, but also more likely to be white, as some 74% are compared with the 67% average. Half (49%) are men. In contrast to Ardent Optimists, Committed Cynics are more likely to be Republican and less likely to identify as Democrats. Some 47% of Committed Cynics lean Republican or say they are registered Republicans and 40% are Democrats (or lean that way).

Buoyant Bystanders: About one-quarter (27%) of adults fit into a category of users who do not heavily use online government applications or exhibit a great deal of awareness of data initiatives. But they have high hopes that government data initiatives can help improve how government performs. Just 16% have gone online or used a federal government app to find out about government data or information, 2% have done this for state government, and 8% for local government. These figures are far below the figures for the entire survey. Some 27% have gone online to look for crime reports in their area compared with the 36% average and 29% have sought out information online about transportation against the 38% average.

Although their usage patterns lag the average, Buoyant Bystanders see potential in open data/open government initiatives. More than 90% think government data initiatives can make government officials more accountable to the public or improve the quality of government services (93% and 91%, respectively, say this). Similar shares — 88% in both cases — say government data initiatives can help journalists cover government more thoroughly and result in better government decisions.

Buoyant Bystanders bring solid levels of trust (relative to other groups) to their perspectives on government and data, as 35% trust the federal government at least most of the time against the 23% average and 43% say this about their state government (compared with 32% for all respondents).

Demographically, this group has lower levels of education and income than the prior three groups; it is also the most diverse from the perspective of gender, race, and ethnicity. Buoyant Bystanders are predominantly female (56%) and 27% are either African American or Hispanic (14% for each). One-fifth (22%) live in homes where the annual income exceeds $75,000, below the 27% figure for all and just more than half the figure for Ardent Optimists and Committed Cynics. Politically, Buoyant Bystanders resemble Ardent Optimists. Half (51%) are Democrats (or lean that way) and 38% are Republicans (or lean that way); 11% are independent.

The final — and largest — group is the Dormant Doubters; they neither use the internet for government-related applications nor do they believe such applications will improve government performance. They make up 36% of the general population and few have used apps or gone online for government information; just 8% have done this for the federal government, 1% for their state government, and 7% for local government. Only 8% can think of an example where government did a good job providing data — less than half the average.

The low levels of usage go hand-in-hand for Dormant Doubters with the notion that government data initiatives are not likely to have much consequence. Only 23% think data initiatives can help journalists cover government better, 15% think such initiatives can make government officials more accountable, and 10% say data initiatives can improve the quality of services.

Dormant Doubters also do not trust government much. Just 13% trust the federal government to do the right thing most of the time and 21% say this about state government. With respect to their local government, only 24% say trust it at least most of the time —far lower than any of the other three groups.

Demographically, this group is older (22% are age 65 or older) with much lower income than the other groups (44% have annual incomes under $30,000), and with fewer (17%) college graduates than the other groups. As to their political views, Dormant Doubters mainly track the general population. Some 46% are Democrats (or lean that way) and 42% are Republicans.

Technology use across groups

Technology Profiles of Different Groups

With the main thrusts of the survey about awareness and use of government data, it is natural to wonder how respondents’ technology use plays out across the four categories of users. Overall, most respondents use modern information technology. Some 89% of respondents use the internet, 68% have smartphones and 66% use Facebook. Comparing the different groups, the first two groups, Ardent Optimists and Committed Cynics, are the heaviest tech users, with all identifying as internet users and nearly 80% with smartphones. The final two groups, Buoyant Bystanders and Dormant Doubters, are somewhat less connected to technology, with 87% and 80%, respectively, saying they are internet users and 68% and 57%, respectively, having smartphones. Even with the differences across the groups, each group has large majorities with the tools of modern communications. As noted above, the technologies people have adopted were not inputs for the typology’s groups.

Appendix A: Demographic Detail on Responses to Selected Questions

Demographic Detail on Responses to Selected Questions

Appendix B: Key Data Points for Groups


Key Data Points for Groups


Key Data Points for Groups


Key Data Points for Groups


Key Data Points for Groups


Key Data Points for Groups


Key Data Points for Groups


Key Data Points for Groups


Key Data Points for Groups


Key Data Points for Groups


Key Data Points for Groups

Methods

The American Trends Panel (ATP), created by the Pew Research Center, is a nationally representative panel of randomly selected U.S. adults living in households. Respondents who self-identify as internet users (representing 89% of U.S. adults) participate in the panel via monthly self-administered Web surveys, and those who do not use the internet participate via telephone or mail. The panel is being managed by Abt SRBI.

Data in this report are drawn from the November wave of the panel, conducted November 17-December 15, 2014 among 3,212 respondents (2,856 by Web and 356 by mail). The margin of sampling error for the full sample of 3,212 respondents is plus or minus 2.3 percentage points.

All current members of the American Trends Panel were originally recruited from the 2014 Political Polarization and Typology Survey, a large (n=10,013) national landline and cellphone random digit dial (RDD) survey conducted January 23rd to March 16th, 2014, in English and Spanish. At the end of that survey, respondents were invited to join the panel. The invitation was extended to all respondents who use the internet (from any location) and a random subsample of respondents who do not use the internet.14

Of the 10,013 adults interviewed, 9,809 were invited to take part in the panel. A total of 5,338 agreed to participate and provided either a mailing address or an email address to which a welcome packet, a monetary incentive and future survey invitations could be sent. Panelists also receive a small monetary incentive after participating in each wave of the survey.

The ATP data were weighted in a multi-step process that begins with a base weight incorporating the respondents’ original survey selection probability and the fact that some panelists were subsampled for invitation to the panel. Next, an adjustment was made for the fact that the propensity to join the panel and remain an active panelist varied across different groups in the sample. The final step in the weighting uses an iterative technique that matches gender, age, education, race, Hispanic origin and region to parameters from the U.S. Census Bureau’s 2012 American Community Survey. Population density is weighted to match the 2010 U.S. Decennial Census. Telephone service is weighted to estimates of telephone coverage for 2014 that were projected from the July-December 2013 National Health Interview Survey.  It also adjusts for party affiliation using an average of the three most recent Pew Research Center general public telephone surveys, and for internet use using as a parameter a measure from the 2014 Survey of Political Polarization. Sampling errors and statistical tests of significance take into account the effect of weighting. The Hispanic sample in the American Trends Panel is predominantly native born and English speaking.

In addition to sampling error, one should bear in mind that question wording and practical difficulties in conducting surveys can introduce error or bias into the findings of opinion polls.

The Web component of the November wave had a response rate of 78% (2,856 responses among 3,66315 Web-based individuals enrolled in the panel); the mail component had a response rate of 68% (356 responses among 521 non-Web individuals enrolled in the panel). Taking account of the response rate for the 2014 Survey of Political Polarization (10.6%), the cumulative response rate for the October ATP wave is 3.5%.