Three in ten adults read an e-book last year; half own a tablet or e-reader
BYKathryn Zickuhr and Lee Rainie
About Pew Research Center
Pew Research Center is a nonpartisan, nonadvocacy fact tank that informs the public about the issues, attitudes and trends shaping the world. It does not take policy positions. The Center conducts public opinion polling, demographic research, computational social science research and other data-driven research. It studies politics and policy; news habits and media; the internet and technology; religion; race and ethnicity; international affairs; social, demographic and economic trends; science; research methodology and data science; and immigration and migration. Pew Research Center is a subsidiary of The Pew Charitable Trusts, its primary funder.
Three in ten adults read an e-book last year; half own a tablet or e-reader
Most American adults read a print book in the past year, even as e-reading continues to grow
The proportion of Americans who read e-books is growing, but few have completely replaced print books for electronic versions.
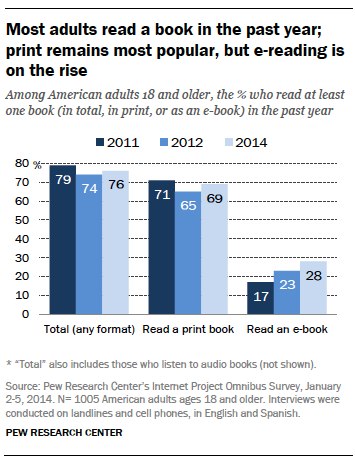
The percentage of adults who read an e-book in the past year has risen to 28%, up from 23% at the end of 2012. At the same time, about seven in ten Americans reported reading a book in print, up four percentage points after a slight dip in 2012, and 14% of adults listened to an audiobook.
Though e-books are rising in popularity, print remains the foundation of Americans’ reading habits. Most people who read e-books also read print books, and just 4% of readers are “e-book only.” Audiobook listeners have the most diverse reading habits overall, while fewer print readers consume books in other formats.
Overall, 76% of adults read a book in some format over the previous 12 months. The typical American adult read or listened to 5 books in the past year, and the average for all adults was 12 books.1 Neither the mean nor median number of books read has changed significantly over the past few years.
More also own dedicated e-reading devices
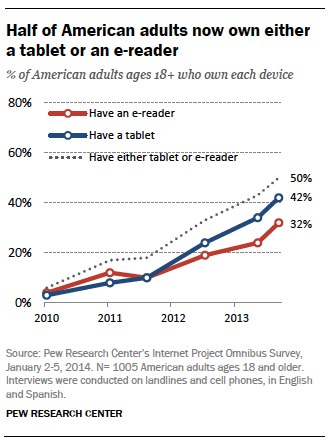
The January 2014 survey, conducted just after the 2013 holiday gift-giving season, produced evidence that e-book reading devices are spreading through the population. Some 42% of adults now own tablet computers, up from 34% in September. And the number of adults who own an e-book reading device like a Kindle or Nook reader jumped from 24% in September to 32% after the holidays.
Overall, 50% of Americans now have a dedicated handheld device–either a tablet computer like an iPad, or an e-reader such as a Kindle or Nook–for reading e-content. That figure has grown from 43% of adults who had either of those devices in September.
In addition, the survey found that 92% of adults have a cell phone (including the 55% of adults who have a smartphone), and 75% have a laptop or desktop computer – figures that have not changed in significantly from our pre-holiday surveys.
People read e-books on other devices, too
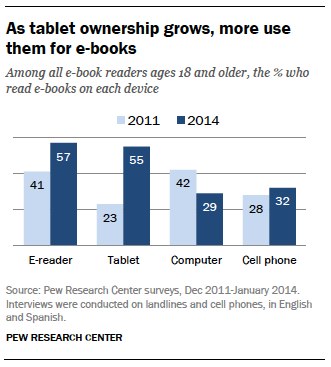
E-book readers who own tablets or e-readers are very likely to read e-books on those devices—but those who own computers or cellphones sometimes turn to those platforms, too. And as tablet and e-reader ownership levels have risen over the past few years, these devices have become more prominent in the e-reading landscape:
About the survey
These findings come from a survey conducted by Princeton Survey Research Associates International between January 2-5, 2014. The survey was conducted among a nationally representative sample of 1,005 adults ages 18 and older living in the continental United States. Interviews were conducted by landline (500) and cell phone (505, including 268 without a landline phone), and were done in English and Spanish. Statistical results are weighted to correct known demographic discrepancies. The margin of error for the full sample is plus or minus 3.4 percentage points.
Tablet and E-reader Ownership
Half of American adults now own a tablet or e-reader
Over the 2013 holiday period, the rate of tablet ownership rose to 42% of American adults, up eight percentage points from September. Ownership of e-book reading devices like Kindles or Nooks similarly increased to 32% as of January 2014. Some 50% of adults now own at least one of these devices.2
E-reader owners are more likely to be white, between the ages of 30 and 64, and with at least some college experience. Those with tablet computers are more likely to be younger (under age 50), with higher levels of education and from relatively well-off households—close to two-thirds (65%) of people living in households earning $75,000 or more annually now own a tablet.
A Snapshot of Reading in America in 2013
Who’s reading—and how: A demographic portrait
As of January 2014, some 76% of American adults ages 18 and older said that they read at least one book in the past year. Almost seven in ten adults (69%) read a book in print in the past 12 months, while 28% read an e-book, and 14% listened to an audiobook.
Women are more likely than men to have read a book in the previous 12 months, and those with higher levels of income and education are more likely to have done so as well. In addition, blacks are more likely to have read a book than Hispanics. There were no significant differences by age group for rates of reading overall.
In terms of book format, women are more likely than men to have read a print book or an e-book, as are whites and blacks compared with Hispanics and those with higher education and incomes compared with others. Younger adults are also more likely than those ages 65 and older to have read e-books, as are those who live in urban and suburban areas compared with rural residents. Finally, adults with higher levels of education are more likely to have read audiobooks than those who did not attend college.
Some of these differences are even more pronounced if we narrow the focus to look only at those who read a book in the past year. Among these recent readers, young adults caught up to those in their thirties and forties in terms of overall e-reading: Almost half (47%) of those under 30 read an e-book in 2013, as did 42% of those ages 30-49. E-reading also rose among readers ages 50-64, from 23% in November 2012 to 35% in January 2014. However, the e-reading rate among readers ages 65 and older remains around 17%.
Few readers have abandoned print for e-books
Though e-books are rising in popularity, print remains the foundation of Americans’ reading habits: Among adults who read at least one book in the past year, just 5% said they read an e-book in the last year without also reading a print book.
In general, the vast majority of those who read e-books and audiobooks also read print books. Of the three (overlapping) groups, audiobook listeners have the most diverse reading habits, while relatively fewer print readers consume books in other formats:
87% of e-book readers also read a print book in the past 12 months, and 29% listened to an audiobook.
84% of audiobook listeners also read a print book in the past year, and 56% also read an e-book.
A majority of print readers read only in that format, although 35% of print book readers also read an e-book and 17% listened to an audiobook.
Overall, about half (52%) of readers only read a print book, 4% only read an e-book, and just 2% only listened to an audiobook. Nine percent of readers said they read books in all three formats.
How many books Americans read last year
Among all American adults, the average (mean) number of books read or listened to in the past year is 12 and the median (midpoint) number is 5–in other words, half of adults read more than 5 books and half read fewer.3 Neither number is significantly different from previous years.4
E-reading and e-reading devices
In 2011, when fewer adults owned e-readers or tablets, many e-book readers accessed their e-books on the devices they did own: their computers or cell phones. The relative popularity of personal computers compared with newer e-reading devices meant that as many e-book readers did their reading on desktops and laptops as on e-readers like Kindles or Nooks.5
Younger e-book readers were especially likely to access e-books on cell phones or computers, while older adults were more likely to use dedicated e-readers. Only 23% of e-book readers overall read on a tablet.
However, as tablet and e-reader ownership levels have risen over the past few years, these devices have become more prominent in the e-reading landscape. A majority of e-book readers say they read e-books on an e-reader or tablet, and fewer do any e-book reading on a desktop or laptop computer. About a third (32%) of e-book readers still say they sometimes read e-books on their cell phone, reflecting both the ubiquity of mobile phones and the convenience of these phones as supplementary reading devices.
Though personal computers and cell phones may be used for a wide array of activities (including but not necessarily e-reading), most people who read e-books and own a tablet or e-reader consume e-books on those devices. E-book readers who own dedicated e-reading devices also tend to read e-books on them more frequently, while computers or cell phones are used less often, if ever.
Tablet computers
As noted earlier, 42% of adults own a tablet. Most e-book readers who own tablets say they read e-books on that device (78%), with 44% saying they do so at least weekly. Male e-book readers who own tablets are more likely than women to read e-books on these devices (88% vs 72%).
E-readers
Some 32% of adults own an e-reader like a Kindle or Nook. Unsurprisingly, most e-book readers who own dedicated e-reading devices such as Kindles or Nooks say they do read e-books on that device (87% say they do this, and 53% do so at least weekly.) Women are more likely than men to have read a book on their e-readers in the past year: 77% of men in this group read e-books on those devices, compared with 93% of women.
Adults who own e-readers like Kindles or Nooks read e-books more frequently than those who only own other devices (like tablets or cell phones). However, it is difficult to know whether that is because dedicated e-readers encourage more reading or because avid readers are more likely to purchase e-reading devices.
Desktop or laptop computers
Though 75% of adults own a desktop or laptop computer, few use them for e-book reading. Among desktop or laptop owners who read an e-book in the past year, 31% say they read e-books on their computer (down from 45% in 2011); only 9% say they do so at least weekly.
Cell phones
Some 92% of adults own a cell phone, and a majority a smartphone. Though only about a third (32%) of cell phone owners overall use them for e-book reading, the overall proportion of e-book readers who use their cell phones to read those e-books has held fairly steady since 2011. Few do so regularly—just 12% saying use their phone for e-book reading at least weekly.
Methods
January 2014 Omnibus Week 1
Prepared by Princeton Survey Research Associates International
January 2-5 2014
The PSRAI January 2014 Omnibus Week 1 obtained telephone interviews with a nationally representative sample of 1,005 adults living in the continental United States. Telephone interviews were conducted by landline (500) and cell phone (505, including 268 without a landline phone). The survey was conducted by Princeton Survey Research Associates International (PSRAI). Interviews were done in English and Spanish by Princeton Data Source from January 2 to 5, 2014. Statistical results are weighted to correct known demographic discrepancies. The margin of sampling error for the complete set of weighted data is ± 3.5 percentage points.
Design and Data Collection Procedures
Sample Design
A combination of landline and cellular random digit dial (RDD) samples was used to represent all adults in the continental United States who have access to either a landline or cellular telephone. Both samples were provided by Survey Sampling International, LLC (SSI) according to PSRAI specifications.
Numbers for the landline sample were drawn with equal probabilities from active blocks (area code + exchange + two-digit block number) that contained three or more residential directory listings. The cellular sample was not list-assisted, but was drawn through a systematic sampling from dedicated wireless 100-blocks and shared service 100-blocks with no directory-listed landline numbers.
Contact Procedures
Interviews were conducted from January 2 to 5, 2014. As many as three attempts were made to contact every sampled telephone number. Sample was released for interviewing in replicates, which are representative subsamples of the larger sample. Using replicates to control the release of sample ensures that complete call procedures are followed for the entire sample. Calls were staggered over times of day and days of the week to maximize the chance of making contact with potential respondents. Each phone number received at least one daytime call when necessary.
For the landline sample, interviewers asked to speak with the youngest adult male or female currently at home based on a random rotation. If no male/female was available, interviewers asked to speak with the youngest adult of the other gender. This systematic respondent selection technique has been shown to produce samples that closely mirror the population in terms of age and gender when combined with cell interviewing.
For the cellular sample, interviews were conducted with the person who answered the phone. Interviewers verified that the person was an adult and in a safe place before administering the survey.
Weighting and analysis
Weighting is generally used in survey analysis to compensate for sample designs and patterns of non-response that might bias results. The sample was weighted to match national adult general population parameters. A two-stage weighting procedure was used to weight this dual-frame sample.
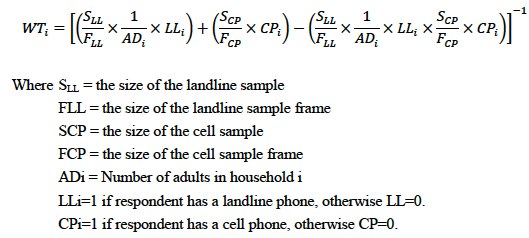
The first stage of weighting corrected for different probabilities of selection associated with the number of adults in each household and each respondent’s telephone usage patterns.6 This weighting also adjusts for the overlapping landline and cell sample frames and the relative sizes of each frame and each sample.
This first-stage weight for the ith case can be expressed as:
The second stage of weighting balanced sample demographics to population parameters. The sample is balanced to match national population parameters for sex, age, education, race, Hispanic origin, region (U.S. Census definitions), population density, and telephone usage. The basic weighting parameters came from the US Census Bureau’s 2012 American Community Survey data.7 The population density parameter was derived from Census 2010 data. The telephone usage parameter came from an analysis of the January-June 2013 National Health Interview Survey.8
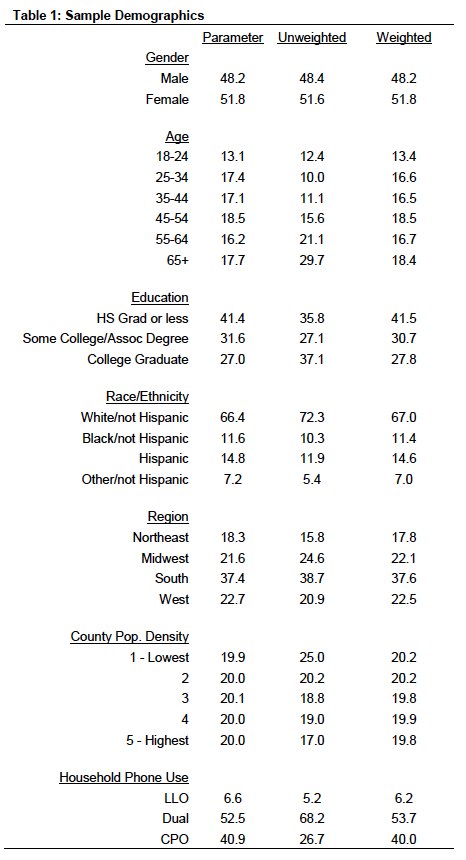
Weighting was accomplished using Sample Balancing, a special iterative sample weighting program that simultaneously balances the distributions of all variables using a statistical technique called the Deming Algorithm. Weights were trimmed to prevent individual interviews from having too much influence on the final results. The use of these weights in statistical analysis ensures that the demographic characteristics of the sample closely approximate the demographic characteristics of the national population. Table 1 compares weighted and unweighted sample distributions to population parameters.
Effects of Sample Design on Statistical Inference
Post-data collection statistical adjustments require analysis procedures that reflect departures from simple random sampling. PSRAI calculates the effects of these design features so that an appropriate adjustment can be incorporated into tests of statistical significance when using these data. The so-called “design effect” or deff represents the loss in statistical efficiency that results from unequal weights. The total sample design effect for this survey is 1.31.
PSRAI calculates the composite design effect for a sample of size n, with each case having a weight, wi as:
In a wide range of situations, the adjusted standard error of a statistic should be calculated by multiplying the usual formula by the square root of the design effect (√deff ). Thus, the formula for computing the 95% confidence interval around a percentage is:
where is the sample estimate and n is the unweighted number of sample cases in the group being considered.
The survey’s margin of error is the largest 95% confidence interval for any estimated proportion based on the total sample— the one around 50%. For example, the margin of error for the entire sample is ±3.5 percentage points. This means that in 95 out every 100 samples drawn using the same methodology, estimated proportions based on the entire sample will be no more than 3.5 percentage points away from their true values in the population. It is important to remember that sampling fluctuations are only one possible source of error in a survey estimate. Other sources, such as respondent selection bias, questionnaire wording and reporting inaccuracy, may contribute additional error of greater or lesser magnitude.
Response Rate
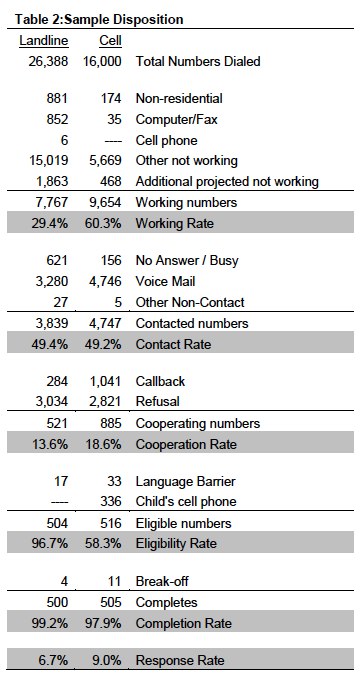
Table 2 reports the disposition of all sampled telephone numbers ever dialed from the original telephone number samples. The response rate estimates the fraction of all eligible sample that was ultimately interviewed. At PSRAI it is calculated by taking the product of three component rates:9
Contact rate – the proportion of working numbers where a request for interview was made10
Cooperation rate – the proportion of contacted numbers where a consent for interview was at least initially obtained, versus those refused
Completion rate – the proportion of initially cooperating and eligible interviews that were completed
Thus the response rate for the land line samples was 7 percent. The response rate for the cellular samples was 9 percent.