Pew Research Center

FOR RELEASE JANUARY 6, 2014

African Americans and Technology Use

A Demographic Portrait

BY Aaron Smith

FOR MEDIA OR OTHER INQUIRIES:

Communications Department
202.419.4372
www.pewresearch.org

RECOMMENDED CITATION

Pew Research Center, January 2014, "African Americans and Technology Use"

About Pew Research Center

Pew Research Center is a nonpartisan, nonadvocacy fact tank that informs the public about the issues, attitudes and trends shaping the world. It does not take policy positions. The Center conducts public opinion polling, demographic research, computational social science research and other data-driven research. It studies politics and policy; news habits and media; the internet and technology; religion; race and ethnicity; international affairs; social, demographic and economic trends; science; research methodology and data science; and immigration and migration. Pew Research Center is a subsidiary of The Pew Charitable Trusts, its primary funder.

© Pew Research Center 2026

Table of contents

  • About Pew Research Center
  • African Americans and Technology Use
  • Detailed Demographic Tables
  • Methods

African Americans and Technology Use

A Demographic Portrait

Main Findings

This report on African Americans and technology is the first in a series of demographic snapshots of technology use and adoption among different groups of adults in the United States. Based on a survey of 6,010 American adults, including 664 who identify as African American, it offers a detailed look at a number of key subgroups within the black population such as: men vs. women, old vs. young, low income vs. high income, and parents vs. non-parents.

The black/white “digital divide” continues to persist, but is not consistent across technology platforms or demographic groups

African Americans have long been less likely than whites to use the internet and to have high speed broadband access at home, and that continues to be the case. Today, African Americans trail whites by seven percentage points when it comes to overall internet use (87% of whites and 80% of blacks are internet users), and by twelve percentage points when it comes to home broadband adoption (74% of whites and 62% of blacks have some sort of broadband connection at home). At the same time, blacks and whites are on more equal footing when it comes to other types of access, especially on mobile platforms.

In addition, the gap between whites and blacks when it comes to traditional measures of internet and broadband adoption is more pronounced among certain demographic subgroups than among others. Specifically, older African Americans, as well as those who have not attended college, are significantly less likely to go online or to have broadband service at home compared to whites with a similar demographic profile. African Americans age 65 and older have especially low adoption rates compared with whites. Just 45% of black seniors are internet users, and 30% have broadband at home (among white seniors, 63% go online and 51% are broadband adopters).

On the other hand, young, college-educated, and higher-income African Americans are just as likely as their white counterparts to use the internet and to have broadband service at home. Some 86% of African Americans ages 18-29 are home broadband adopters, as are 88% of black college graduates and 91% of African Americans with an annual household income of $75,000 or more per year. These figures are all well above the national average for broadband adoption, and are identical to whites of similar ages, incomes, and education levels.

Twitter is especially popular among younger African Americans

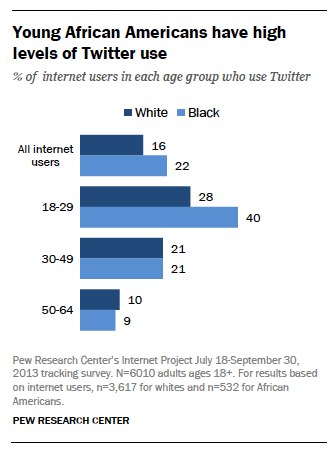
Overall, 73% of African American internet users—and 96% of those ages 18-29—use a social networking site of some kind. African Americans have exhibited relatively high levels of Twitter use since we began tracking the service as a stand-alone platform, and this continues to be the case—22% of online blacks are Twitter users, compared with 16% of online whites.
Young African Americans have high levels of Twitter use

Younger African Americans in particular have especially high rates of Twitter use. Fully 40% of 18-29 year old African Americans who use the internet say that they use Twitter. That is 12 percentage points higher than the comparable figure for young whites (28% of whom are Twitter users).

The mobile difference: 92% of African Americans own a cell phone, and 56% own a smartphone

In contrast to internet use and broadband adoption, blacks and whites are equally likely to own a cell phone of some kind, and also have identical rates of smartphone ownership. Some 92% of black adults are cell phone owners, and 56% own a smartphone of some kind. Cell phone ownership is much more common than internet use among older African Americans. Just 45% of African Americans ages 65 and older use the internet, but 77% are cell phone owners (most of these seniors own basic cell phones, as only 18% are smartphone owners). Overall, 72% of all African Americans—and 98% of those between the ages of 18 and 29—have either a broadband connection or a smartphone.

About this survey

The findings in this report are based on data from telephone interviews conducted by Princeton Survey Research Associates International from July 18 to September 30, 2013, among a sample of 6,010 adults ages 18 and older.  Telephone interviews were conducted in English and Spanish by landline and cell phone.

Findings for African Americans are based on the 664 respondents who identified themselves as black or African American, and not of Hispanic or Latino background. In the interest of readability, throughout this report African Americans are compared only to whites, and not to other racial or ethnic groups. The Pew Research Center’s Hispanic Trends Project has collected data recently on technology use among Latinos, which can be found at https://alpha.pewresearch.org/pewresearch-org/hispanic/.

Additionally, we do not report findings based on geographic location because the number of rural African Americans in this survey (n=75) was too small to report.

Detailed Demographic Tables

Internet use and Broadband adoption

Nationally, there is a seven percentage point gap between whites and blacks when it comes to internet use. Internet use is nearly universal among younger adults, the college-educated, and those with relatively high incomes, regardless of race. But older blacks are significantly less likely to go online than their white counterparts—just 45% of African Americans age 65 or older use the internet. Internet use is also notably less common among blacks who have not attended college, compared with whites with a similar level of educational attainment.

Internet Usage, White vs. African American

The broadband adoption gap between whites and blacks is around twice as big as for internet use in general—12 percentage points. As with internet use, differences between white and black are most concentrated among older adults and those with low levels of educational attainment. Just 30% of African Americans age 65 or older, and 39% of African Americans who have not attended college, are home broadband users. By contrast, broadband adoption is nearly universal among young adults, the college educated, and those in higher-income households, regardless of whether those individuals are black or white.

Broadband at home, White vs. African American

The following table summarizes internet use and broadband adoption among African Americans.

Summary table of internet use among African Americans

Cell phone ownership

90% of whites and 92% of African Americans own a cell phone of some kind, and there are few differences between whites and blacks across demographic categories when it comes to cell phone ownership.

Cell phone ownership, White vs. African American

Smartphone ownership

Smartphone ownership is equally common among blacks and whites—56% of African Americans and 53% of whites are smartphone owners. For both blacks and whites, smartphone ownership is strongly correlated with age: just 18% of seniors of either race own a smartphone.

Smartphone Ownership, White vs. African American

Some 10% of African American adults indicate that they do not have a traditional broadband connection in their home, but that they do own a smartphone. This means that 72% of African Americans have either a home broadband connection or a smartphone (or both). Here is how that 72% breaks down:

  • 46% of African Americans have both a broadband connection and a smartphone
  • 16% have home broadband connection, but not a smartphone
  • 10% have a smartphone, but not broadband at home

Ultimately, smartphones narrow—but do not eliminate entirely—the “high speed access gap” between whites and blacks. As noted above there is a 12-point difference between whites and blacks when it comes to home broadband adoption; by contrast, there is an 8-point difference between whites and blacks when it comes to the proportion of each group who has either a home broadband connection or a smartphone.

Broadband and/or smartphone adoption

Social networking sites and Twitter

Social networking site adoption is identical among white and black internet users1: 72% of online whites and 73% of online blacks use online social networks. For both whites and blacks, social networking site usage is near-ubiquitous among students and young adults (some 96% of black internet users ages 18-29 are social networking site users).

Social networking site use, among White vs. African American internet users

As has consistently been the case since we began studying Twitter as a standalone platform, African Americans have higher levels of Twitter use than whites (22% of online blacks are Twitter users, compared with 16% of online whites). Younger African Americans have especially high rates of Twitter usage—a full 40% of African American internet users ages 18-29 say that they use Twitter, compared with 28% of whites of the same age.

Twitter use, among White vs. African American internet users

Tablet computers and e-readers

Both tablet computer and e-reader ownership levels are five percentage points lower among African Americans than among whites. Some 29% of African Americans (vs. 34% of whites) own a tablet computer, and 21% own an e-reader (vs. 26% of whites).

Tablet Computer Ownership, White vs. African American


E-Reader Ownership, White vs. African American

Methods

The Pew Research Center Library Survey, sponsored by the Pew Research Center’s Internet & American Life Project and the Gates Foundation, obtained telephone interviews with a nationally representative sample of 6,224 people ages 16 and older living in the United States. Interviews were conducted via landline (nLL=3,122) and cell phone (nC=3,102, including 1,588 without a landline phone). The survey was conducted by Princeton Survey Research Associates International. The interviews were administered in English and Spanish by Princeton Data Source from July 18 to September 30, 2013 . Statistical results are weighted to correct known demographic discrepancies. The margin of sampling error for results based on the complete set of weighted data is ±1.4 percentage points.  Results based on the 5,320 internet users  have a margin of sampling error of ±1.5 percentage points.

A combination of landline and cellular random digit dial (RDD) samples was used to represent all adults in the United States who have access to either a landline or cellular telephone. Both samples were provided by Survey Sampling International, LLC (SSI) according to PSRAI specifications. Numbers for the landline sample were drawn with probabilities in proportion to their share of listed telephone households from active blocks (area code + exchange + two-digit block number) that contained three or more residential directory listings. The cellular sample was not list-assisted, but was drawn through a systematic sampling from dedicated wireless 100-blocks and shared service 100-blocks with no directory-listed landline numbers.

Interviews were conducted from July 18 to September 30, 2013. As many as 10 attempts were made to contact every sampled telephone number. Sample was released for interviewing in replicates, which are representative subsamples of the larger sample. Using replicates to control the release of sample ensures that complete call procedures are followed for the entire sample. Calls were staggered over times of day and days of the week to maximize the chance of making contact with potential respondents. Interviewing was spread as evenly as possible across the days in field. Each telephone number was called at least one time during the day in an attempt to complete an interview.

For the landline sample, interviewers asked to speak with the youngest male or female ages 16 or older currently at home based on a random rotation. If no male/female was available, interviewers asked to speak with the youngest person age 16 or older of the other gender. This systematic respondent selection technique has been shown to produce samples that closely mirror the population in terms of age and gender when combined with cell interviewing.

For the cellular sample, interviews were conducted with the person who answered the phone. Interviewers verified that the person was age 16 or older and in a safe place before administering the survey. Cellular respondents were offered a post-paid cash reimbursement for their participation. Weighting is generally used in survey analysis to compensate for sample designs and patterns of non-response that might bias results. The sample was weighted to match national adult general population parameters. A two-stage weighting procedure was used to weight this dual-frame sample.

The first stage of weighting corrected for different probabilities of selection associated with the number of adults in each household and each respondent’s telephone usage patterns.  This weighting also adjusts for the overlapping landline and cell sample frames and the relative sizes of each frame and each sample.

The second stage of weighting balances sample demographics to population parameters. The sample is balanced to match national population parameters for sex, age, education, race, Hispanic origin, region (U.S. Census definitions), population density, and telephone usage. The Hispanic origin was split out based on nativity; U.S born and non-U.S. born. The White, non-Hispanic subgroup was also balanced on age, education and region. The basic weighting parameters came from the US Census Bureau’s 2011 American Community Survey data.  The population density parameter was derived from Census 2010 data. The telephone usage parameter came from an analysis of the July-December 2012 National Health Interview Survey.

Weighting was accomplished using Sample Balancing, a special iterative sample weighting program that simultaneously balances the distributions of all variables using a statistical technique called the Deming Algorithm. Weights were trimmed to prevent individual interviews from having too much influence on the final results. The use of these weights in statistical analysis ensures that the demographic characteristics of the sample closely approximate the demographic characteristics of the national population.

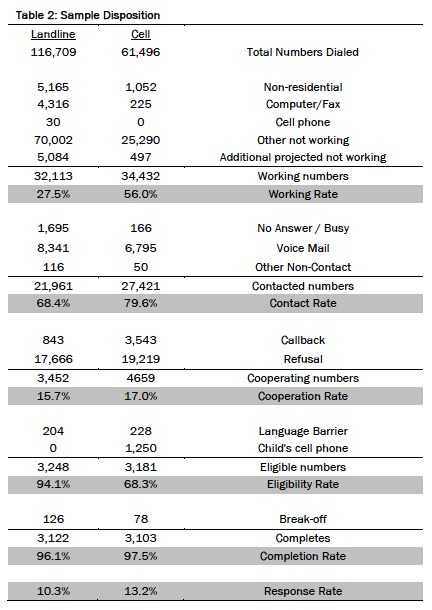
Table 2 reports the disposition of all sampled telephone numbers ever dialed from the original telephone number samples. The response rate estimates the fraction of all eligible respondents in the sample that were ultimately interviewed. At PSRAI it is calculated by taking the product of three component rates:

  • Contact rate – the proportion of working numbers where a request for interview was made
  • Cooperation rate – the proportion of contacted numbers where a consent for interview was at least initially obtained, versus those refused
  • Completion rate – the proportion of initially cooperating and eligible interviews that were completed

Thus the response rate for the landline sample was 10 percent. The response rate for the cellular sample was 13 percent.

Sample Disposition