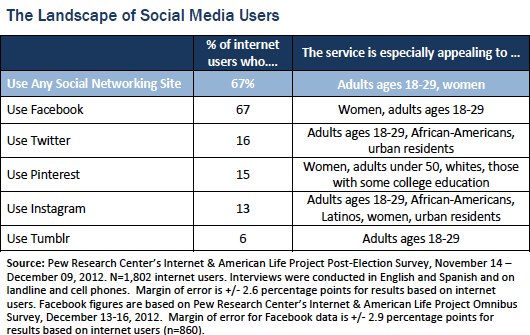
Young adults are more likely than older adults to use social media. Women, African-Americans, and Latinos show high interest in sites like Twitter, Instagram, and Pinterest.
BYMaeve Duggan and Joanna Brenner
About Pew Research Center
Pew Research Center is a nonpartisan, nonadvocacy fact tank that informs the public about the issues, attitudes and trends shaping the world. It does not take policy positions. The Center conducts public opinion polling, demographic research, computational social science research and other data-driven research. It studies politics and policy; news habits and media; the internet and technology; religion; race and ethnicity; international affairs; social, demographic and economic trends; science; research methodology and data science; and immigration and migration. Pew Research Center is a subsidiary of The Pew Charitable Trusts, its primary funder.
Young adults are more likely than older adults to use social media. Women, African-Americans, and Latinos show high interest in sites like Twitter, Instagram, and Pinterest.
A late 2012 survey by the Pew Research Center’s Internet & American Life Project shows that young adults are more likely than others to use major social media. At the same time, other groups are interested in different sites and services. In the case of Pinterest, Instagram, and Tumblr, these are the first reportable survey readings by Pew Research allowing comparison of whites, African-Americans, and Latinos.
These readings come from a national survey conducted between November 14 and December 9, 2012 on landline and cell phones and in English and in Spanish. The results reported here come from the 1,802 respondents who are internet users and the margin of error is +/- 2.6 percentage points.
Figures on Facebook usage are taken from a separate Pew Research Center survey conducted in December 2012. For more in-depth information about Americans’ Facebook habits, see our recent report “Coming and Going on Facebook.”
Social Networking Site Users
Overall use
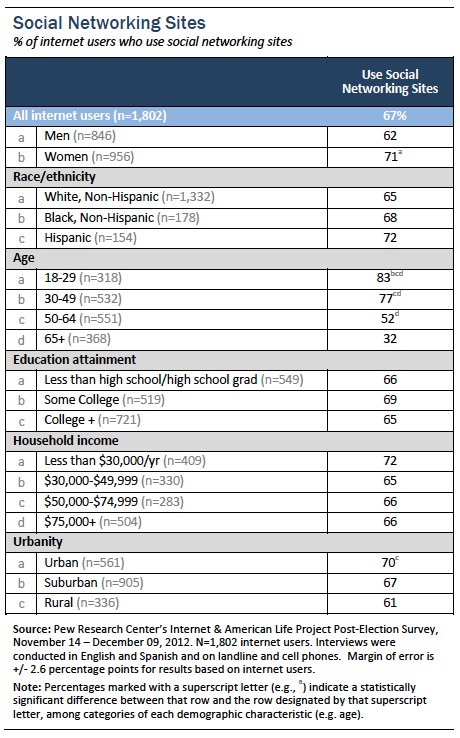
Internet users under 50 are particularly likely to use a social networking site of any kind, and those 18-29 are the most likely of any demographic cohort to do so (83%). Women are more likely than men to be on these sites. Those living in urban settings are also significantly more likely than rural internet users to use social networking.
Demographic breakdowns of various social media services
Twitter users
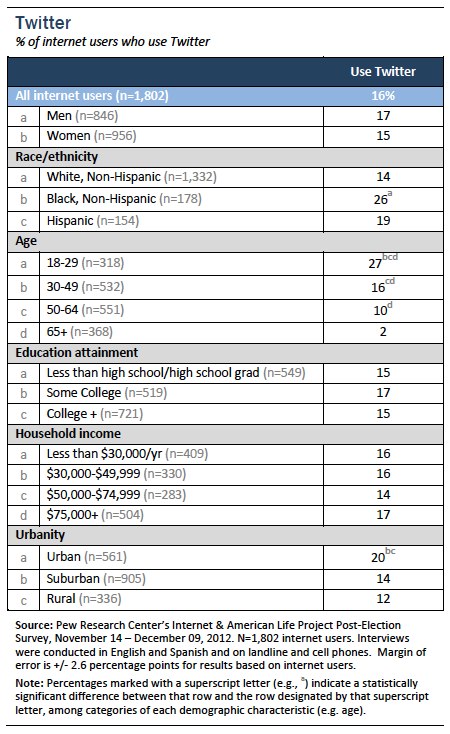
The percentage of internet users who are on Twitter has doubled since November 2010, currently standing at 16%. Those under 50, and especially those 18-29, are the most likely to use Twitter. Urban-dwellers are significantly more likely than both suburban and rural residents to be on Twitter.
Pinterest users
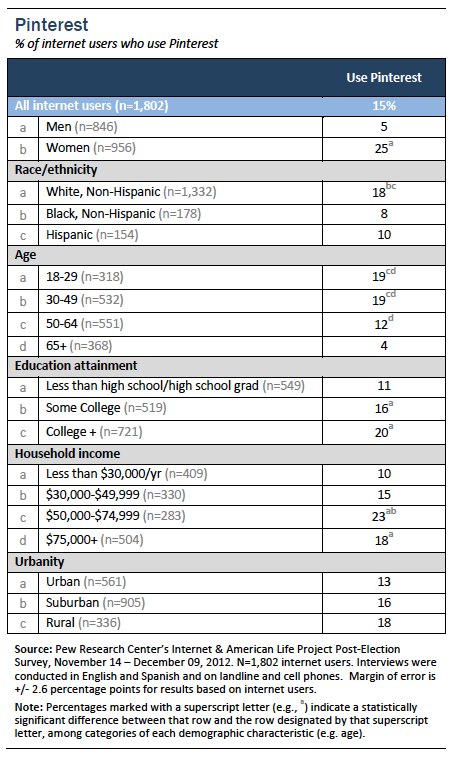
Pinterest, the online pinboard, has attracted 15% of internet users to its virtual scrapbooking. Whites, young people, the well-educated, those with higher income, and women are particularly likely to use the site. Pinterest is equally popular among those 18-29 and 30-49 (19%). Women are about five times as likely to be on the site as men, the largest difference in gender of any site featured in this report.
Instagram users
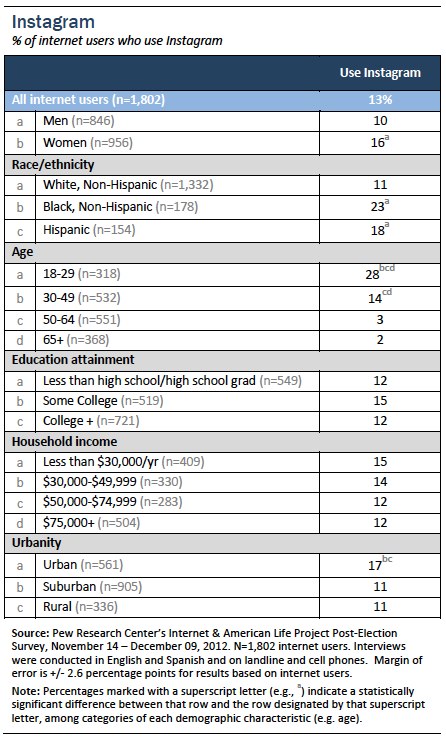
Thirteen percent of internet users are taking and sharing pictures with Instagram. Women are more likely than men to use the site, as are those under 50. African-Americans and Hispanics are more likely than whites to use Instagram, along with urban residents.
Tumblr users
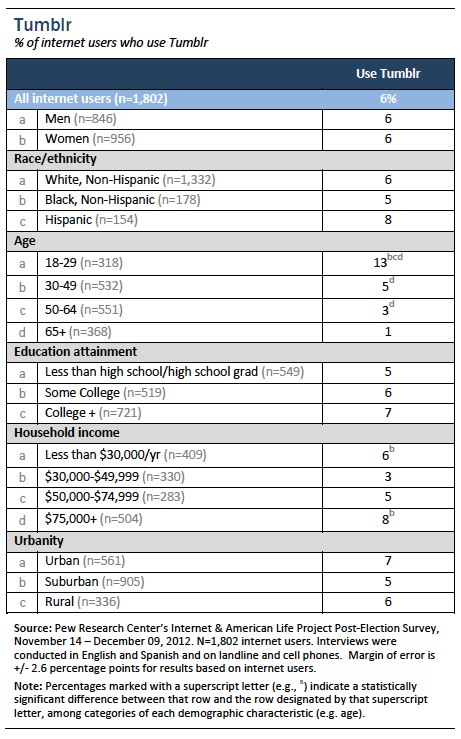
Tumblr is significantly less popular among internet users than the other social networking sites featured in this report. Just 6% of those online use the site. It is much more popular, however, among the youngest cohort — 13% of those 18-29 are blogging on Tumblr.
Facebook users
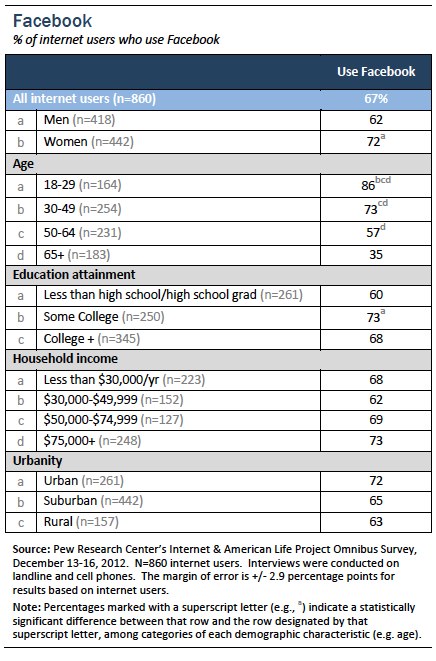
Facebook remains the most-used social networking platform, as two-thirds of online adults say that they are Facebook users. Women are more likely than men to be Facebook users, and Facebook use is especially common among younger adults.
About the Pew Research Center’s Internet & American Life Project
is one of seven projects that make up the Pew Research Center, a nonpartisan, nonprofit “fact tank” that provides information on the issues, attitudes and trends shaping America and the world. The Project produces reports exploring the impact of the internet on families, communities, work and home, daily life, education, health care, and civic and political life. The Pew Internet Project takes no positions on policy issues related to the internet or other communications technologies. It does not endorse technologies, industry sectors, companies, nonprofit organizations, or individuals.
Methodology
This report is based on the findings of a survey on Americans’ use of the Internet. The results in this report are based on data from telephone interviews conducted by Princeton Survey Research Associates International from November 14 to December 9, 2012, among a sample of 2,261 adults, age 18 and older. Telephone interviews were conducted in English and Spanish by landline (1,353) and cell phone (908, including 471 without a landline phone). For results based on the total sample, one can say with 95% confidence that the error attributable to sampling is plus or minus 2.3 percentage points. For results based on Internet users1 (n=1,802), the margin of sampling error is plus or minus 2.6 percentage points. In addition to sampling error, question wording and practical difficulties in conducting telephone surveys may introduce some error or bias into the findings of opinion polls.
A combination of landline and cellular random digit dial (RDD) samples was used to represent all adults in the United States who have access to either a landline or cellular telephone. Both samples were provided by Survey Sampling International, LLC (SSI) according to PSRAI specifications. Numbers for the landline sample were selected with probabilities in proportion to their share of listed telephone households from active blocks (area code + exchange + two-digit block number) that contained three or more residential directory listings. The cellular sample was not list-assisted, but was drawn through a systematic sampling from dedicated wireless 100-blocks and shared service 100-blocks with no directory-listed landline numbers.
New sample was released daily and was kept in the field for at least five days. The sample was released in replicates, which are representative subsamples of the larger population. This ensures that complete call procedures were followed for the entire sample. At least 7 attempts were made to complete an interview at a sampled telephone number. The calls were staggered over times of day and days of the week to maximize the chances of making contact with a potential respondent. Each number received at least one daytime call in an attempt to find someone available. For the landline sample, interviewers asked to speak with the youngest adult male or female currently at home based on a random rotation. If no male/female was available, interviewers asked to speak with the youngest adult of the other gender. For the cellular sample, interviews were conducted with the person who answered the phone. Interviewers verified that the person was an adult and in a safe place before administering the survey. Cellular sample respondents were offered a post-paid cash incentive for their participation. All interviews completed on any given day were considered to be the final sample for that day.
Weighting is generally used in survey analysis to compensate for sample designs and patterns of non-response that might bias results. A two-stage weighting procedure was used to weight this dual-frame sample. The first-stage corrected for different probabilities of selection associated with the number of adults in each household and each respondent’s telephone usage patterns.2 This weighting also adjusts for the overlapping landline and cell sample frames and the relative sizes of each frame and each sample.
The second stage of weighting balances sample demographics to population parameters. The sample is balanced to match national population parameters for sex, age, education, race, Hispanic origin, region (U.S. Census definitions), population density, and telephone usage. The Hispanic origin was split out based on nativity; U.S born and non-U.S. born. The White, non-Hispanic subgroup is also balanced on age, education and region. The basic weighting parameters came from a special analysis of the Census Bureau’s 2011 Annual Social and Economic Supplement (ASEC) that included all households in the United States. The population density parameter was derived from Census data. The cell phone usage parameter came from an analysis of the July-December 2011 National Health Interview Survey.3
The disposition reports all of the sampled telephone numbers ever dialed from the original telephone number samples. The response rate estimates the fraction of all eligible respondents in the sample that were ultimately interviewed. At PSRAI it is calculated by taking the product of three component rates:
Contact rate – the proportion of working numbers where a request for interview was made
Cooperation rate – the proportion of contacted numbers where a consent for interview was at least initially obtained, versus those refused
Completion rate – the proportion of initially cooperating and eligible interviews that were completed
Thus the response rate for the landline sample was 11 percent. The response rate for the cellular sample was 13 percent.