
Pew Research Center

FOR RELEASE DECEMBER 14, 2011

Where people get information about restaurants and other local businesses

The internet is the source that people most rely on for material about the local business scene and search engines are particularly valued. Newspapers and word of mouth also rank high as sources.

BY Lee Rainie, Kristen Purcell, Amy Mitchell and Tom Rosenstiel

FOR MEDIA OR OTHER INQUIRIES:

Communications Department
202.419.4372
www.pewresearch.org

RECOMMENDED CITATION

Pew Research Center, December 2011, "Where people get information about restaurants and other local businesses"

About Pew Research Center

Pew Research Center is a nonpartisan, nonadvocacy fact tank that informs the public about the issues, attitudes and trends shaping the world. It does not take policy positions. The Center conducts public opinion polling, demographic research, computational social science research and other data-driven research. It studies politics and policy; news habits and media; the internet and technology; religion; race and ethnicity; international affairs; social, demographic and economic trends; science; research methodology and data science; and immigration and migration. Pew Research Center is a subsidiary of The Pew Charitable Trusts, its primary funder.

© Pew Research Center 2026

Table of contents

  • About Pew Research Center
  • Where people get information about restaurants and other local businesses
  • Local businesses other than restaurants, bars, and clubs
  • Methodology

Where people get information about restaurants and other local businesses

The internet is the source that people most rely on for material about the local business scene and search engines are particularly valued. Newspapers and word of mouth also rank high as sources.

People looking for information about local restaurants and other businesses say they rely on the internet, especially search engines, ahead of any other source.

Newspapers, both printed copies and the websites of newspaper companies, run second behind the internet as the source that people rely on for news and information about local businesses, including restaurants and bars.

And word of mouth, particularly among non-internet users, is also an important source of information about local businesses. 

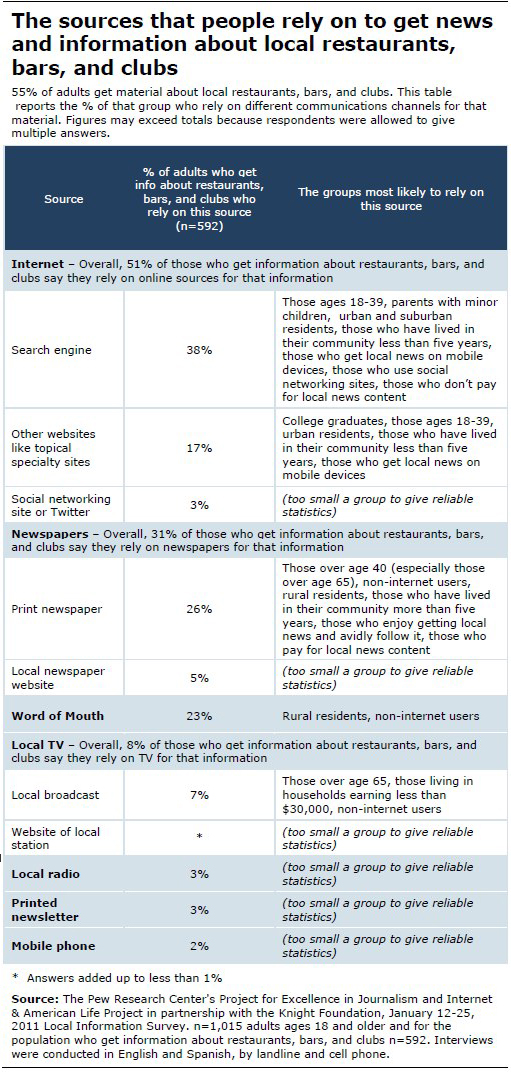
Some 55% of adults say they get news and information about local restaurants, bars, and clubs.  When they seek such information, here are the sources they say they rely on most:

· 51% turn to the internet, including:

      o   search engines – 38% rely on them
          o   specialty websites – 17% rely on them
          o   social media – 3% rely on social networking sites or Twitter2

· 31% rely on newspapers, including

      o   printed copies – 26% rely on them
          o   newspaper websites – 5% rely on them

· 23% rely on word of mouth

· 8% rely on local TV, either broadcasts or websites

Some 60% of adults say they get news and information about local businesses other than restaurants and bars. When they do:

· 47% say they rely most on the internet, including:

      o    search engines – 36% rely on them
          o   specialty websites – 16% rely on them
          o   social media – 1% rely on social network sites or Twitter

· 30% rely most on newspapers, including:

      o   printed newspapers – 29% rely most on that
          o   newspaper websites – 2% rely on them

· 22% rely on word of mouth from family and friends

· 8% rely on local TV, either broadcasts or the websites of local stations

·  5% rely on local radio

People who seek out information and news about local businesses and restaurants are a diverse and somewhat upscale group. As distinct populations, they are more likely to live in relatively well-off households – those earning $75,000 or more – and have college educations.

In addition, the 55% of adults who get information about restaurants, bars, and clubs are more likely to be women, young adults, urban, and technology adopters.

The 60% of adults who get information about other local businesses are also more likely to be tech users.

Background on this report

Together, these subjects are among the most popular of 16 local topics explored in a national survey by the Pew Research Center’s Project for Excellence in Journalism and Internet & American Life Project, produced in association with the John S. and James L. Knight Foundation. The survey probed how people learn about their communities in a new way, asking about specific subjects and discovered that people use a complex range of different sources.

Last September, we issued an overview report on this survey called “How people learn about their local community.” In broad terms, it covered on the sources that people rely on for news and information about their communities on a host of different topics.

This report offers a more in-depth examination of two closely-related topics that were part of that survey. It expands on that earlier work by 1) looking at the people who get information about local businesses and restaurants; 2) looking at all the sources they use; and 3) examining which sources of information are most relied upon by which people.

The survey was conducted on January 12-25, 2011. In the part of the survey that dealt with those who get information about local businesses and restaurants, 1,087 adults (age 18 and older) were interviewed by landline and cell phones, in English and Spanish. The margin of error for the full sample is 3.3 percentage points. For the subpopulation of people who say they get information about restaurants, bars, and clubs the number of respondents (which we label as “n”) is 592 and the margin of error for that sample is 4.4 percentage points. For the group who get information about local businesses other than restaurants, bars, and clubs is 667 and the margin of error for that sample is 4.2 percentage points.

Who gets information about local restaurants, bars, and clubs

We asked separately about restaurants, bars, and clubs versus other local businesses because we thought entertainment establishments such eateries and bars were a distinct category of local business that might draw a different audience and might show different patterns of information seeking. That proved to be the case.

The 55% of all adults who get information about restaurants, bars, and clubs are disproportionately young, female, tech adaptive and upscale in educational attainment, urban.

Who gets information about local restaurants, bars, and clubs

Those who get news and information about local restaurants, bars, and clubs are also likely to be avid local news consumers who enjoy following the local scene, pay for local news in some form, and use multiple platforms to get the local information. 

Those who are heavy local news junkies are considerably more likely than others to get material about local restaurants. We asked people about their use of 14 different kinds of sources to get local news and their frequency of using those platforms.3 When it comes to restaurant information, 71% of those who used at least six platforms monthly got news and information about local restaurants, compared with 34% of those who relied on just one or two sources.  

Additionally, we asked people if they got local news and information their cell phones, and 47% of all adults said they did.4 These mobile consumers, who were younger and more upscale in terms of their household income and educational levels, were even more likely than others to get material about local restaurants: 62% of mobile local news consumers got information about local businesses, compared with 48% of others.

The platforms people use to get information about local restaurants, bars, and clubs

We asked the 55% of adults who said they got information about local restaurants what sources they relied on for such information.

  • Internet : 51% of those who get information about local entertainment businesses rely most on some kind of online source for that material.
  • Newspaper : 31% of them say they rely on newspaper material either in printed form or the website of their local newspaper for information about restaurants, bars, and clubs
  • Word of mouth: 23% of them say they rely on other people most of all for news and information about for information about restaurants, bars, and clubs
  • Local TV: 8% of them say they rely on TV for news about for information about restaurants, bars, and clubs – either broadcasts or the stations’ websites
The sources that people rely on to get news and information about local businesses (other than restaurants, bars, and clubs)

When it comes to getting information about local restaurants, bars, and clubs 12% of the respondents in this category cited other sources beyond the main categories that we used.5 These answers were not specifically recorded, but might have included such things as advertising messaging via such things as billboards, signs, or phone directories; stranger recommendations; observations of foot traffic to stores; and general awareness of the local scene that didn’t arise from any particular information source.

Local businesses other than restaurants, bars, and clubs

Who gets information about local businesses (not including restaurants, bars, clubs)

Those who get information about local businesses that are not tied to eating or socializing are a diverse and somewhat upscale group. Those who get this information are more likely to have college or advanced degrees, live in relatively high-earning households, use the internet and own cell phones. They are not distinct by gender or race and ethnicity.

Who gets information about local businesses (not including restaurants, bars, clubs)

They are also likely to be local news and information junkies. Those who get news and information from at least six different local news platforms monthly are considerably more likely than others to get material about local businesses.

We asked people about their use of 14 different kinds of sources to get local news and their frequency of using those platforms.5 Some 72% of those who used at least six platforms monthly got news and information about local businesses, compared with 39% of those who relied on just one or two sources.   

Additionally, we asked people if they got local news and information their cell phones and 47% of all adults said they did.6

Those mobile consumers were also more likely than others to get material about local businesses: 65% of mobile local news consumers got information about local businesses, compared with 55% of others.

The platforms people use to get information about local businesses

We asked the 60% of adults who said they got information about local businesses what sources they relied on for such information. In broad terms:

  • Internet : 47% say some kind of online source is the one they most rely upon.
  • Newspaper : 30% say they most rely on newspaper material either in printed form or the website of their local newspaper for local business information
  • Word of mouth: 22% say they rely on other people most of all for news and information about local businesses
  • Local TV: 8% say they rely on TV for news about local businesses – either broadcasts or the stations’ websites
  • Local radio: 5% of adults say they rely on local radio

The sources that people rely on to get news and information about local restaurants, bars, and clubs

When it comes to getting information about local businesses, some 11% of the respondents who get this kind of information cited other sources beyond the main categories that we used.7 These answers were not specifically recorded, but might have included such things as advertising messaging via such things as billboards, signs, or phone directories; salesclerk or stranger recommendations; observations of foot traffic to stores; and general awareness of brands or merchants that didn’t arise from any particular information source.

Methodology

This report is based on the findings of a survey on Americans’ use of the Internet. The results in this report are based on data from telephone interviews conducted by Princeton Survey Research Associates International from January 12 to 25, 2011, among a sample of 2,251 adults, age 18 and older.  Telephone interviews were conducted in English and Spanish by landline (1,501) and cell phone (750, including 332 without a landline phone). For results based on the total sample, one can say with 95% confidence that the error attributable to sampling is plus or minus 2.4 percentage points.  For results based Internet users (n=1,762), the margin of sampling error is plus or minus 2.7 percentage points.  In addition to sampling error, question wording and practical difficulties in conducting telephone surveys may introduce some error or bias into the findings of opinion polls.

A combination of landline and cellular random digit dial (RDD) samples was used to represent all adults in the continental United States who have access to either a landline or cellular telephone. Both samples were provided by Survey Sampling International, LLC (SSI) according to PSRAI specifications.  Numbers for the landline sample were selected with probabilities in proportion to their share of listed telephone households from active blocks (area code + exchange + two-digit block number) that contained three or more residential directory listings. The cellular sample was not list-assisted, but was drawn through a systematic sampling from dedicated wireless 100-blocks and shared service 100-blocks with no directory-listed landline numbers.

New sample was released daily and was kept in the field for at least five days. The sample was released in replicates, which are representative subsamples of the larger population. This ensures that complete call procedures were followed for the entire sample.  At least 7 attempts were made to complete an interview at a sampled telephone number. The calls were staggered over times of day and days of the week to maximize the chances of making contact with a potential respondent. Each number received at least one daytime call in an attempt to find someone available. For the landline sample, interviewers asked to speak with the youngest adult male or female currently at home based on a random rotation. If no male/female was available, interviewers asked to speak with the youngest adult of the other gender. For the cellular sample, interviews were conducted with the person who answered the phone. Interviewers verified that the person was an adult and in a safe place before administering the survey. Cellular sample respondents were offered a post-paid cash incentive for their participation. All interviews completed on any given day were considered to be the final sample for that day.

Weighting is generally used in survey analysis to compensate for sample designs and patterns of non-response that might bias results. A two-stage weighting procedure was used to weight this dual-frame sample. The first-stage weight is the product of two adjustments made to the data – a Probability of Selection Adjustment (PSA) and a Phone Use Adjustment (PUA). The PSA corrects for the fact that respondents in the landline sample have different probabilities of being sampled depending on how many adults live in the household. The PUA corrects for the overlapping landline and cellular sample frames.

The second stage of weighting balances sample demographics to population parameters. The sample is balanced by form to match national population parameters for sex, age, education, race, Hispanic origin, region (U.S. Census definitions), population density, and telephone usage. The White, non-Hispanic subgroup is also balanced on age, education and region. The basic weighting parameters came from a special analysis of the Census Bureau’s 2010 Annual Social and Economic Supplement (ASEC) that included all households in the continental United States. The population density parameter was derived from Census 2000 data. The cell phone usage parameter came from an analysis of the January-June 2010 National Health Interview Survey.8

Following is the full disposition of all sampled telephone numbers:

table 2

The disposition reports all of the sampled telephone numbers ever dialed from the original telephone number samples. The response rate estimates the fraction of all eligible respondents in the sample that were ultimately interviewed. At PSRAI it is calculated by taking the product of three component rates:

  • Contact rate – the proportion of working numbers where a request for interview was made
  • Cooperation rate – the proportion of contacted numbers where a consent for interview was at least initially obtained, versus those refused
  • Completion rate – the proportion of initially cooperating and eligible interviews that were completed

Thus the response rate for the landline sample was 13.4 percent. The response rate for the cellular sample was 15.5 percent.

Topline Survey Results

The topline for this report is available to download as a PDF here.