Eight percent of online adults use Twitter. It is particularly popular with young adults, minorities, and those who live in cities.
BYAaron Smith and Lee Rainie
About Pew Research Center
Pew Research Center is a nonpartisan, nonadvocacy fact tank that informs the public about the issues, attitudes and trends shaping the world. It does not take policy positions. The Center conducts public opinion polling, demographic research, computational social science research and other data-driven research. It studies politics and policy; news habits and media; the internet and technology; religion; race and ethnicity; international affairs; social, demographic and economic trends; science; research methodology and data science; and immigration and migration. Pew Research Center is a subsidiary of The Pew Charitable Trusts, its primary funder.
Eight percent of online adults use Twitter. It is particularly popular with young adults, minorities, and those who live in cities.
Overview: The people who use Twitter
Eight percent of the American adults who use the internet are Twitter users. It is an online activity that is particularly popular with young adults, minorities, and those who live in cities.
This is the first-ever survey reading from the Pew Research Center’s Internet & American Life Project that exclusively examines Twitter users. In previous surveys, the Project had asked internet users whether they “used Twitter or another service to share updates about yourself or to see updates about others?”
Here is a little background on our reasoning for focusing just on Twitter in this more recent survey: The message service Twitter launched on July 15, 2006 and now claims tens of millions of users worldwide. It is one of the most popular online activities among tech enthusiasts and has become a widely used tool among analysts to study the conversations and interests of users, buzz about news, products or services, and announcements by commercial, non-profit, and government organizations. For instance, it is an important component of the analytical work by our colleagues at the Pew Research Center’s Project for Excellence in Journalism in its New Media Index, which assesses the most prominent topics discussed in social media every week.1
Since August 2008, the Pew Research Center’s Internet & American Life Project has been asking a question in occasional national telephone surveys about services like Twitter. In the 10-year lifespan of the Pew Internet Project, we have not usually asked about single, company-specific online applications or activities because our mission is to look generally at online activities, rather than at specific brands. For instance, when we looked at teens and gaming, we focused on genres of computer and online games, rather than usage of particular games.
In the case of Twitter, we initially framed the question in a way we hoped would capture Twitter users and others who use the same functionality on other kinds of internet services. Thus, our status update question in eight surveys between August 2008 and September 2010 asked: “Do you ever use the internet to use Twitter or another service to share updates about yourself or to see updates about others?”
In August 2008, 6% of internet users said “yes” to that question. In September 2010, 24% of internet users said “yes.” When we reported the findings at various points, much of the news coverage and public attention to those findings noted that the question – and the answers – covered more than just the Twitter-using population. But some analysts and readers clearly thought our figures simply stood for all Twitter users.
As we saw that impression taking hold, and as it was becoming clear that Twitter users were emerging as an important research subject on their own, we decided to use question language that exclusively focuses on Twitter. We added a straightforward question to our tracking survey that took place in November 2010 where we asked online adults: “Do you use Twitter?” In this survey, 8% of online adults said they do use Twitter—with 2% doing so on a typical day. This survey also showed that 74% of American adults are internet users, meaning that the Twitter cohort amounts to 6% of the entire adult population. The table below shows the basic demographic breakdown of that population.
Some of the groups who are notable for their relatively high levels of Twitter use include:
Young adults – Internet users ages 18-29 are significantly more likely to use Twitter than older adults.
African-Americans and Latinos – Minority internet users are more than twice as likely to use Twitter as are white internet users.
Urbanites – Urban residents are roughly twice as likely to use Twitter as rural dwellers.
Women and the college-educated are also slightly more likely than average to use the service.
These findings about Twitter in Pew Internet’s regular tracking survey match the tests we ran on two omnibus surveys in October. Those omnibus surveys conducted by our polling partner, Princeton Survey Research Associates International, are weekly surveys onto which organizations can insert questions. In two differently weekly surveys in October, we also found that 8% of internet users said “yes” to the specific Twitter question.2
One-quarter of Twitter users check in multiple times per day for tweets from others, while one in five never check for new material on the site
In those omnibus surveys, we probed more deeply about how users engage with Twitter. There were 102 Twitter users in those surveys once we combined the datasets and the following material represents the findings from those Twitter users. We think that these findings provide a useful portrait of how Twitter users engage with the service. However, given the modest overall sample size these statistics are best understood as directional findings with a relatively large margin of error.
In the follow-up questions on those October surveys, we found that Twitter users are nearly equally divided between those who check the site on a daily basis (or multiple times per day) and those who check the site infrequently or never. Just over one-third of Twitter users (36%) check for material posted by others on a daily basis or multiple times per day—this is roughly comparable to the two in five (41%) who say they check the site less than every few weeks, or never do so at all. The remaining one-quarter of users say they check the site for updates a few days each week or every few weeks.
Twitter users post a wide range of content to the site
In addition to asking how often they check the site for updates about others, we also asked Twitter users how often (if ever) they use the site to post their own content. We asked about nine different types of content that Twitter users might post to the site, and found that Twitter users tend to comment on a relatively wide range of topics—the typical user posts four of the nine different types of tweets we asked about in our survey.
Overall, observations related to users’ personal or professional lives are the most popular types of updates, while location-based tweets and links to videos are the least commonly mentioned:
72% of Twitter users in our sample say that they post updates related to their personal life, activities or interests. A total of one in five Twitter users (19%) say they post personal updates once a day or more.
62% of those we queried said they post updates related to their work life, activities or interests, with 12% doing so on a daily basis.
55% of these Twitter users share links to news stories. One in ten (12%) do this at least once a day.
54% of these Twitter users say they post humorous or philosophical observations about life in general, with 16% doing so on a daily basis.
53% of these Twitter users use Twitter to retweet material posted by others, with 18% doing so on a daily basis.
52% of these Twitter users send direct messages to other users, with 11% doing so on a daily basis.
40% use Twitter to share photos with others, with 12% doing so at least once a day.
28% use Twitter to share videos with others. Fewer than one in ten Twitter users (8%) do this once a day or more.
24% use the service to tweet their location, with 7% of users doing so on a daily basis.
Methodology
Overview
This report contains data from several different sources. The data on overall Twitter usage and demographics comes from the Pew Internet Project’s November 2010 tracking survey, while the data on frequency of use and types of material posted by Twitter users comes from two Omnibus Surveys conducted in October 2010.
The two types of surveys, tracking and omnibus, collect data from nationally representative dual-frame (landline and cell phone) samples, employ the same respondent selection process, and identify internet users using identical questions. They are conducted by the same survey research firm, Princeton Survey Research Associates International, at the same field house. However, there are differences between the two types of surveys that should be noted when comparing data across them. First, tracking surveys consist of roughly 2,250 interviews completed over the course of three to four weeks. These surveys maintain a very close 2-to-5 ratio of weekend-to-weekday interviews, to minimize the impact of day-of-the-week effects. Omnibus surveys, in contrast, consist of roughly 1,000 interviews completed over the course of four days, usually a Thursday-to-Sunday timeframe. There is no specific control in omnibus surveys for weekend-to-weekday interview ratio. To the extent that day of the week impacts technology use and online behavior, this may introduce variance in the data across the two types of surveys.
Moreover, tracking surveys follow a 7-call design in which sample that has not reached a final disposition at the end of seven days is retired, unless there is an outstanding appointment or callback for that telephone number. The omnibus surveys use a 4-call design over the course of the 4-day field period. One result of these different approaches is that tracking surveys generally achieve higher response rates than omnibus surveys. Again, this difference could introduce variance in the data across the two types of surveys.
November 2010 Tracking Survey
The results in this report are based on data from telephone interviews conducted by Princeton Survey Research Associates International from November 3-24, 2010, among a sample of 2,257 adults, age 18 and older. Interviews were conducted in English and Spanish. For results based on the total sample, one can say with 95% confidence that the error attributable to sampling is plus or minus 2.4 percentage points. For results based Internet users (n=1,628), the margin of sampling error is plus or minus 2.8 percentage points. In addition to sampling error, question wording and practical difficulties in conducting telephone surveys may introduce some error or bias into the findings of opinion polls.
A combination of landline and cellular random digit dial (RDD) samples was used to represent all adults in the continental United States who have access to either a landline or cellular telephone. Both samples were provided by Survey Sampling International, LLC (SSI) according to PSRAI specifications. Numbers for the landline sample were selected with probabilities in proportion to their share of listed telephone households from active blocks (area code + exchange + two-digit block number) that contained three or more residential directory listings. The cellular sample was not list-assisted, but was drawn through a systematic sampling from dedicated wireless 100-blocks and shared service 100-blocks with no directory-listed landline numbers.
New sample was released daily and was kept in the field for at least five days. The sample was released in replicates, which are representative subsamples of the larger population. This ensures that complete call procedures were followed for the entire sample. At least 7 attempts were made to complete an interview at a sampled telephone number. The calls were staggered over times of day and days of the week to maximize the chances of making contact with a potential respondent. Each number received at least one daytime call in an attempt to find someone available. For the landline sample, half of the time interviewers first asked to speak with the youngest adult male currently at home. If no male was at home at the time of the call, interviewers asked to speak with the youngest adult female. For the other half of the contacts interviewers first asked to speak with the youngest adult female currently at home. If no female was available, interviewers asked to speak with the youngest adult male at home. For the cellular sample, interviews were conducted with the person who answered the phone. Interviewers verified that the person was an adult and in a safe place before administering the survey. Cellular sample respondents were offered a post-paid cash incentive for their participation. All interviews completed on any given day were considered to be the final sample for that day.
Weighting is generally used in survey analysis to compensate for sample designs and patterns of non-response that might bias results. A two-stage weighting procedure was used to weight this dual-frame sample. The first-stage weight is the product of two adjustments made to the data – a Probability of Selection Adjustment (PSA) and a Phone Use Adjustment (PUA). The PSA corrects for the fact that respondents in the landline sample have different probabilities of being sampled depending on how many adults live in the household. The PUA corrects for the overlapping landline and cellular sample frames.
The second stage of weighting balances sample demographics to population parameters. The sample is balanced by form to match national population parameters for sex, age, education, race, Hispanic origin, region (U.S. Census definitions), population density, and telephone usage. The White, non-Hispanic subgroup is also balanced on age, education and region. The basic weighting parameters came from a special analysis of the Census Bureau’s 2009 Annual Social and Economic Supplement (ASEC) that included all households in the continental United States. The population density parameter was derived from Census 2000 data. The cell phone usage parameter came from an analysis of the July-December 2009 National Health Interview Survey.
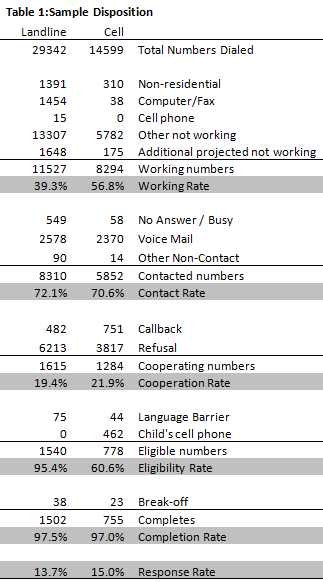
Following is the full disposition of all sampled telephone numbers:
The disposition reports all of the sampled telephone numbers ever dialed from the original telephone number samples. The response rate estimates the fraction of all eligible respondents in the sample that were ultimately interviewed. At PSRAI it is calculated by taking the product of three component rates:
Contact rate – the proportion of working numbers where a request for interview was made
Cooperation rate – the proportion of contacted numbers where a consent for interview was at least initially obtained, versus those refused
Completion rate – the proportion of initially cooperating and eligible interviews that were completed
Thus the response rate for the landline sample was 13.7 percent. The response rate for the cellular sample was 15.0 percent.
October 2010 Omnibus (Week 1)
The PSRAI October 2010 Omnibus Week 1 obtained telephone interviews with a nationally representative sample of 1,005 adults living in the continental United States. Telephone interviews were conducted by landline (673) and cell phone (332, including 152 without a landline phone). The survey was conducted by Princeton Survey Research Associates International (PSRAI). Interviews were done in English by Princeton Data Source from October 7-10, 2010. Statistical results are weighted to correct known demographic discrepancies. The margin of sampling error for the complete set of weighted data is ±3.6 percentage points.
Sample Design
A combination of landline and cellular random digit dial (RDD) samples was used to represent all adults in the continental United States who have access to either a landline or cellular telephone. Both samples were provided by Survey Sampling International, LLC (SSI) according to PSRAI specifications.
Numbers for the landline sample were drawn with probabilities in proportion to their share of listed telephone households from active blocks (area code + exchange + two-digit block number) that contained one or more residential directory listings. The cellular sample was not list-assisted, but was drawn through a systematic sampling from dedicated wireless 100-blocks and shared service 100-blocks with no directory-listed landline numbers.
Contact Procedures
Interviews were conducted from October 7-10, 2010. As many as five attempts were made to contact every sampled telephone number. Sample was released for interviewing in replicates, which are representative subsamples of the larger sample. Using replicates to control the release of sample ensures that complete call procedures are followed for the entire sample. Calls were staggered over times of day and days of the week to maximize the chance of making contact with potential respondents. Each phone number received at least one daytime call when necessary.
For the landline sample, interviewers asked to speak with the youngest adult male or female currently at home based on a random rotation. If no male/female was available, interviewers asked to speak with the youngest adult of the other gender. This systematic respondent selection technique has been shown to produce samples that closely mirror the population in terms of age and gender when combined with cell interviewing.
For the cellular sample, interviews were conducted with the person who answered the phone. Interviewers verified that the person was an adult and in a safe place before administering the survey.
Weighting and analysis
Weighting is generally used in survey analysis to compensate for sample designs and patterns of non-response that might bias results. The sample was weighted to match national adult general population parameters. A two-stage weighting procedure was used to weight this dual-frame sample.
The first stage of weighting corrected for different probabilities of selection associated with the number of adults in each household and each respondent’s telephone usage patterns. This weighting also adjusts for the overlapping landline and cell sample frames and the relative sizes of each frame and each sample.
This first-stage weight for the ith case can be expressed as:
The equations can be simplified by plugging in the values for SLL = 673 and SCP = 332. Additionally, we will estimate of the ratio of the size of landline sample frame to the cell phone sample frame R = 1.08.
The second stage of weighting balanced sample demographics to population parameters. The sample is balanced to match national population parameters for sex, age, education, race, Hispanic origin, region (U.S. Census definitions), population density, and telephone usage. The basic weighting parameters came from a special analysis of the Census Bureau’s 2009 Annual Social and Economic Supplement (ASEC) that included all households in the continental United States. The population density parameter was derived from Census 2000 data. The telephone usage parameter came from an analysis of the July-December 2009 National Health Interview Survey.
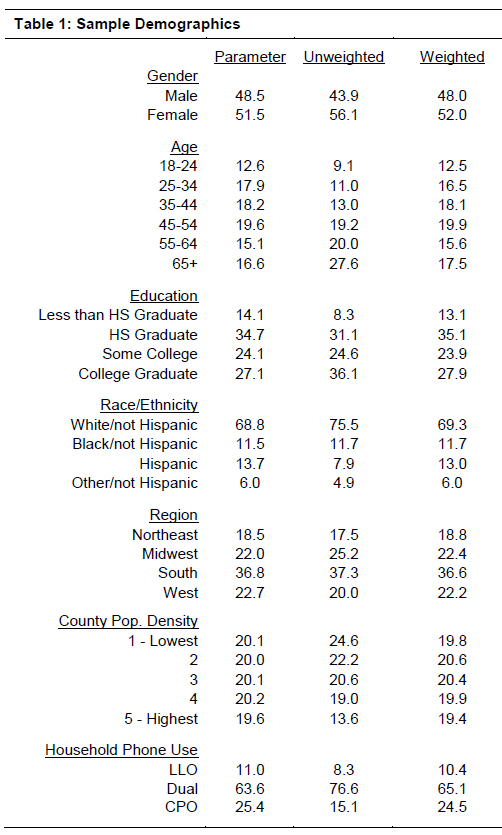
Weighting was accomplished using Sample Balancing, a special iterative sample weighting program that simultaneously balances the distributions of all variables using a statistical technique called the Deming Algorithm. Weights were trimmed to prevent individual interviews from having too much influence on the final results. The use of these weights in statistical analysis ensures that the demographic characteristics of the sample closely approximate the demographic characteristics of the national population. Table 1 compares weighted and unweighted sample distributions to population parameters.
Effects of Sample Design on Statistical Inference
Post-data collection statistical adjustments require analysis procedures that reflect departures from simple random sampling. PSRAI calculates the effects of these design features so that an appropriate adjustment can be incorporated into tests of statistical significance when using these data. The so-called “design effect” or deff represents the loss in statistical efficiency that results from a disproportionate sample design and systematic non-response. The total sample design effect for this survey is 1.36.
PSRAI calculates the composite design effect for a sample of size n, with each case having a weight, wi as:
In a wide range of situations, the adjusted standard error of a statistic should be calculated by multiplying the usual formula by the square root of the design effect (√deff ). Thus, the formula for computing the 95% confidence interval around a percentage is:
where pˆis the sample estimate and n is the unweighted number of sample cases in the group being considered.
The survey’s margin of error is the largest 95% confidence interval for any estimated proportion based on the total sample— the one around 50%. For example, the margin of error for the entire sample is ±3.6 percentage points. This means that in 95 out every 100 samples drawn using the same methodology, estimated proportions based on the entire sample will be no more than 3.6 percentage points away from their true values in the population. It is important to remember that sampling fluctuations are only one possible source of error in a survey estimate. Other sources, such as respondent selection bias, questionnaire wording and reporting inaccuracy, may contribute additional error of greater or lesser magnitude.
Response Rate
Table 2 report the disposition of all sampled telephone numbers ever dialed from the original telephone number samples. The response rate estimates the fraction of all eligible sample that was ultimately interviewed. At PSRAI it is calculated by taking the product of three component rates:
Contact rate – the proportion of working numbers where a request for interview was made
Cooperation rate – the proportion of contacted numbers where a consent for interview was at least initially obtained, versus those refused
Completion rate – the proportion of initially cooperating and eligible interviews that were completed
Thus the response rate for the land line samples was 10 percent. The response rate for the cellular samples was 20 percent.
October 2010 Omnibus (Week 4)
The PSRAI October 2010 Omnibus Week 4 obtained telephone interviews with a nationally representative sample of 1,003 adults living in the continental United States. Telephone interviews were conducted by landline (672) and cell phone (331, including 134 without a landline phone). The survey was conducted by Princeton Survey Research Associates International (PSRAI). Interviews were done in English by Princeton Data Source from October 28-November 1, 2010. Statistical results are weighted to correct known demographic discrepancies. The margin of sampling error for the complete set of weighted data is ±3.7 percentage points.
Sample Design
A combination of landline and cellular random digit dial (RDD) samples was used to represent all adults in the continental United States who have access to either a landline or cellular telephone. Both samples were provided by Survey Sampling International, LLC (SSI) according to PSRAI specifications.
Numbers for the landline sample were drawn with probabilities in proportion to their share of listed telephone households from active blocks (area code + exchange + two-digit block number) that contained one or more residential directory listings. The cellular sample was not list-assisted, but was drawn through a systematic sampling from dedicated wireless 100-blocks and shared service 100-blocks with no directory-listed landline numbers.
Contact Procedures
Interviews were conducted from October 28-November 1, 2010. As many as five attempts were made to contact every sampled telephone number. Sample was released for interviewing in replicates, which are representative subsamples of the larger sample. Using replicates to control the release of sample ensures that complete call procedures are followed for the entire sample. Calls were staggered over times of day and days of the week to maximize the chance of making contact with potential respondents. Each phone number received at least one daytime call when necessary.
For the landline sample, interviewers asked to speak with the youngest adult male or female currently at home based on a random rotation. If no male/female was available, interviewers asked to speak with the youngest adult of the other gender. This systematic respondent selection technique has been shown to produce samples that closely mirror the population in terms of age and gender when combined with cell interviewing.
For the cellular sample, interviews were conducted with the person who answered the phone. Interviewers verified that the person was an adult and in a safe place before administering the survey.
Weighting and analysis
Weighting is generally used in survey analysis to compensate for sample designs and patterns of non-response that might bias results. The sample was weighted to match national adult general population parameters. A two-stage weighting procedure was used to weight this dual-frame sample.
The first stage of weighting corrected for different probabilities of selection associated with the number of adults in each household and each respondent’s telephone usage patterns. This weighting also adjusts for the overlapping landline and cell sample frames and the relative sizes of each frame and each sample.
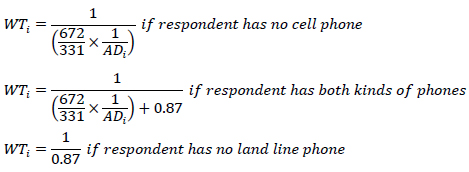
This first-stage weight for the ith case can be expressed as:
The equations can be simplified by plugging in the values for SLL = 672 and SCP = 331. Additionally, we will estimate of the ratio of the size of landline sample frame to the cell phone sample frame R = 0.87.
The second stage of weighting balanced sample demographics to population parameters. The sample is balanced to match national population parameters for sex, age, education, race, Hispanic origin, region (U.S. Census definitions), population density, and telephone usage. The basic weighting parameters came from a special analysis of the Census Bureau’s 2009 Annual Social and Economic Supplement (ASEC) that included all households in the continental United States. The population density parameter was derived from Census 2000 data. The telephone usage parameter came from an analysis of the July-December 2009 National Health Interview Survey.
Weighting was accomplished using Sample Balancing, a special iterative sample weighting program that simultaneously balances the distributions of all variables using a statistical technique called the Deming Algorithm. Weights were trimmed to prevent individual interviews from having too much influence on the final results. The use of these weights in statistical analysis ensures that the demographic characteristics of the sample closely approximate the demographic characteristics of the national population. Table 1 compares weighted and unweighted sample distributions to population parameters.
Effects of Sample Design on Statistical Inference
Post-data collection statistical adjustments require analysis procedures that reflect departures from simple random sampling. PSRAI calculates the effects of these design features so that an appropriate adjustment can be incorporated into tests of statistical significance when using these data. The so-called “design effect” or deff represents the loss in statistical efficiency that results from a disproportionate sample design and systematic non-response. The total sample design effect for this survey is 1.41.
PSRAI calculates the composite design effect for a sample of size n, with each case having a weight, wi as:
In a wide range of situations, the adjusted standard error of a statistic should be calculated by multiplying the usual formula by the square root of the design effect (√deff ). Thus, the formula for computing the 95% confidence interval around a percentage is:
where pˆis the sample estimate and n is the unweighted number of sample cases in the group being considered.
The survey’s margin of error is the largest 95% confidence interval for any estimated proportion based on the total sample— the one around 50%. For example, the margin of error for the entire sample is ±3.7 percentage points. This means that in 95 out every 100 samples drawn using the same methodology, estimated proportions based on the entire sample will be no more than 3.7 percentage points away from their true values in the population. It is important to remember that sampling fluctuations are only one possible source of error in a survey estimate. Other sources, such as respondent selection bias, questionnaire wording and reporting inaccuracy, may contribute additional error of greater or lesser magnitude.
Response Rate
Table 2 report the disposition of all sampled telephone numbers ever dialed from the original telephone number samples. The response rate estimates the fraction of all eligible sample that was ultimately interviewed. At PSRAI it is calculated by taking the product of three component rates:
Contact rate – the proportion of working numbers where a request for interview was made
Cooperation rate – the proportion of contacted numbers where a consent for interview was at least initially obtained, versus those refused
Completion rate – the proportion of initially cooperating and eligible interviews that were completed
Thus the response rate for the land line samples was 14 percent. The response rate for the cellular samples was 19 percent.