Pew Research Center

FOR RELEASE JUNE 17, 2009

Home Broadband Adoption 2009

Broadband adoption increases, but monthly prices do, too.

BY John B. Horrigan

FOR MEDIA OR OTHER INQUIRIES:

Communications Department
202.419.4372
www.pewresearch.org

RECOMMENDED CITATION

Pew Research Center, June 2009, "Home Broadband Adoption 2009"

About Pew Research Center

Pew Research Center is a nonpartisan, nonadvocacy fact tank that informs the public about the issues, attitudes and trends shaping the world. It does not take policy positions. The Center conducts public opinion polling, demographic research, computational social science research and other data-driven research. It studies politics and policy; news habits and media; the internet and technology; religion; race and ethnicity; international affairs; social, demographic and economic trends; science; research methodology and data science; and immigration and migration. Pew Research Center is a subsidiary of The Pew Charitable Trusts, its primary funder.

© Pew Research Center 2026

Table of contents

  • About Pew Research Center
  • Home Broadband Adoption 2009
  • Trends in Broadband Adoption
  • Connections, Costs and Choices
  • Broadband and the Community
  • Barriers to Broadband Adoption
  • About Us, Methodology

Home Broadband Adoption 2009

Broadband adoption increases, but monthly prices do, too.

Home broadband adoption stood at 63% of adult Americans as of April 2009, up from 55% in May, 2008.

The latest findings of the Pew Research Center’s Internet & American Life Project mark a departure from the stagnation in home high-speed adoption rates that had prevailed from December, 2007 through December, 2008. During that period, Project surveys found that home broadband penetration remained in a narrow range between 54% and 57%.

The greatest growth in broadband adoption in the past year has taken place among population subgroups which have below average usage rates. Among them:

  • Senior citizens: Broadband usage among adults ages 65 or older grew from 19% in May, 2008 to 30% in April, 2009.
  • Low-income Americans: Two groups of low-income Americans saw strong broadband growth from 2008 to 2009.
    • Respondents living in households whose annual household income is $20,000 or less, saw broadband adoption grow from 25% in 2008 to 35% in 2009.
    • Respondents living in households whose annual incomes are between $20,000 and $30,000 annually experienced a growth in broadband penetration from 42% to 53%.

Overall, respondents reporting that they live in homes with annual household incomes below $30,000 experienced a 34% growth in home broadband adoption from 2008 to 2009.

  • High-school graduates: Among adults whose highest level of educational attainment is a high school degree, broadband adoption grew from 40% in 2008 to 52% in 2009.
  • Older baby boomers: Among adults ages 50-64, broadband usage increased from 50% in 2008 to 61% in 2009.
  • Rural Americans: Adults living in rural America had home high-speed usage grow from 38% in 2008 to 46% in 2009.

Population subgroups that have above average usage rates saw more modest increases during this time period.

  • Upper income Americans: Adults who reported annual household incomes over $75,000 had broadband adoption rate change from 84% in 2008 to 85% in 2009.
  • College graduates: Adults with a college degree (or more) saw their home high-speed usage grow from 79% in 2008 to 83% in 2009.

Notably, African Americans experienced their second consecutive year of broadband adoption growth that was below average.

  • In 2009, 46% of African Americans had broadband at home.
  • This compares with 43% in 2008.
  • In 2007, 40% of African Americans had broadband at home.

The Pew Internet Project’s April 2009 survey interviewed 2,253 Americans, with 561 interviewed on their cell phones.


Broadband adoption appears to have been largely immune to the effects of the current economic recession. In the April survey, more than twice as many respondents said they had cut back or cancelled a cell phone plan or cable TV service than said the same about their internet service.

  • 9% of internet users (7% of all adults) say that in the past 12 months they have cancelled or cut back online service.
  • 22% of adults say they have cancelled or cut back cable TV service in the past 12 months.
  • 22% of cell phone users (19% of all adults) report that in the past 12 months they have cancelled or cut back cell phone service.

Given that the Project’s April 2009 survey shows that 85% of adults have cell phone service, up from 77% at the end of 2007 (in a sample that also included respondents interviewed on cell phones), it seems likely that cell phone users were economizing on service plans rather than foregoing service altogether.

Prices for home broadband service increased from 2008 to 2009. Home high-speed users who reported more choices of providers paid less than others.

  • The average monthly bill for broadband service in April 2009 was $39, an increase from $34.50 in May 2008.
  • Broadband users who say they have just one provider where they live (21% of home high-speed users) report an average monthly bill of $44.70.
  • Among broadband users with more than one provider in their area (69% of home high-speed users), the average monthly broadband bill is $38.30.
  • A subset of home broadband users who say four or more broadband service providers serve their neighborhood (17% of all home high-speed users) reported an average monthly bill of $32.10.

A growing share of broadband subscribers is paying for premium service that gives them faster speeds. They are also paying more for the extra speed than they did a year ago.

  • In 2009, 34% of home broadband users said they subscribed to a service that gave them faster access speeds, an increase from 29% in 2008.
  • About the same share of home broadband users subscribed to basic service in 2009 (53%) and in 2008 (54%).
  • Subscribers to premium service paid an average of $44.60 per month for broadband in 2009, up from $38.10 in 2008.
  • For basic service, broadband users reported a monthly bill of $37.10 in 2009, up from $32.80 in 2008.

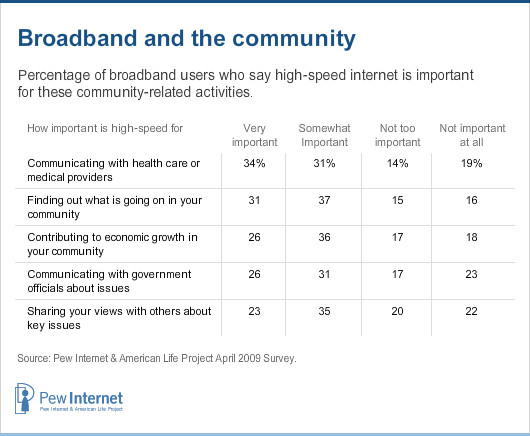
A majority of home broadband users see a home high-speed connection as “very important” to at least one dimension of their lives and community, such as communicating with health care providers and government officials, or gathering and sharing information about the community.

  • 68% of home broadband users said such a connection is “very important” (31%) or “somewhat important (37%) for finding out what is going on in their community.
  • 65% of home broadband users said such a connection is “very important” (34%) or “somewhat important (31%) for communicating with health care or medical providers.
  • 62% of home broadband users said such a connection is “very important” (26%) or “somewhat important (36%) for contributing to economic growth in their community.
  • 58% of home broadband users said such a connection is “very important” (23%) or “somewhat important (35%) for sharing their views with others about key issues.
  • 57% of home broadband users said such a connection is “very important” (26%) or “somewhat important (31%) for finding out what is going on in their community.

Overall, 55% of broadband users view a high-speed link at home as “very important” with respect to at least one of these topics they were asked about. Some 84% of home broadband users see their fast connection as “somewhat important” or “very important” in at least one of the five realms listed above.

When asked why they do not have the internet or broadband at home, non-users (either dialup subscribers or non-internet users) cite factors related to the internet’s relevance, availability, usability, and price. A third of dial-up users cite price as a barrier, with the remaining two-thirds citing other factors.

Only 7% of Americans are dial-up internet users at home, a figure that is half the level it had been  two years ago. Here’s what they say when asked what it would take for them to switch to a broadband connection at home.

  • 32% said the price would have to fall.
  • 20% said nothing would get them to change.
  • 17% said it would have to become available where they live.
  • 16% responded “don’t know.”
  • 13% cited some other reason.

Non-internet users, 21% of adults, are three times the size of dial-up users and cite a wider range of reasons as to why they don’t have internet access:

  • 22% say they are not interested in getting online (a decrease from 33% who said this at the end of 2007).
  • 16% say they can’t get access where they live.
  • 13% cited some other reason.
  • 10% said it was too expensive.
  • 7% said they believe the internet is difficult to use.
  • 6% say they don’t need or want it.
  • 6% responded “don’t know” or refused to respond.
  • 5% said they don’t have a computer.
  • 4% said they were busy or have no time for the internet.
  • 4% said they think the internet is a waste of time.

Consolidating the reasons mentioned across the two classes of non-broadband users into four categories yields the following table. It shows that half of non-internet or dial-up users cite a reason that suggests they question the relevance of connecting to the internet – either at all or with high-speed at home.

Reasons for not having broadband at home

Trends in Broadband Adoption

Some 63% of adult Americans have broadband internet connections at home, according to the April 2009 survey conducted by the Pew Research Center’s Internet & American Life Project. This figure compares with 55% recorded a year earlier and the eight percentage point increase translates into a 15% growth rate from May 2008 to May 2009. The growth rate is comparable to those recorded in the past three years.

Year-to-year percentage growth

Although growth in the past year differs little from the March 2007-April 2008 timeframe, the latest broadband figure marks a departure from sluggish growth in broadband adoption for the latter part of 2007 and much of 2008. Pew Internet Project surveys over the twelve month period starting in December 2007 showed broadband adoption as follows:

  • 54% of adults with broadband at home in December 2007.
  • 55% of adults with broadband at home in April 2008.
  • 57% of adults with broadband at home in August 2008.
  • 57% of adults with broadband at home in December 2008.1

The April 2009 survey interviewed 2,253 adult Americans, including 561 who were interviewed on their cell. The margin of error in the survey is plus or minus two percentage points for results based on the entire sample. The survey contained 1,332 respondents with high-speed internet connections at home and the margin of error for results based on home broadband users is plus or minus 3 percentage points. The data points above for December 2007 and December 2008 both come from surveys with cell phone numbers included in the sample.

With five out of eight of Americans now connecting to the internet at home with a high-speed internet connection, dial-up access is the at-home onramp to the internet for only 7% of adults, half the level of two years ago.

The 63% home high-speed adoption figure occurs in the context of 79% of American adults identifying themselves as internet users in the April 2009 survey, with 72% of adults saying they go online from home. This means that, among adults who go online from home, 87% connect using some sort of broadband internet connection.

Here are trends in broadband adoption, as a share of all adult Americans, from 2000 to 2009.

 Trends in home access

The broadband adoption figure of 55% from our 2008 report came from a sample of respondents that did not include individuals interviewed on cell phone, unlike the 2009 sample. The difference in sampling may have an impact on a 2008-2009 comparison, since those reached on cell phones may have systematically different broadband adoption habits than those reached on landline phones. Analysis of the effect of including cell respondents in the April 2009 survey indicates that this may increase the figure for home broadband adoption by 2 percentage points. In other words, absent cell phone respondents in the sample, 61% of Americans would be found to have broadband at home.

The Pew Internet Project is now conducting all its surveys with cell phone numbers included in the sample. The latest data from the Center for Disease Control’s National Health Interview Survey show that 20% of American homes are cell-only.2 Including cell phone numbers in samples increases the number of younger respondents, minority respondents and low-income respondents that are collected in a survey and therefore makes the raw sample more representative of the general population.

Trends within demographic groups

The following two tables decompose trends in broadband adoption across demographic and socio-economic characteristics of respondents.

Trends in home broadband adoption by demographic group

Trends in home broadband adoptions by demographic group

Year-to-year changes

Year-to-year changes

In looking across these tables, several groups stand out as having gained a great deal from 2008 to 2009, while several show gains that are below average.

On the upswing, starting with the largest gainers, are:

  • Senior citizens: Americans age 65 and older had broadband adoption grow by 58% from 2008 to 2009, from 19% to 30%.
  • Low-income Americans: Those who report household incomes of $20,000 per year or less (16% of the sample) saw broadband adoption growth from 25% in 2008 to 35% in 2009. This 40% growth represents a reversal of fortune from the 2007 to 2008 timeframe, when this group saw a slight (and not statistically significant) drop in broadband penetration from 28% to 25%.
    • Another group of low-income Americans, the 10% of respondents living in households with incomes between $20,000 and $30,000 annually, saw broadband adoption grow from 42% to 53%, or a growth of 26%.

Overall, the one-quarter of Americans living in homes with annual household incomes below $30,000 experienced a 36% growth in home broadband adoption from 2008 to 2009.

  • High school graduates: Americans whose highest level of educational attainment is a high school degree (which amounts to 35% of the sample) experienced an increase of broadband adoption of 30% from 2008 to 2009, from 40% to 52%.
  • Older baby boomers: Americans in the 50 to 64 age group saw an increase in home broadband adoption from 50% to 61% last year, a 22% increase from 2008 to 2009.
  • Rural Americans: Adults living in rural areas had a 21% increase in broadband adoption last year, as 46% of rural Americans now have broadband at compared with 38% in 2008.

Groups whose growth rate trailed the average include (starting with slowest growing):

  • Upper and upper middle-income Americans: Respondents who report annual household incomes over $75,000 saw a small uptick in home broadband adoption from 84% to 85% last year – groups whose adoption levels are approaching a saturation level. These groups are some 24% of the sample.
  • Ages 30-49: This large swath of Americans (36% of the population) saw broadband adoption rise 4% from 69% in 2008 to 72% in 2009.
  • College educated Americans: Respondents with college degrees or higher (29% of the sample) witnessed a modest increase in broadband adoption from 79% to 83% last year, a 5% growth rate.
  • African Americans: Among non-Hispanic African Americans (11% of the sample), broadband adoption increased from 43% in 2008 to 46% in 2009. This change is not significant statistically and represents the second consecutive year that African Americans have had below-average growth in home broadband adoption.

The preceding tables characterize the place where users live as rural or non-rural, a departure from past practice of identifying where people live by rural, urban, or suburban locations. It is straightforward to identify the locations of respondents using landline phones according to the Census Bureau’s definitions of rural, urban, or suburban. This is more difficult for respondents contacted on cell phones, since blocks of cell phone numbers do not neatly map to Census definitions of urban, suburban, and rural. However, samples of cell phone numbers do include the Metropolitan Statistical Area (MSA) in which the cell phone was activated, which is a close proxy for where the user lives.

Respondents who do not live in MSAs live (to a very close approximation) in rural areas and in this report such respondents are categorized as rural residents. It is challenging, though not impossible, to differentiate urban from suburban residents using MSA codes. That effort is not undertaken here and the cost of doing this is small; the difference between urban and suburban broadband penetration in the past has never been more than 3 percentage points, usually favoring suburbia.

Connections, Costs and Choices

Personal finances and choices about personal information technology

The rise in home broadband adoption, in the face of a severe economic recession, may seem surprising, as taking on the additional cost of a home high-speed connection might be difficult if discretionary income is tight. On the other hand, the migration to the internet of many resources for finding and applying for jobs may prompt some to cut something else and keep (or add) broadband.

In probing this issue in the April 2009 survey, it appears that few people were willing to cutback on broadband and were more likely to economize on communication services other than the internet. As the table shows, just 9% of internet users said they cancelled or cut back on internet services in light of their personal finances.

The higher incidence of this among low-income users, in face of the increase in home broadband adoption in this group, suggests that respondents were taking steps to minimize their monthly bills as opposed to terminating service. This is probably also the case for cell service, since this survey showed 85% of all adults as having a cell phone, up from 77% in late 2007. For low-income people especially, the landline phone was cut, as well as level of cable TV service, rather than broadband.

Personal finances and choices about information technology

How broadband users connect at home

A half dozen years ago home broadband access generally came in two flavors – cable or DSL services provide by telephone companies. Since then the range of options has expanded. Even though most home broadband users still have DSL or cable modem service, wireless access has made a significant dent among home broadband users, and fiber-to-the-home also registers as a high-speed access path for users.

Types of broadband connections people use at home

One reason the “fixed wireless or satellite” category may show sizable growth from 2008 to 2009 is a modification of the question used to measure home broadband access. The wording of the question is as follows:

“At home, do you connect to the internet through a dial-up telephone line, or do you have some other type of connection, such as a DSL-enabled phone line, a cable TV modem, a wireless connection, a fiber optic connection or a T-1?”

This year, the interviewer conducting the survey was permitted to prompt the respondent, for the wireless choice, about whether he had an AirCard service. This might have elicited some additional “wireless” responses than in the past.

Looking at connection by geography shows clear differences depending upon whether one lives in a rural, urban, or suburban area.

Broadband connection and community type

Another element in the mix of access decisions for users is speed. Some providers of broadband service offer different tiers of service differentiated by speed and price. In 2009, respondents were asked whether they “pay extra for a premium service that promises faster speeds” and 34% of home broadband users said they did. This represents an increase from 29% who said this in 2008. Here’s how respondents characterized their connection choices in 2008 and 2009.

Tiers of broadband service

The number of providers available to subscribers

Home broadband subscribers, for the first time since 2005 in a Pew Internet survey, were asked whether there is more than one provider of high-speed access serve their area. In 2009, more than two-thirds (69%) of home broadband users said they have more than one provider in their area, 21% responded “no”, indicating that there is a single provider, and 10% said they didn’t know. In 2005, by contrast, 61% of home broadband users said they had more than one provider serving their area, 25% said there was only one, and 13% responded that they did not know.

Among rural broadband users, 30% say in 2009 that they have one broadband subscriber where they live.

Broadband users with more than one high-speed provider where they live were further probed about how many companies served the area in which they live.

Among home broadband users with more than one option for broadband in their neighborhood:

  • 29% said they had two choices.
  • 39% said they had three choices.
  • 24% said they had four or more choices.

Non-rural dwellers are most likely to say they have four or more choices; 32% say this. This is indicative of how denser population areas are more attractive investment opportunities for providers of broadband, as there is a greater chance for providers to recoup high fixed cost in these areas.

What people pay for online access

To explore what people pay for month for broadband, all home internet users in the April 2009 survey received this question: “To the nearest dollar, about how much do you pay each month for internet access at home?  If your internet access is combined with television or other services, I would like to know just the amount you pay for internet service.”3

Overall, internet users reported an average monthly bill of $37.60 in the April 2009 survey, with broadband subscribers saying they pay an average of $39.00 per month and dial-up users report a monthly bill of $26.60. The 2009 figure for dial-up compares to the $19.70 dial-up users reported paying in 2008.

Prices for broadband are up

Comparing users’ reported monthly broadband bill in 2009 to past years shows an increase in what people pay for high-speed internet access on a monthly basis. The figure below shows that broadband users pay, on average $4.50 per month more in 2009 than in 2008, a difference that is statistically significant.

Reported monthly broadband bills over time

The increase in what people pay for broadband is evident in prices for basic and premium services. For subscribers to basic services, the average monthly bill was $32.80 in 2008, a figure which rose to $37.10 in 2009. For premium subscribers, those thirsty for faster home broadband speeds paid about $38.10 per month in 2008 and roughly $44.60 in 2009.

Across different service types, broadband subscribers reported higher prices for cable modem service than DSL by a $43.20 to $33.70 margin. This compares with 2008 figures of $37.50 for cable modem subscribers and $31.50 for DSL users.4

To put the average monthly broadband bill of $39 per month into context, an assessment of prices across countries for broadband, conducted by the Organization Economic Cooperation and Development (OECD) finds an average monthly broadband bill in the United States of $45.52.5 The OECD notes that in compiling its price average, it was not always possible to decompose the broadband price from “triple play” offerings of voice, internet, and video services; this may be a reason the OECD figure exceeds the one reported by users in this survey.

Choice and price

With data on what people pay per month for broadband and the number of providers they say they have in their neighborhood, it is possible to examine relationships between choice and price. As might be expected, broadband users who say they have more than one broadband provider report that they pay less per month for broadband than those who say only one provider is available. Specifically:

  • Among broadband subscribers who report that one company serves their area, the average monthly bill is $44.70.
  • Among broadband subscribes who report that more than one company serves their area, the average monthly bill is $38.30.

At a more disaggregated level, a greater number of choices among providers correlates to lower broadband bills. Specifically:

  • Among broadband subscribers who report two providers in their area, the average monthly bill is reported to be $42.80.
  • Among broadband subscribers who report three providers in their area, the average monthly bill is reported to be $38.10.
  • Among broadband subscribers who report four or more providers in their area, the average monthly bill is reported to be $32.10.

It is possible that the differences in price reported for those with one broadband provider versus those with more than one are a result not of fundamental price differences, but user choices. For instance, the differences could arise from some users paying more for premium services or additional high-speed options such as mobile broadband services (e.g., AirCards). Although paying for premium services and mobile broadband does account for some differences in reported monthly bills, there is nonetheless a significant relationship between having more than one broadband provider available and having a lower monthly bill for broadband. In other words, the reported price differences between those with one provider versus those with more than one are significant, even when controlling for other factors that might effect people’s broadband bill, such as having premium service, paying for a wireless broadband service for “on the go” access, where they live, and other variables such as income and education. In this sample, living in a rural area had no significant link to average monthly broadband cost.%%FOOTNOTE%%

Prices are up when examining the mean and the median

Even with respondents prompted to disentangle price for internet service from other bundled offerings, it is sensible to ask how well they performed in doing that. Some users, notwithstanding suggestions to the contrary, may report the entirety of their monthly cable TV, telephone, and internet bills. Such high reports of prices would increase the calculated average of monthly internet service. In examining the data, this issue does not appear to be too severe. Only 2% of broadband users reported monthly bills that might be considered problematic – $100 or more. Some 3% of dial-up users reported monthly internet bills over $100.

Nonetheless, one way to explore the robustness of the increase in internet prices from 2008 to 2009 is to examine the median price levels. By focusing on the “middle” price reported in the dialup and broadband categories, the influence of potentially inaccurately high reported monthly bills is muted. Focusing on the median does not change fundamental relationships in price over the 2008 to 2009 timeframe, with the exception of DSL, where the median price was $30 in both years.

It is worth noting that the increase in the median for broadband prices overall is driven to some extent by the growth in the median among other types of home high-speed connections. That reported median grew from $35 to $40 from 2008 to 2009, and those kinds of connections accounted for about one-quarter of home broadband connections in 2009.

Prices are up when examining mean and median

The 2008 survey on broadband use did not ask broadband users about the number of service providers they have available. However, the following table shows mean and median reported prices by number of available broadband providers.

Number of broadband providers

The growth in wireless home networks

Another characteristic of the home internet experience is whether it is networked or not. Since 2004, the Pew Internet Project has periodically asked whether computers in the household are linked together through a network, either through cables or a wireless network. As the following table shows, home networking has been steadily on the rise, with the growth of home wireless networking accounting for this growth.

Growth in home wireless networks

Both dial-up and broadband users were asked this question, and some 15% of dial-up users said they had wireless networks – something that is usually associated with having high-speed service. However, about half of these dial-up users reported having a service for wireless broadband, such as an Aircard or some such plan through their cell phone carrier.

For home broadband users, wireless networking is popular, with 37% saying they have a wireless network in their home. Wireless home networks are somewhat more prevalent among parents with minor children at home (42%) or married couples without kids at home (40%).

Broadband and the Community

As a public issue, broadband has taken on a higher profile in recent months because of President Obama’s decision to include funding for broadband in the American Recovery and Reinvestment Act (ARRA). As enacted, ARRA included $7.2 billion for broadband with the goal of accelerating the deployment of broadband in the United States.

Because of the increased prominence of broadband in public debate, this survey queried broadband users about the importance of broadband in their community and daily lives. The questions had to do gathering information about the community, as well as communicating to others, either about happenings around town, to government officials, or with health care providers. Users were also asked whether they see broadband as infrastructure important to economic growth.

Broadband and the community

Most broadband users believe broadband is at least “somewhat important” for each of the five topics explored, with about two-thirds saying this about finding out about what is going on in the community and communicating with health care providers.

Overall, 55% of broadband users cite at least one of the five items as “very important,” meaning more than half of broadband users view a high-speed connection as being very important to the civic or economic fabric of their communities.

The 55% of broadband users who see high-speed infrastructure as very important differ in some ways demographically than their remaining counterparts who do not have strong views about broadband’s importance. The majority group of home high-speed users who say broadband is very important for at least one topic listed are younger than other broadband users (the median age is 39 for the “very important” majority versus 43 for the rest) and more ethnically diverse. Some 25% of those who see broadband as “’very important” in at least one way are English-speaking Hispanics (15%) or African Americans (10%) compared with 15% of other home high-speed users (10% Hispanic and 5% African American for that group).

Barriers to Broadband Adoption

Demographic differences in broadband adoption

As we did in our 2008 report on home broadband adoption, this report assesses barriers to broadband adoption through questions to dial-up users and non-internet users about why they either do not have broadband or lack internet access.

At a very broad level, there are clear demographic differences between broadband, dial-up, and non-internet users, as the following table demonstrates.

Demographic profiles

Demographic profiles

Relative to broadband users, dial-up users are older, have lower incomes, have lower levels of educational attainment, are more likely to be African American, and more likely to live in rural areas. For non-internet users, these same factors are also relevant, but in much more pronounced ways. A notable demographic difference in comparing dial-up with non-users is gender: dial-up users are more likely to be male and non-users more likely to be female.

Several of the factors common to non-broadband use are related. Those with lower levels of education have, on average, lower incomes, as do rural Americans, senior citizens, and African Americans. Two questions that arise are whether these different effects are independent of one another and, if they are, which ones are more strongly related to broadband adoption.

It turns out that a number of demographic or socio-economic factors are positively correlated with home broadband adoption, while others are negatively correlated, and that these relationships are independent of one another. The following shows those factors that are positively and negatively correlated with home broadband adoption.9They are listed in order of magnitude, that is, having a high income is a stronger predictor of having broadband than being a parent and not having graduated from high school is more strongly associated with not having broadband than living in rural America.

Barriers to broadband adoption

These relationships help reveal patterns in broadband adoption, but they are not ironclad determinants of whether a person has broadband or not. They do, however, indicate what elements are more (or less) important, at the level of demographic and socio-economic analysis, in thinking about broadband adoption. The report turns now to how attitudes about the internet also shape the broadband subscription decision.

How many dial-up users want broadband?

When asked whether they would like to switch to a faster home broadband connection at home, more dial-up users say they are not interested than those who say they do.

Interest in switching to broadband

Since this question was first asked in 2002, about 40% of dial-up users have said they would like to switch and the number has not changed much as dial-up use has fallen to a fraction of its 2002 levels. With the pool of dial-up users diminishing, this steady figure over time means that some dial-up users are changing their preferences. That is, assuming that over time most dial-up users who switched to broadband were people who at one point said they were interested in switching, many remaining dial-up users who said they didn’t want to switch a few years ago now say they do.

Due to the small number of cases for dial-up users, reporting specifics about what subgroups of dial-up users say when asked whether they would like to switch to broadband is not appropriate. However, multivariate analysis shows that two groups are most likely to say that they would like to switch from dial-up to broadband: parents with minor children and rural dial-up users.10

What would it take to get dial-up users to switch?

When explicitly asked what would move them from the dial-up to broadband column, dial-up users haven’t changed much in their perspectives on this question since 2008. Although a plurality cite price as the reason, some two-thirds of dial-up users cite a range of other things that would have to change to get them to switch. Some reasons cited are fairly precise, such as availability of service, while others are vague, such as simply not wanting to switch or not being able to identify something specific.

What would it take to get you to switch to broadband

What keeps non-internet users offline?

Some one-fifth of adults (21%) do not use the internet, and the April 2009 survey asked these people a series of questions about why they don’t use the internet, whether they might have people close to them who use it, and whether they have been an online user in the past.

What is the main reason

The only statistically significant difference in 2009 in comparison with 2007 is in the share of non-internet users saying they are not interested in getting online, with non-users in 2009 a third less likely than in 2007 to say they are not interested in getting online.

For both non-internet and dial-up users, there are small increases in those saying they can’t get service where they live. For dial-up users, 17% say they cannot obtain service where they live, an increase from 14% in 2008 that is not statistically significant. For non-users, 16% cited “can’t get access” in 2009, an uptick from 12% in 2007 that is significant at the 90% confidence level. Overall, this translates into 17% of non-internet or dial-up users who cite lack of availability as a reason they do without either internet service or broadband.

As was done in January’s Pew Internet commentary, the following consolidates the findings for dial-up and non-internet users into a single table.11

Reasons for not having broadband at home

The April 2009 data show that half of dial-up and non-users cite some reason relating to the relevance of the internet, about the same share that was reported earlier this year based on 2007 data.

The demographic profiles of members of each of these four groups are shown below. Those citing availability and price as barriers are somewhat younger and poorer than those citing other reasons, and more likely to be female as well.

Demographic profiles

Demographic profiles

Some “not online” Americans weren’t always that way and some live with online users

As the Pew Internet Project first documented in a 2003 report, the internet population is often in some state of flux, with some people losing access and counting themselves as non-users, as others come online to expand the overall online population.12 In our April 2009 survey, some 21% of non-internet users said they had once been users of the internet or email, but had stopped using the internet for some reason.

As to whether they would like to get back online, only 11% of non-internet users would like to start using the internet – either for first time or once again after they have lost access.

Some non-users, however, have internet users in their household. Among the 21% of non-internet users, 13% say that someone in their home uses the internet. About half (46%) of this group identify a spouse or partner as the online user in the home, while just over one-third (38%) point to a child.

As noted earlier in the report, 72% of adults have internet access at home, with another 7% having online access from elsewhere, mostly work only (4%) or some other place that is neither home nor work (3%). When non-users with an internet user in the household added to the mix, 75% of Americans live in a home with internet access.

About Us, Methodology

About the Pew Research Center’s Internet & American Life Project

The Pew Internet Project is an initiative of the Pew Research Center, a nonprofit “fact tank” that provides information on the issues, attitudes and trends shaping America and the world. The Pew Internet Project explores the impact of the internet on children, families, communities, the work place, schools, health care and civic/political life.  The Project is nonpartisan and takes no position on policy issues. Support for the Project is provided by The Pew Charitable Trusts. More information is available at www.pewresearch.org/pewresearch-org/internet

Methodology

This report is based on the findings of a daily tracking survey on Americans’ use of the Internet. The results in this report are based on data from telephone interviews conducted by Princeton Survey Research International between March 26 to April 19, 2009, among a sample of 2,253 adults, 18 and older.  For results based on the total sample, one can say with 95% confidence that the error attributable to sampling and other random effects is plus or minus 2.4 percentage points.  For results based Internet users (n=1,687), the margin of sampling error is plus or minus 2.7 percentage points.  In addition to sampling error, question wording and practical difficulties in conducting telephone surveys may introduce some error or bias into the findings of opinion polls.

A combination of landline and cellular random digit dial (RDD) samples was used to represent all adults in the continental United States who have access to either a landline or cellular telephone. Both samples were provided by Survey Sampling International, LLC (SSI) according to PSRAI specifications.  Numbers for the landline sample were selected with probabilities in proportion to their share of listed telephone households from active blocks (area code + exchange + two-digit block number) that contained three or more residential directory listings. The cellular sample was not list-assisted, but was drawn through a systematic sampling from dedicated wireless 100-blocks and shared service 100-blocks with no directory-listed landline numbers.

New sample was released daily and was kept in the field for at least five days. The sample was released in replicates, which are representative subsamples of the larger population. This ensures that complete call procedures were followed for the entire sample.  At least 5 attempts were made to complete an interview at sampled telephone number. The calls were staggered over times of day and days of the week to maximize the chances of making contact with a potential respondent. Each number received at least one daytime call in an attempt to find someone available.  For the landline sample, interviewers asked to speak with the youngest male currently at home. If no male was available, interviewers asked to speak with the youngest female at home. This systematic respondent selection technique has been shown to produce samples that closely mirror the population in terms of age and gender.  For the cellular sample, interviews were conducted with the person who answered the phone. Interviewers verified that the person was an adult and in a safe place before administering the survey. Cellular sample respondents were offered a post-paid cash incentive for their participation. All interviews completed on any given day were considered to be the final sample for that day.

Non-response in telephone interviews produces some known biases in survey-derived estimates because participation tends to vary for different subgroups of the population, and these subgroups are likely to vary also on questions of substantive interest. In order to compensate for these known biases, the sample data are weighted in analysis. The demographic weighting parameters are derived from a special analysis of the most recently available Census Bureau’s March 2008 Annual Social and Economic Supplement. This analysis produces population parameters for the demographic characteristics of adults age 18 or older. These parameters are then compared with the sample characteristics to construct sample weights. The weights are derived using an iterative technique that simultaneously balances the distribution of all weighting parameters.

Following is the full disposition of all sampled telephone numbers:

methodology

The disposition reports all of the sampled telephone numbers ever dialed from the original telephone number samples. The response rate estimates the fraction of all eligible respondents in the sample that were ultimately interviewed. At PSRAI it is calculated by taking the product of three component rates:

  • Contact rate – the proportion of working numbers where a request for interview was made
  • Cooperation rate – the proportion of contacted numbers where a consent for interview was at least initially obtained, versus those refused
  • Completion rate – the proportion of initially cooperating and eligible interviews that were completed
  • Thus the response rate for the landline sample was 20.6 percent. The response rate for the cellular sample was 18.2 percent.