
Pew Research Center

FOR RELEASE JULY 2, 2008

Home Broadband 2008

Some 55% of all adult Americans now have a high-speed internet connection at home. The percentage of Americans with broadband at home has grown from 47% in early 2007.

BY John B. Horrigan

FOR MEDIA OR OTHER INQUIRIES:

Communications Department
202.419.4372
www.pewresearch.org

RECOMMENDED CITATION

Pew Research Center, July 2008, "Home Broadband 2008"

About Pew Research Center

Pew Research Center is a nonpartisan, nonadvocacy fact tank that informs the public about the issues, attitudes and trends shaping the world. It does not take policy positions. The Center conducts public opinion polling, demographic research, computational social science research and other data-driven research. It studies politics and policy; news habits and media; the internet and technology; religion; race and ethnicity; international affairs; social, demographic and economic trends; science; research methodology and data science; and immigration and migration. Pew Research Center is a subsidiary of The Pew Charitable Trusts, its primary funder.

© Pew Research Center 2026

Table of contents

  • About Pew Research Center
  • Home Broadband 2008
  • Acknowledgements
  • Broadband Adoption in the United States
  • Analysis of Non-Broadband Users
  • The Online Behavior of Broadband Users
  • Methodology

Home Broadband 2008

Some 55% of all adult Americans now have a high-speed internet connection at home. The percentage of Americans with broadband at home has grown from 47% in early 2007.

Home broadband adoption increased from 47% from March 2007 to 55% in April 2008.

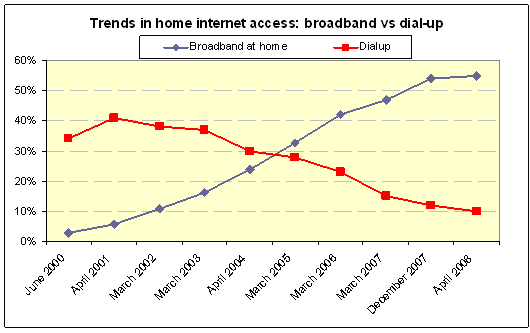
Some 55% of adult Americans now have broadband internet connections at home, up from 47% who had high-speed access at home last year at this time. From the March 2006 to March 2007 timeframe, home broadband adoption grew from 42% of Americans to 47%.
Trends in home internet access: Broadband vs Dial-up

The rate from March 2007 to April 2008 was 17%; this compares to the 12% growth rate from March 2006 to March 2007. It is also worth noting that the April 2008 number for broadband adoption at home is little changed from the 54% figure from the Pew Internet Project’s December 2007 survey. With growth in broadband at home, now just 10% of Americans have dial-up internet connections at home.

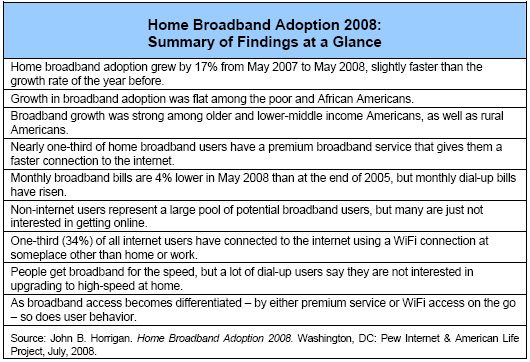
Growth in broadband adoption was flat among the poor and African Americans.

  • 25% of low-income Americans – those whose household incomes are $20,000 annually or less – reported having broadband at home in April 2008. This compares to the 28% figure reported in March 2007 among those living in households whose annual incomes are $20,000 or less.
  • African Americans showed slow growth as well, with 43% saying they had broadband at home in April 2008 versus 40% who said this in March 2007.

Broadband growth was strong among older and lower-middle income Americans, as well as rural Americans.

  • Among older Americans – those age 50 and over – the growth rate in home broadband adoption from 2007 to 2008 was 26%. Half of Americans between the ages of 50 and 64 have broadband at home. Some 19% of those 65 and older had home broadband access as of April 2008.
  • Americans with household incomes between $20,000 and $40,000 annually saw broadband penetration grow by 24% from 2007 to 2008. Some 45% of those in that income range reported having broadband at home in April 2008.
  • 38% of those living in rural American now have broadband at home, compared with 31% who said this in 2007, or a growth rate of 23% from 2007 to 2008. By comparison, 57% of urban residents have high-speed connections at home now and 60% of suburban residents have such connections.

Nearly one-third of home broadband users have a premium broadband service that gives them a faster connection to the internet.

When asked whether they subscribe to a premium service that gives them a faster broadband connection or have basic service, here is what home broadband users say:

  • 54% of home high-speed users have basic broadband service.
  • 29% of say they have a premium service that offers faster speed.
  • 16% responded that they do not know.

Monthly broadband bills are 4% lower in May 2008 than at the end of 2005, but monthly dial-up bills have risen.

  • Broadband users reported an average monthly bill of $34.50 in April 2008, down from $36 in December 2005.
  • The 4% decline is half the decline reported over the February 2004 to December 2005 time interval.
  • Dial-up users reported monthly bills of $19.70, up 9% from the $18 figure from December 2005.
  • The reported average cost of digital subscriber line (DSL) service ($31.50) continues to be less than cable modem service ($37.50). However, the $6 difference in April 2008 is smaller than the $9 difference in December 2005.

Non-broadband users cite a number of reasons for not using the service – including availability, price, and lack of interest.

  • 62% of dial-up users say they are not interested in giving up their current connection for broadband.

When asked specifically what it would take them to get them to switch to broadband:

  • 35% of dial-up users say that the price of broadband service would have to fall.
  • 19% of dial-up users said nothing would convince them to get broadband.
  • 10% of dial-up users – and 15% of dial-up users in rural America – say that broadband service would have to become available where they.

Attitudes about the relevance of information technology also shape the broadband decision for dial-up users, separate and apart from issues such as the price of service. Dial-up users are about half as likely as broadband users to say that information technology helps their personal productivity.

  • When asked if they think electronic devices make them more productive, 35% of broadband users strongly agreed that it did compared with 19% of dial-up users.

Non-internet users represent a large pool of potential broadband users, but many are just not interested in getting online.

Roughly one-quarter (27%) of adult Americans are not internet users, and they tend to be older (the median age is 61) and have lower-incomes than online users (non-internet users are more than twice as likely as users to live in low-income households). Some 18% of non-internet users have used the internet in the past, but just 10% of non-internet users say they would be interested in joining the ranks of online users.

When asked why they don’t use the internet:

  • 33% of non-users say they are not interested.
  • 12% say they don’t have access.
  • 9% say it is too difficult or frustrating.
  • 7% say it is too expensive.
  • 7% say it is a waste of time.

One-third (34%) of all internet users have connected to the internet using a WiFi connection at someplace other than home or work.

Some 34% of internet users have gone online via a wireless connection away from their home or office. This group of “on the go” WiFi users overwhelmingly have broadband at home; some 95% of those who have gone online this way have a high-speed internet connection at home.

Among internet users who have gone online “on the go” from some place other than home or work:

  • 58% say they use WiFi at public places such as airports, coffee shops, or restaurants.
  • 64% say they generally use free WiFi connections when they connect on the go,
  • 32% say their on the go Wifi access is a mix of paid and free access.
  • 4% mostly use paid services.

As broadband access becomes differentiated – by either premium service or WiFi access on the go – so does user behavior.

The 34% of online users who have taken advantage of “on the go” access and the 29% broadband subscribers who subscribe to faster premium services are more active online than typical broadband users. When looking across a range of 14 different online activities:

  • Premium broadband users do an average 19% more online tasks on the typical day than the average broadband user.
  • “On the go” internet users do an average of 26% more online tasks on a typical day than the average broadband user.

It is not too surprising that additional on-ramps to the internet are associated with heavier use. Nonetheless, particularly with respect to “on the go,” the results show that a WiFi-enabled laptop has added “always connected” wireless access to the “always on” broadband connection.
Summary of findings at a glance

Acknowledgements

About the Pew Internet & American Life Project: The Pew Internet Project is an initiative of the Pew Research Center, a nonprofit “fact tank” that provides information on the issues, attitudes and trends shaping America and the world. Pew Internet explores the impact of the internet on children, families, communities, the work place, schools, health care and civic/political life.  The Project is nonpartisan and takes no position on policy issues. Support for the project is provided by The Pew Charitable Trusts. The Project’s Web site: https://alpha.pewresearch.org/pewresearch-org/internet

About Princeton Survey Research Associates: PSRA conducted the surveys that are covered in this report. It is an independent research company specializing in social and policy work. The firm designs, conducts, and analyzes surveys worldwide. Its expertise also includes qualitative research and content analysis. With offices in Princeton, New Jersey, and Washington, D.C., PSRA serves the needs of clients around the nation and the world. The firm can be reached at 911 Commons Way, Princeton, NJ 08540, by telephone at 609-924-9204, by fax at 609-924-7499, or by email at ResearchNJ@PSRA.com

Broadband Adoption in the United States

Introduction

 Broadband adoption in the United States continues to exhibit steady growth, with 17% more American adults having broadband at home in April 2008 than was the case roughly a year earlier. Fully 55% of Americans reported having a high-speed internet connection at home in our April survey, up from 47% in March 2007. The share of Americans with broadband at home in our April 2008 survey is little changed from the 54% of Americans who said they had broadband at home in our December 2007 survey.

The chart below shows growth rates in broadband adoption in recent years.

Year-to-year growth in home broadband penetration

This highpoint in our surveys for home broadband adoption also marks a low in the use of dial-up as a way to access the internet. Just 10% of American adults say they use dial-up internet connections at home to go online.

Trends in home internet acces: Broadband vs Dial-up

Although growth in broadband adoption from 2007 to 2008 was comparable to the 2006-2007 timeframe, the sources of recent growth differ from prior years. Over the past year, growth in broadband adoption at home was strong among lower-middle income Americans, and those over the age of 50. However, several groups that had shown strong rates of broadband uptake in past years slowed in the 2007-2008 timeframe. Specifically:

  • Low-income Americans – defined as those who say their annual household incomes are $20,000 or below. This group showed a change in adoption from 28% in 2007 to 25% in 2008. This recorded decline in broadband adoption is within the margin of error for the surveys, suggesting that adoption was basically flat in this group. Some 14% of the sample reported having an annual household income at $20,000 or less.
  • African Americans: The share of African-Americans with broadband at home increased from 40% to 43% from 2007 to 2008. This change is also within the margin of error for the surveys, suggesting little or no growth in broadband adoption for African Americans from 2007 to 2008.
  • Urban dwellers: Although 57% of those in urban areas have broadband at home, this represented a growth of 10% from the 2007 level.
  • Upper–income Americans: Among those living in households with annual incomes in excess of $100,000, broadband adoption grew from 82% to 85% from 2007 to 2008. This is a modest 4% growth rate at penetration levels nearing saturation.

Trends: Home broadband adoption by group

These slow or flat growth rates were compensated by faster growth in broadband adoption in two sizable (and not mutually exclusive) groups of Americans:

  • Older Americans: Respondents age 50 and over, which make up 43% of the entire sample, reported a 26% growth in broadband adoption from 2007 to 2008. Half (50%) of those in the 50 through 64 age bracket had broadband at home by April 2008 and 19% of senior citizens (those 65 and older) did.
  • Suburban and Rural Americans: These two regions – two-thirds of the adult population – registered a 22% increase in broadband adoption from 2007 to 2008. Fully 60% of suburbanites and 38% of rural residents reported having broadband at home in our 2008 survey.

It is also worth noting that some 28% of respondents who have not completed high school said they have broadband at home in 2008, a 33% increase relative to 2007. This growth rate applies to a group that made up 13% of the sample.

Year-to-year changes 2007-2008

The chart below displays the growth rates from 2007 to 2008 across the disaggregated income categories. The figures at either end of the income distribution show poor performance among low income Americans and little growth among upper income Americans; broadband adoption grew from 82% to 85% from 2007 to 2008 in households with annual incomes above $100,000. Broadband adoption is approaching a saturation point for upper income Americans.

Percentage change in home broadband adoption by household income, 2007-2008

Many respondents do not tell us what their income is, but they do share whether they have high-speed connections at home. Among the roughly 20% of respondents who refuse to answer the income question, 34% had broadband connections at home in 2007; for respondents from our 2008 survey who did not provide information on income 41% had broadband at home. This is a growth rate of 21% from 2007 to 2008.

Fixed wireless has greater role in the home broadband market.

When asking people about their online connection speed, the survey question reads: “Does the computer you use at home connect to the internet through a dial-up telephone line, or do you have some other type of connection, such as a DSL-enabled phone line, a cable TV modem, a wireless connection, or a T-1 or fiber optic connection?” This yields not only whether people have broadband connections at home, but also the type of connection they use.

Composition of home broadband market 2002-2008

DSL providers maintain an edge in the home broadband market, with 46% of home broadband users saying they subscribe to DSL and 39% saying they have cable modem service. As a home high-speed connection, wireless has also increased its presence – from next to nothing in 2002 up to 12% of the home broadband market as of May 2008.

A handful (2%) of home broadband users has fiber optic connections.

Our May 2008 survey marked the first time respondents were asked whether they have fiber optic connections to the internet in their homes. Providers such as Verizon, with its FiOS service, have been marketing such connections that promise much faster upload and download speeds than DSL or cable. In the April 2008 survey, 2% of home broadband users said they had a fiber optic connection to the internet.

A few suburban broadband users are starting to get fiber at home, while some rural broadband users rely on satellite for broadband.

When comparing the type of broadband connections users choose by the kinds of places people live, some rural users rely on satellite – perhaps because they lack wired infrastructure where they live. By contrast, 4% of suburban broadband users say they have fiber to the home – and this makes up the strong majority of all fiber connections at home reported by respondents in this survey.

Broadband connection and places people live

Note that in the chart with aggregate trends in connection type, the lowest line combines T-1 and fiber optic connections reported by users. In the “fiber” column in the table above, figures show only the percentage in each category who specifically said they have a fiber optic connection at home.

Broadband is 4% cheaper than in 2005.

In the past, our surveys have asked what people pay per month for internet access; we last did this in December 2005. The April 2008 survey had different question wording to reflect that some people have internet service bundled with phone or cable service and, if so, most likely have a single bill for several services. Thus, the question wording in the April 2008 survey was:

“To the nearest dollar, about how much do you pay each month for internet access at home? If your internet access is combined with television or other services, I would like to know just the amount you pay for internet service.”

Overall, home broadband users reported that their monthly payment for internet service was $34.50 – 4% less than the figure of $36 per month reported in December 2005.3 This decline in monthly broadband bills is half the rate (8%) reported over the February 2004 to December 2005 timeframe.

As in 2005, there is a gap in what people pay for cable modem service compared to DSL, although it is narrower today than a few years ago. In December 2005, cable modem users reported monthly bills of $41 for service, while DSL users said they paid $32 per month for service. In May 2008, DSL users reported monthly internet access bills of $31.5 and cable modem users said they paid $37.5 for service, or an average difference of $6.

DSL versus cable

For dial-up users, the story was different. Their monthly access bill was $19.70 – 9% higher than the figure of $18 that dial-up users reported in December 2005.

Some broadband users pay for premium services.

One possible reason that users’ monthly broadband bills did not fall as fast from 2005 to 2008 as was the case in the 2004-05 interval is the existence of pricier premium service. Most (54%) of broadband users say they subscribe to basic broadband service, but nearly one-third (29%) say they subscribe to a premium service at a higher price. The survey specifically asked users whether they subscribe to a basic broadband service or if they pay extra for a premium service that promises faster speed.4

Here is how monthly costs differ for premium versus non-premium services:

  • Subscribers to a premium broadband service report a monthly bill of $38 for their internet service.
  • Subscribers to basic home broadband service report a monthly bill of $33 for their internet service.

People are likely to cite faster access speeds as the thing they like most about broadband, but few people actually know the speed of their connections.

Broadband users clearly like the faster access to content on the internet that their home high-speed connection affords them. When asked what they like most about having a broadband connection, 75% of home high-speed users cited faster access or greater speed. Other uses cited as the feature valued most included the “always on”’ connection (cited by 6% of broadband users), convenience (5%), job-related tasks (4%), downloading files of all types (3%), and finding educational materials (2%).

This is not to say that broadband users don’t value specific applications listed above (and others such as gaming and entertainment) that a high-speed connection enables. It is just that the broad notion of faster access speeds came to mind most often for respondents.

Analysis of Non-Broadband Users

Introduction

With more than half of Americans now with broadband and the number of dial-up users dwindling, it is worth asking those still going without broadband at home. The reasons why many Americans don’t have broadband fall into several non-mutually exclusive categories:

  • They don’t want broadband.
  • They can’t afford broadband.
  • They can’t get broadband where they live.
  • They aren’t internet users.
  • They don’t see the upside to modern information technology.

Some 62% of dial-up users say they aren’t interested in switching to broadband.

The April 2008 survey repeated a question posed several times in the past that asked dial-up user if they would like to have a faster broadband connection – or whether that is something they are not interested in. Just more than one-third (36%) say they would be interested in a switch, with 62% saying they would not be interested in changing to broadband. This figure hasn’t changed much since October 2002.

Interest in switching to broadband (% of dial-up users)

The roughly 60% of dial-up users consistently saying they are not interested in broadband, in the face of the shrinking pool of dial-up users, suggests that the preferences of dial-up users change over time. That is, assuming that many of those interested in getting broadband switched over to it from December 2005 to May 2008, some of those who said they were not interested in broadband in 2005 replenished the supply of “yes, interested in broadband” responses in order to maintain the 40-60 ratio of those interested in broadband versus the uninterested.

Many dial-up users say that they can’t afford broadband.

When pressed as to what might lure them into the ranks of home high-speed users, a plurality of dial-up respondents cited price. One-third (35%) of dial-up users said that they would switch to broadband if the price became more affordable and, as noted above, there remains a sizable gap in what dial-up users pay monthly for online access and what broadband users pay.

Affordability matters: 35% of dial-up users say they would switch to broadband if the price fell.

Dial-up users, as a group, are older and less well-off economically than their broadband counterparts: 29% of dial-up users live in households with annual incomes below $30,000 compared to 14% of broadband users in that income range. Some 43% of dial-up users are age 50 or older versus 29% for broadband users.

Finally, it is worth noting that dial-up users are disproportionately female and inhabitants of rural areas. Some 61% of dial-up users are women and 30% live in rural areas (compared to 13% of all broadband users in rural America).

Lack of broadband availability looms in the mind of some dial-up users.

Some dial-up users cite lack of availability as a reason they don’t switch to broadband. When asked what it would take to switch to broadband, one in ten (10%) dial-up users said they would make the change if it became available where they live or if their cable or phone company offered the service.

When both dial-up and non-internet users are asked generally whether “high-speed internet service is available in your neighborhood from a telephone company, cable company or any other company,” one-quarter (24%) say “no” and 13% respond that they do not know if it is available.

Whether framed in general terms to all non-broadband users or more narrowly only to dial-up users about whether availability is a barrier to switching, users’ respondents must be interpreted in the proper context. Users may report incorrectly about whether broadband is available where they live; in fact, broadband service is available everywhere a home can receive a satellite signal, although such service is typically more costly than and not as fast as DSL or cable service. Non-internet users in particular may be unreliable sources for information about the availability of a technology they do not use.

Nonetheless, the fact that rural residents are more likely to report that broadband isn’t available where they live indicates that infrastructure availability comes into play in broadband adoption. Some 28% of rural adult Americans without home high-speed say broadband isn’t available where they live, in contrast to 22% of non-rural Americans without broadband who say this.

Moreover, 15% of dial-up users in rural areas say having the service available where they live would prompt a switch to broadband; this compares to the 10% figure for all respondents.

Non-internet users – one-quarter of adults – represent the largest group of those without broadband.

Our April 2008 survey recorded 73% of American adults as internet users, meaning 27% of adults in the United States do not use the internet. Age and income are two factors that stand out when looking at non-internet users.

  • 43% of non-internet users are over the age of 65 or, put differently, 65% of senior citizens do not use the internet.
  • 43% of non-internet users have household incomes under $30,000 per year.

Although these demographic and socio-economic factors are powerful forces keeping some people off the net, many non-users are not completely disconnected from cyberspace.6 Some 21% of non-users say that someone in their household uses the internet at home. And one-fifth of non-users at one time user the internet; 18% of non-users said they had been in the past, and 10% of non-users said they would be interested in using the internet again.

33% of non-internet users say they are not interested in the internet.

Still, one-third (33%) of non-internet users say they are simply not interested in the internet, with another 12% saying they don’t have access. Some 9% of non-users say the internet is too difficult or frustrating for them and just 7% say it is too expensive.

Attitudes about information technology shape the broadband choice.

As the preceding discussion shows, socio-economic and demographic factors play large roles in explaining whether someone has broadband or not. Upper-income Americans are more than three times more likely to have broadband than low-income Americans to have broadband at home. Similarly, young adults are far more likely than senior citizens to have broadband at home.

The following table presents a demographic profile of online users versus non-internet users and clearly shows difference among these groups, as non-users are older and less wealthy than home dial-up or broadband users.

Demographic profiles: Home broadband, dial-up, and non-internet users

As powerful as these associations are, they are not the only things at play in broadband adoption decisions. People’s attitudes about information technology are also important. An older person may love to tinker with technology and enjoy the “always on” information pipeline that broadband offers. A person in a low-income household may be willing to allocate scarce discretionary funds to broadband – if he feels the connectivity offers something of value.

A question asked in a November 2007 survey about how people view the benefits to personal productivity from information technology shows the role attitude can play in connection choices. The survey asked respondents to say how strongly they agree with the following statement: “I believe I am more productive because of all of my electronic devices.”

Personal productivity and gadgets

A majority (67%) of broadband users view electronic devices, to some extent, as an aid to personal productivity, while a minority of dial-up users (46%) sees modern gadgetry in this way.

This is not to say that views on information and communication technology are the sole, or even primary, driver of the broadband choice. Some dial-up respondents may have lifestyles for which information technology might not have much to do with personal productivity. Nonetheless, even when controlling for the number of information devices a person may have and other factors, there is a significant correlation between attitudes about information technology and people’s choice of connection speed.7

This suggests that people’s age and income are not the only things behind the broadband choice. How people view the productive potential of information technology is also relevant – and not everyone sees this potential in the same way.

Few dial-up users take advantage of high-speed wireless connections to the internet.

With just more than one-third of broadband users saying they would like to get broadband, one might expect some to look for ways to connect via high-speed outside the house. As noted, 25% of all adults (or 34% of internet users) have gotten online away from home or work using a laptop and a WiFi wireless connection.

However, the practice of using WiFi connections away from home or work for online access is mainly the province of home broadband users. Some 40% of home broadband users have done this compared with 12% of those who use dial-up to go online from home. Put differently, 95% of those who say they have used a WiFi connection to go online are home broadband users.

WiFi is not the only wireless means of accessing the internet. Increasingly, handheld devices such as cell phones or personal digital assistants (such as Blackberries or iPhones) offer a pathway to the web. Some 39% of internet users say they have used a handheld device to go online – the figure is 41% for home broadband users and 36% for home dial-up users. Given the dwindling number or home dial-up users, this means that some 86% of those who use a handheld to access the internet are broadband users.

Although some cell phone networks today are capable of transmission rates of 200 kilobits per second (the FCC-defined threshold for a “first generation” broadband), it is difficult, if not impossible, to determine how many.8 And even 3G services that might reach 700 kps are below the threshold for “basic broadband” service.9 These figures suggest that the few dial-up users who do connect to the internet with a handheld device are experiencing fast speeds, so that handheld online access cannot be seen as a substitute for having a high-speed internet connection at home.

The Online Behavior of Broadband Users

Introduction: Premium services and “on the go” access

[1]

However, this pattern of more intense of online resources among broadband users continued as the technology disseminated more widely. For news consumption, for instance, high-speed connections tend to draw users (especially young ones) away from traditional as print newspapers and to the internet for news.11 The broadband pull, in other words, runs both ways. Those with high demand for internet applications get fast connections and do more with them. It is also true that many who get broadband at home are drawn to online alternatives available with their “always on” connection, sometimes as a substitute for offline resources.

The technology to access the internet has evolved since broadband first began to make inroads among consumers. WiFi technology allows users high-speed wireless access to the internet, typically using a laptop computer, although a range of handheld devices increasingly can connect to cyberspace using WiFi. Additionally, broadband providers no longer simply offer a fast online connection. Premium services offer higher speeds for those willing to pay.

This section examines the online behaviors of those who pay for premium broadband services at home or use laptops to connect to the internet with WiFi. Whereas having a broadband connection was once the marker of deeper engagement with cyberspace, now other access options are associated with heavier use of cyberspace.

Premium services

The April 2008 survey asked whether home broadband users “pay extra for a premium service that promises faster speed.” Here’s what home broadband users said:

  • 54% of home broadband users say they subscribe to basic service.
  • 29% subscribe to a premium service at a higher price.
  • 16% say they don’t know.

“On the go” access

Our report “Mobile Access to Data and Information” found that, as of December 2007, 41% of adult Americans had accessed the internet from someplace other than home or work using a wireless laptop connection or a handheld device such as a cell phone or personal digital assistant.12 Narrowing the set of “on the go” users only to those who have accessed the internet using a laptop computer and a wireless connection, the December 2007 survey showed that 27% of American adults had used this means to go online.

Our April 2008 survey shows a similar level of wireless online access using a laptop computer, with 25% of Americans saying they had done this – statistically indistinguishable from the December survey. This comes to 34% of internet users who have logged on using a WiFi connection and a laptop away from home or work.

Most of the time, this wireless access occurs in public places; some 58% of those who have connected to the internet in a place other than home or work using a wireless laptop connection say  they use access points in airports, coffee shops, or restaurants. Among those using WiFi in public places, 64% say they mostly use free WiFi services, 4% say they mostly pay for such services, with the remainder (32%) saying they use a mix of free and paid services.

Those who subscribe to premium services or use WiFi away from home or work to access the internet do more online.

Similar to the technique employed in past reports on broadband adoption, the analysis below examines whether intensity of online use differs for “on the go” and premium service users relative to all broadband users. The survey queried online users about 14 different online activities and the analysis below examines whether the different classes of users do a greater range of online activities than home broadband users as a whole.

Although home broadband and dial-up users are mutually exclusive, there is overlap between those who have connected to the internet “on the go” with a WiFi-enabled laptop and those who pay for premium broadband service at home. Some 13% of home broadband users say they have both logged on “on the go” with using WiFi and a laptop and pay for premium broadband service at home.

Online Activities

The following table reports responses to questions that ask respondents if they “yesterday” did a specific activity. This yields a portrait of what users in a specific category do on a typical day online.

Online Activities for a typical day

The following table summarizes the relative intensity of the different classes of users based using the average and median for the total number of activities users do out of the 14 listed – both for the total ever done and the total done on the typical day.

Summary of online activities across user classes

Premium service and “on the go” users are more intense users of the internet, as measured by scope of online activities ever done or engaged in on the typical day. When focusing on the mean number of online activities people do on the average day, “on the go” users are 26% more active than the average for broadband users. Those who have a premium service at home are 19% more active than the average for home broadband users. The higher levels of “typical day” use as measured by the median (or middle user) suggests the differences are broadly important.13

None of this is a surprise; in one instance, users have an additional on ramp to the internet with a wireless connection and in the other they have a faster one, as they say they pay for faster premium service.

At the same time, the results are evidence of a link between new ways of access and deeper engagement with the internet. In particular, the sizable share of internet users who have connected to the internet with a WiFi-enabled laptop have added “always connected” wireless access to their “always on” broadband connection.

As to the demographic profiles of these two classes of internet users, the table below shows that they are younger and better educated than average.

Demographic profiles

Methodology

This report is based on the findings of a daily tracking survey on Americans’ use of the Internet. The results in this report are based on data from telephone interviews conducted by Princeton Survey Research Associates International between April 8 to May 11, 2008, among a sample of 2,251 adults, 18 and older.  For results based on the total sample, one can say with 95% confidence that the error attributable to sampling and other random effects is plus or minus 2.4 percentage points.  For results based Internet users (n=1,553), the margin of sampling error is plus or minus 2.8 percentage points.  In addition to sampling error, question wording and practical difficulties in conducting telephone surveys may introduce some error or bias into the findings of opinion polls.

The sample for this survey is a random digit sample of telephone numbers selected from telephone exchanges in the continental United States. The random digit aspect of the sample is used to avoid “listing” bias and provides representation of both listed and unlisted numbers (including not-yet-listed numbers). The design of the sample achieves this representation by random generation of the last two digits of telephone numbers selected on the basis of their area code, telephone exchange, and bank number.

New sample was released daily and was kept in the field for at least five days. The sample was released in replicates, which are representative subsamples of the larger population. This ensures that complete call procedures were followed for the entire sample.  At least 10 attempts were made to complete an interview at sampled households. The calls were staggered over times of day and days of the week to maximize the chances of making contact with a potential respondent. Each household received at least one daytime call in an attempt to find someone at home.  In each contacted household, interviewers asked to speak with the youngest male currently at home. If no male was available, interviewers asked to speak with the youngest female at home. This systematic respondent selection technique has been shown to produce samples that closely mirror the population in terms of age and gender.  All interviews completed on any given day were considered to be the final sample for that day.

Non-response in telephone interviews produces some known biases in survey-derived estimates because participation tends to vary for different subgroups of the population, and these subgroups are likely to vary also on questions of substantive interest. In order to compensate for these known biases, the sample data are weighted in analysis. The demographic weighting parameters are derived from a special analysis of the most recently available Census Bureau’s March 2007 Annual Social and Economic Supplement. This analysis produces population parameters for the demographic characteristics of adults age 18 or older, living in households that contain a telephone. These parameters are then compared with the sample characteristics to construct sample weights. The weights are derived using an iterative technique that simultaneously balances the distribution of all weighting parameters.

Following is the full disposition of all sampled telephone numbers:

Table 1

PSRAI calculates a response rate as the product of three individual rates:  the contact rate, the cooperation rate, and the completion rate.  Of the residential numbers in the sample, 86 percent were contacted by an interviewer and 33 percent agreed to participate in the survey.  Eighty-eight percent were found eligible for the interview.  Furthermore, 89 percent of eligible respondents completed the interview.  Therefore, the final response rate is 25 percent.