Pew Research Center

FOR RELEASE OCTOBER 15, 2025

How People Around the World View AI

More are concerned than excited about its use, and more trust their own country and the EU to regulate it than trust the U.S. or China

BY Jacob Poushter, Moira Fagan and Manolo Corichi

FOR MEDIA OR OTHER INQUIRIES:

Communications Department
202.419.4372
www.pewresearch.org

RECOMMENDED CITATION

Pew Research Center, October 2025, "How People Around the World View AI"

About Pew Research Center

Pew Research Center is a nonpartisan, nonadvocacy fact tank that informs the public about the issues, attitudes and trends shaping the world. It does not take policy positions. The Center conducts public opinion polling, demographic research, computational social science research and other data-driven research. It studies politics and policy; news habits and media; the internet and technology; religion; race and ethnicity; international affairs; social, demographic and economic trends; science; research methodology and data science; and immigration and migration. Pew Research Center is a subsidiary of The Pew Charitable Trusts, its primary funder.

© Pew Research Center 2026

Table of contents

  • About Pew Research Center
  • How People Around the World View AI
  • 1. AI awareness around the world
  • 2. Concern and excitement about AI
  • 3. Trust in own country to regulate use of AI
  • 4. Trust in the EU, U.S. and China to regulate use of AI
  • Appendix A: Classifying European political parties
  • Appendix B: Political categorization
  • Acknowledgments
  • Methodology

How People Around the World View AI

More are concerned than excited about its use, and more trust their own country and the EU to regulate it than trust the U.S. or China

How we did this

This Pew Research Center analysis focuses on public opinion of artificial intelligence – including awareness of the technology and concern or excitement about its use – in 25 countries across the Asia-Pacific region, Europe, Latin America, the Middle East-North Africa region, North America and sub-Saharan Africa. The report also explores respondents’ trust in their own country, the European Union, the United States and China to regulate the use of AI.

A map showing Countries included in this report

For non-U.S. data, this analysis draws on nationally representative surveys of 28,333 adults conducted from Jan. 8 to April 26, 2025. All surveys were conducted over the phone with adults in Canada, France, Germany, Greece, Hungary, Italy, Japan, the Netherlands, Poland, South Korea, Spain, Sweden and the United Kingdom. Surveys were conducted face-to-face in Argentina, Brazil, India, Indonesia, Israel, Kenya, Mexico, Nigeria, South Africa and Turkey. In Australia, we used a mixed-mode probability-based online panel.

In the U.S., we surveyed 3,605 adults from March 24 to 30, 2025, and 5,023 adults from June 9 to 15, 2025. Everyone who took part in these surveys is a member of the Center’s American Trends Panel (ATP), a group of people recruited through national, random sampling of residential addresses who have agreed to take surveys regularly. This kind of recruitment gives nearly all U.S. adults a chance of selection. Surveys were conducted either online or by telephone with a live interviewer. The surveys are weighted to be representative of the U.S. adult population by gender, race, ethnicity, partisan affiliation, education and other categories. Read more about the ATP’s methodology.

In the U.S., questions about trust in various countries or institutions to regulate AI were asked on ATP Wave 166 in March, while questions about awareness of AI and reactions to it were asked on ATP Wave 173 in June. As we are not able to directly compare the two samples, the U.S. is excluded from some elements of this analysis.

For the purpose of comparing educational groups across countries, we standardize education levels based on the United Nations’ International Standard Classification of Education (ISCED). The lower education category is lower secondary education or below and the higher category is upper secondary or above in middle-income countries (as defined by the World Bank). The lower education category is upper secondary education or below and the higher category is postsecondary or above in high-income countries.

Here are the questions used for this analysis, along with responses, and the survey methodology.

A set of bar charts showing that Most people in surveyed countries have heard or read at least a little about AI and public concern about its increased use outweighs excitement

As the use of artificial intelligence (AI) increases rapidly, most people across 25 countries surveyed say they have heard or read at least a little about the technology.
And on balance, people are more concerned than excited about its growing presence in daily life.

A median of 34% of adults across these countries have heard or read a lot about AI, while 47% have heard a little and 14% say they’ve heard nothing at all, according to a spring 2025 Pew Research Center survey.

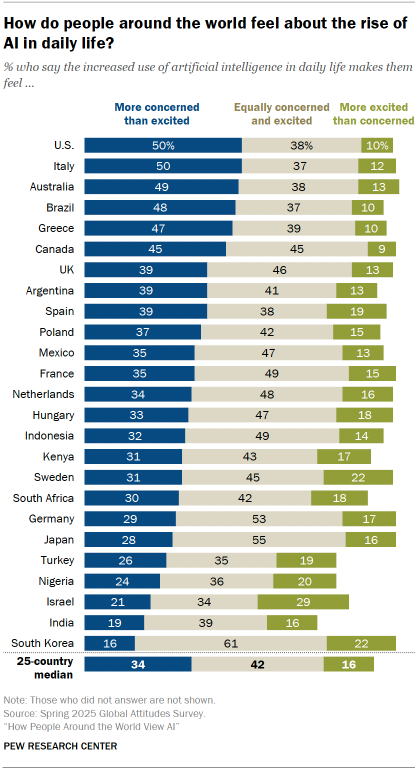
But many are worried about AI’s effects on daily life. A median of 34% of adults say they are more concerned than excited about the increased use of AI, while 42% are equally concerned and excited. A median of 16% are more excited than concerned.

What is a median?

In this analysis, median scores are used to help readers see overall patterns in the data. The median percentage is the middle number in a list of all percentages sorted from highest to lowest.

Concerns about AI are especially common in the United States, Italy, Australia, Brazil and Greece, where about half of adults say they are more concerned than excited. But as few as 16% in South Korea are mainly concerned about the prospect of AI in their lives.

A bar chart showing How people around the world feel about the rise of AI in daily life

In fact, in many countries surveyed, a larger share of people are equally excited and concerned about the growing use of AI. In no country surveyed do more than three-in-ten adults say they are mainly excited.

The survey also finds a strong correlation between a country’s income – as measured by gross domestic product per capita – and awareness of AI. People in higher-income nations tend to have heard more about AI than those in less wealthy economies. For example, around half of adults in the comparatively wealthy countries of Japan, Germany, France and the U.S. have heard a lot about AI, but only 14% in India and 12% in Kenya say the same.

Trust in government to regulate AI

The survey also asked whether people trust their own country, the European Union, the U.S. and China to regulate the use of AI effectively.

Most people trust their own country to regulate AI. This includes 89% of adults in India, 74% in Indonesia and 72% in Israel. At the other end of the spectrum, only 22% of Greeks trust their country to regulate AI effectively.

Americans are almost evenly divided between trust in their country to regulate AI (44%) and distrust (47%).

Generally, people who are more enthusiastic about AI are more likely to trust their country to regulate the technology. And in many countries, views on this question are related to party affiliation or support for the governing coalition.

In the U.S., for example, a majority of Republicans and independents who lean toward the Republican Party (54%) trust the U.S. to regulate AI effectively, compared with a smaller share of Democrats and Democratic Party leaners (36%).

Related: How Americans View AI and Its Impact on People and Society

When it comes to other regulating entities, more people globally tend to trust the EU to regulate AI than trust the U.S. or China.

A bar chart showing that More people trust their own country and the EU to regulate AI than trust the U.S. or China

A median of 53% of adults in the surveyed countries trust the EU to regulate AI, while 37% trust the U.S. and 27% trust China.

Trust in the EU varies widely among the organization’s member nations: Adults in Germany and Netherlands are the most trusting, while their counterparts in France, Greece, Italy and Poland are the least trusting. Overall, a median of 54% across the nine member nations surveyed trust the EU to regulate AI, while 48% across the nonmember nations surveyed say the same.

Public trust in various actors to regulate AI is closely tied to how people view them overall. Generally, people with a more positive view of the EU, the U.S. and China are more likely to trust them to regulate AI effectively.

For instance, in countries like Indonesia and South Africa – where views of China are more positive than views of the U.S. – people are more likely to trust China to regulate AI than to trust the U.S.

There are other interesting demographic and political differences on these questions of trust:

  • There is stronger trust in the U.S. as an AI regulator among people on the ideological right and among Europeans who support right-leaning populist parties.
  • There is stronger trust in China as an AI regulator among younger adults in 19 countries surveyed.
  • There is stronger trust in the EU as an AI regulator among people with more education in 19 countries. Additionally, Europeans who support right-wing populist parties are less likely than nonsupporters to trust the EU on this matter.

Demographic differences in awareness, perceptions of AI

Awareness and perceptions of AI differ along many demographic lines.

Age

A dot plot showing that Young adults are more likely than older people to have heard a lot about AI

Young adults in virtually every country surveyed are more aware of AI than their older counterparts. For instance, 68% of Greek adults under 35 have heard or read a lot about the technology, compared with 20% among those ages 50 and older.

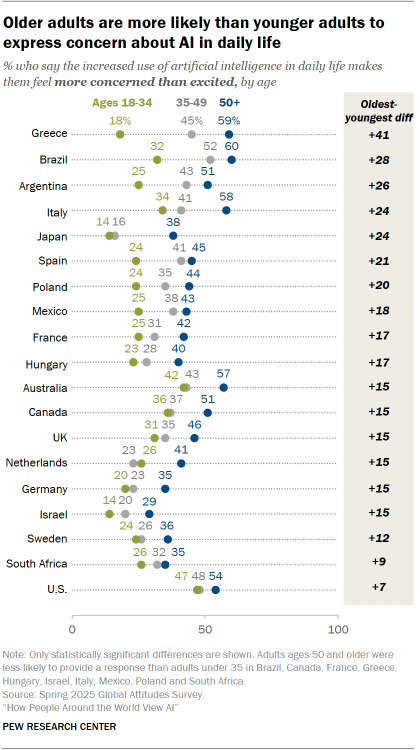
Young adults also tend to be more enthusiastic about AI. For example, 46% of Israeli adults under 35 are more excited than concerned about its increased use in daily life, compared with 15% of those ages 50 and older. Conversely, older adults are more concerned than excited relative to younger adults in 18 of the 25 countries surveyed.

Gender

In more than half of the countries polled, men are more likely than women to have heard a lot about AI. And in many countries, women are more likely than men to be mainly concerned about the increasing use of AI.

Education

Among people with less education, there is generally more concern than excitement about AI and less awareness of the technology overall, relative to people with more education.

Internet use

There is also a connection between internet use and views of AI. People who say they use the internet almost constantly are more likely than others to be mainly excited about the growing use of AI in everyday life. And in every country surveyed, these near-constant internet users are also more likely to have heard a lot about AI.

Related: Most adults across 24 countries are online at least several times a day

Jump to further analysis:

  • AI awareness around the world
  • Concern and excitement about AI
  • Trust in own country to regulate use of AI
  • Trust in the EU, U.S. and China to regulate use of AI

1. AI awareness around the world

Key findings

A bar chart showing How much people have heard or read about AI
  • A median of 34% of adults across 25 countries say they have heard or read a lot about artificial intelligence; 47% have heard a little about it and 14% have heard nothing at all.
  • In all surveyed countries except India and Kenya, at least half of the public has heard at least a little about AI.
  • Internet use is related to awareness of AI: People who say they are online almost constantly are more likely than others to have heard a lot about it.
  • Young adults, men and people with more education are more likely than other groups to have heard a lot about AI.

The share of adults who have heard or read a lot about AI varies widely by country. Consider Europe: In France, 52% report a high level of awareness, compared with 30% in Spain.

Across all the countries included in the survey, as many as 53% in Japan to as few as 12% in Kenya have heard a lot about AI. Overall, though, most people in these countries have heard at least a little about the technology.

By country’s GDP per capita

People in wealthier countries tend to be more likely than those in less wealthy countries to have heard or read a lot about AI. At one end of this spectrum is the U.S., where GDP per capita is about $86,000 and 47% of adults have heard a lot about AI. By comparison, in Kenya, GDP per capita is about $2,200 and 12% of adults say they have heard a lot about AI.

A line chart showing In wealthier countries, more people have heard a lot about AI

By age

A dot plot showing that Young adults are more likely than older adults to have heard a lot about AI

In most surveyed countries, adults under 35 are more likely than those ages 50 and older to have heard or read a lot about AI. For example, 77% of young Japanese adults have heard a lot about it, compared with 39% of their older counterparts. There are double-digit age differences across almost all of these countries.

By internet use

In every surveyed country, people who use the internet almost constantly are more likely those who use the internet less frequently to have heard a lot about AI.

For example, Polish adults who are online almost constantly are more than twice as likely as those who are online less often to have heard a lot about AI (68% vs. 26%).

By gender

In about half of the countries surveyed, men are more likely than women to have heard a lot about AI. One particularly large gender divide is in Hungary, where 49% of men and 27% of women report this level of awareness.

By education

Across most of the countries surveyed, people with more education are more likely than those with less education to say they have heard a lot about AI. (In some of these countries, people with less education were less likely to provide a response.)

2. Concern and excitement about AI

Key findings

A bar chart showing How people around the world feel about the rise of AI in daily life
  • A median of 34% of adults across 25 countries are more concerned than excited about the increased use of artificial intelligence in daily life. A median of 42% are equally concerned and excited, and 16% are more excited than concerned.
  • Older adults, women, people with less education and those who use the internet less often are particularly likely to be more concerned than excited.

Roughly half of adults in the U.S., Italy, Australia, Brazil and Greece say they are more concerned than excited about the increased use of AI in daily life.

But in 15 of the 25 countries polled, the largest share of people are equally concerned and excited.

In no country surveyed is the largest share more excited than concerned about the increasing use of AI in daily life.

Views by age

A dot plot showing that Older adults are more likely than younger adults to express concern about AI in daily life

In most countries polled, adults ages 50 and older are more likely than those ages 18 to 34 to say they are mainly concerned about the growing use of AI in daily life. For example, 59% of older Greeks are more concerned than excited, compared with 18% of younger Greeks. (In many of these countries, older adults were less likely to provide a response.)

In the U.S., the age gap is relatively small but still significant.

Views by gender

In some countries, women are more likely than men to be mostly concerned about the increased use of AI in daily life. In the United Kingdom, for instance, about half of women (47%) are more concerned than excited, compared with about a third of men (32%).

Views by education

In about half of the countries polled, people with less education are more likely than those with more education to be mainly concerned about AI in daily life. (In several of these places, people with less education were less likely to provide a response.)

Views by internet use

Opinion about increased AI use in daily life varies by internet usage. In many countries, concern about AI is more common among people who are online several times a day or less often than it is among those who are online almost constantly.

There is a particularly large divide in Greece, where about half of those online less often (52%) are more concerned than excited about AI, while 20% of those who are online almost constantly feel this way. (In several countries, people who are online less often were less likely to provide a response.)

Views by AI awareness

In many countries, people who have heard a lot about AI are more likely to be mainly excited about the technology. For example, 39% of South Koreans who have heard a lot about AI are more excited than concerned about its increased use, compared with 19% among those who have heard a little. (In a few countries, people who are less aware of AI were less likely to offer a response.)

3. Trust in own country to regulate use of AI

Key findings

A bar chart showing that Many around the world trust their own country’s ability to regulate the use of AI effectively
  • Across 25 countries surveyed, a median of 55% of adults have at least some trust in their nation’s ability to regulate AI, while 32% do not.
  • About nine-in-ten adults in India (89%) trust their country to regulate AI – the highest share in the survey. This includes 71% who have a lot of trust.
  • About two-thirds or more in Indonesia, Israel, Germany, the Netherlands, Australia and South Africa trust their nation to regulate AI.
  • Trust is lowest among Greeks: 22% trust their country to regulate AI.

By views of AI

A dot plot showing that People who are excited about AI are more trusting in their country’s ability to regulate its use effectively

In 19 countries, people who are more excited than concerned about the increased use of AI in daily life are more likely to trust their nation to regulate the technology effectively, compared with those who are more concerned than excited.

In Greece, for example, people who are mainly excited about AI are 35 percentage points more likely than those who are mainly concerned to trust their country to effectively regulate AI use.

By support for governing party

Trust in a country’s ability to regulate AI is also related to support for its governing party or parties.

Across most of the countries polled, supporters of the governing party are more likely than nonsupporters to trust that their nation can regulate AI effectively. (In a handful of these countries, people who do not support the governing party were less likely to provide a response.)

(Read Appendix B for more information on how we categorize political parties.)

4. Trust in the EU, U.S. and China to regulate use of AI

Key findings

A chart showing that Trust in the EU, U.S., China and own country to regulate AI varies across 25 nations
  • Across 25 countries surveyed, a median of 53% of adults trust the European Union to regulate AI effectively, while 34% do not.
  • A median of 54% across the nine EU member nations surveyed trust the organization to regulate AI, while 48% across the non-EU countries surveyed say the same.
  • A median of 37% trust the U.S. to regulate AI effectively, while 48% do not.
  • A median of 27% trust China to regulate AI effectively, while 60% do not.

Trust varies by several factors. For example, people who hold favorable views of the EU, the U.S. and China are more likely to trust they can regulate AI effectively. And people who are more excited than concerned about the increased use of AI also tend to have more trust in these actors to regulate it.

Younger adults tend to express higher levels of trust in China – and, to a lesser extent, in the U.S. – to regulate AI when compared with older adults.

Trust in the EU to regulate use of AI

A bar chart showing that Many trust the EU to regulate AI effectively

Across the 25 countries surveyed, a median of 53% of adults trust the EU to regulate AI use, while a median of 34% do not.

Trust in the EU varies widely among member nations. Adults in Germany and Netherlands are the most trusting: Around seven-in-ten express some or a lot of trust in the EU to regulate AI effectively. In Greece and Italy, by comparison, only around four-in-ten share this view.

Views vary in nonmember nations as well. Majorities of adults in Nigeria, Australia, Indonesia, Kenya and Canada trust the EU to regulate AI effectively. By contrast, roughly a third or fewer in Mexico, Argentina and Brazil say the same.

In the U.S., 43% trust the EU on AI regulation and 40% do not.

By opinion of the EU

In nearly all countries surveyed, people with a favorable view of the EU are more likely than those with an unfavorable view to trust the organization on AI regulation. In Poland, for example, 61% of adults with a favorable view of the EU trust it to regulate AI, compared with just 17% of those who have an unfavorable view of the EU.

By ideology

In some countries, people on the ideological right are less likely than those on the left to trust the EU to regulate AI. One of the largest ideological gaps is in the Netherlands, where 85% of those on the left trust the EU on this matter, compared with 61% on the right.

By support of right-wing populist parties

In Europe, people with a favorable opinion of some right-wing populist parties are less likely to trust the EU to effectively regulate AI. For example, 43% of Alternative for Germany (AfD) supporters trust the EU on this matter, compared with 78% of nonsupporters. (Read Appendix A for more information on how we classify populist parties.)

A dot plot showing In Europe, supporters of right-wing populist parties tend to have less confidence in the EU to regulate AI

By views of AI

People who are more excited than concerned about the growing use of AI in daily life are generally more likely to trust the EU to regulate the technology effectively, compared with those who are more concerned than excited. In Greece, for example, 62% of those who are mainly excited about AI trust the EU to regulate it, compared with 30% of those who are mainly concerned.

By education

In 19 countries, adults with more education are more likely than those with less education to trust the EU to regulate AI. In the UK, for instance, 67% of people with a postsecondary education have at least some trust in the EU to regulate AI, compared with 49% of those with less education.

Trust in the U.S. to regulate use of AI

A bar chart showing that Trust in U.S. to regulate AI varies across 25 countries

Across the 25 countries surveyed, a median of 37% of adults trust the U.S. to regulate the use of AI effectively, while a median of 48% do not.

People in Nigeria, Israel, India and Kenya stand out for their relatively trusting views, with six-in-ten adults or more reporting some or a lot of trust in the U.S. to regulate AI effectively. Half or more in South Korea, Hungary, Indonesia and South Africa also trust the U.S. to regulate AI effectively.

Americans themselves are split: 44% trust their country to regulate AI, while 47% do not. This partially reflects a partisan division, with Republicans and Republican-leaning independents more likely than Democrats and Democratic leaners to express a high level of trust (54% vs. 36%).

In the other 14 countries surveyed – including most of those in Europe – people broadly distrust the U.S. to regulate AI effectively.

By opinion of the U.S.

In every non-U.S. country surveyed, people with a favorable view of the U.S. are more likely than those with an unfavorable view to trust it on AI regulation. For example, in Turkey, 57% of those with a favorable view of the U.S. trust it to regulate the technology, compared with just 12% of those with an unfavorable view.

By views of AI

In 19 countries, people who are more excited than concerned about the increased use of AI in daily life are more likely to trust the U.S. to regulate it, compared with those who are more concerned than excited. In Brazil, for example, 58% of those who are mainly excited about increased AI use trust the U.S. to regulate it effectively, compared with 30% of those who are mainly concerned.

A similar pattern appears when respondents are asked about China, the EU and their own country: Those who are mostly excited about AI are generally more trusting about regulation.

By ideology

A dot plot showing that Adults on the right more trusting of U.S. to regulate AI

In 15 countries, people who place themselves on the ideological right express more trust in the U.S. to regulate AI effectively than those on the left.

This pattern appears in eight of the 10 European countries surveyed, with Spain showing one of the largest gaps (45% vs. 21%).

Outside of Europe, ideological divides emerge in eight countries. In Australia, for example, 53% of those on the right trust the U.S. to regulate AI, compared with 15% of those on the left. (For more on how we measure ideology in our cross-national surveys, read the report methodology.)

By support of right-wing populist parties

People who support right-wing populist parties in Europe are generally more trusting of the U.S. to regulate AI, compared with nonsupporters.

There are gaps on this question between supporters and nonsupporters of AfD in Germany, Brothers of Italy and Forza Italia, Fidesz and Jobbik in Hungary, Greek Solution, Law and Justice in Poland, National Rally in France, Party for Freedom in the Netherlands, Reform UK, and Vox in Spain.

By age

In 10 countries, adults ages 18 to 34 are more likely than those ages 50 and older to trust the U.S. to regulate AI. For example, 82% of young Nigerians trust the U.S. on this issue, compared with 65% of older Nigerians.

Trust in China to regulate use of AI

A bar chart showing that Majorities in many countries don’t trust China to regulate AI

There is relatively little trust in China to effectively regulate AI across the 25 countries surveyed. A median of 27% trust China to regulate the technology, while a median of 60% do not.

People in Kenya, Nigeria and South Africa are more likely than not to trust in China’s handling of AI regulation. Adults in Indonesia also express more trust than distrust.

Elsewhere, views are much less trusting. Aside from Hungary and Italy, majorities of adults in all the European countries surveyed express little or no trust in China’s ability to regulate AI.

Americans are among the least trusting: Just 13% trust China to regulate AI effectively, while 76% do not. And only 7% of Japanese adults trust China to regulate AI.

By opinion of China

Across all 25 countries surveyed, people who hold a favorable view of China are more likely to express trust in the country’s ability to effectively regulate AI, compared with people who have an unfavorable view. In Turkey, for example, 55% of adults with a favorable opinion of China trust it on AI regulation, compared with 21% of those with an unfavorable opinion.

By views of AI

In 15 countries, people who are more excited than concerned about the growing use of AI in daily life tend to be more trusting of China to regulate the technology, compared with those who are more concerned than excited. In Mexico, for instance, 56% of those who are mainly excited about AI trust China on this matter, compared with 32% among those who are mainly concerned.

By age

A dot plot showing that Younger adults are more trusting than older adults of China’s ability to regulate AI

In 19 countries surveyed, adults under 35 are somewhat more trusting than those ages 50 and older on China’s ability to regulate AI. One of the larger age gaps is in Spain, where 54% of younger adults trust China on this issue, compared with 21% of older adults.

In several of these countries, adults ages 50 and older are more likely than those under 35 to say they are unsure if they trust China to regulate AI.

Beyond AI regulation, the survey also shows that, in most countries, younger people have more favorable views of China in general than older people.

Appendix A: Classifying European political parties

Classifying parties as populist

Although experts generally agree that populist political leaders or parties display high levels of anti-elitism, definitions of populism vary. We use three measures to classify populist parties: anti-elite ratings from the 2019 Chapel Hill Expert Survey (CHES), Norris’ Global Party Survey and The PopuList. We define a party as populist when at least two of these three measures classify it as such.

CHES, which was conducted from February to May 2020, asked 421 political scientists specializing in political parties and European integration to evaluate the 2019 positions of 277 European political parties across all European Union member states. CHES results are regularly used by academics to classify parties with regard to their left-right ideological leanings, their key party platform positions and their degree of populism, among other things.

We measure anti-elitism using an average of two variables in the CHES data. First, we used “PEOPLE_VS_ELITE,” which asked the experts to measure the parties with regard to their position on direct versus representative democracy, where 0 means that the parties support elected officeholders making the most important decisions and 10 means that “the people,” not politicians, should make the most important decisions. Second, we used “ANTIELITE_SALIENCE,” which is a measure of the salience of anti-establishment and anti-elite rhetoric for that particular party, with 0 meaning not at all salient and 10 meaning extremely salient. The average of these two measures is shown in the table below as “anti-elitism.” In all countries, we consider parties that score at or above a 7.0 as “populist.”

The Global Party Survey, which was conducted from November to December 2019, asked 1,861 experts on political parties, public opinion, elections and legislative behavior to evaluate the ideological values, issue position and populist rhetoric of parties in countries on which they are an expert, classifying a total of 1,051 parties in 163 countries. We used “TYPE_POPULISM,” which categorizes populist rhetoric by parties. We added only “strongly populist” parties using this measure. In Italy, experts were asked to categorize the entire center-right coalition instead of individual parties within the coalition. The coalition includes Lega, Forza Italia and Brothers of Italy. For all three parties, we applied the coalition rating of “strongly populist.”

The PopuList is an ongoing project to classify European political parties as populist, far right, far left and/or euroskeptic. The project specifically looks at parties that have “been represented in their country’s national parliament at least once” since 1989. It is based on collaboration between academic experts and journalists. The PopuList classifies parties that emphasize the will of the people against the elite as populist.1 This appendix uses The PopuList 3.0.

Classifying parties as left, right or center

We can further classify these traditional and populist parties into three groups: left, right and center. When classifying parties based on ideology, we relied on the variable “LRGEN” in the CHES dataset, which asked experts to rate the positions of each party in terms of its overall ideological stance, with 0 meaning extreme left, 5 meaning center and 10 meaning extreme right. We define left parties as those that score below 4.5 and right parties as those above 5.5. Center parties have ratings between 4.5 and 5.5.

A table showing European populist party classifications

Appendix B: Political categorization

For this analysis, we grouped people into two political categories: those who support the governing political party (or parties) in their country, and those who do not. These categories were coded based on the party or parties in power at the time the survey was fielded and on respondents’ answers to a question asking which political party, if any, they identify with in their country.2

In countries where multiple political parties govern in coalition (as is the case in many European countries), survey respondents who indicate support for any party in the coalition were grouped together. In Germany, for example, where the Social Democratic Party governed with Alliance 90/The Greens at the time of the 2025 survey, supporters of either party were grouped together. In countries where different political parties control the executive and legislative branches of government, the party holding the executive branch was considered the governing party.

Survey respondents who did not indicate support for any political party, or who refused to identify with one, were categorized as not supporting the government in power.

The table below outlines the governing political parties in each survey country.

A table showing Political categorization

Acknowledgments

This report is a collaborative effort based on the input and analysis of the following individuals.

Jacob Poushter, Associate Director, Global Attitudes Research
Moira Fagan, Research Associate
Manolo Corichi, Research Analyst

Julia Armeli, Research Assistant
Dorene Asare-Marfo, Senior Panel Manager
Peter Bell, Associate Director, Design and Production
Janakee Chavda, Associate Digital Producer
Laura Clancy, Research Analyst
Jonathan Evans, Senior Researcher
Janell Fetterolf, Senior Researcher
Shannon Greenwood, Digital Production Manager
Sneha Gubbala, Research Analyst
Sofia Hernandez Ramones, Research Assistant
Anna Jackson, Editorial Specialist
Carolyn Lau, International Research Methodologist
Gar Meng Leong, Communications Manager
Kirsten Lesage, Research Associate
Jordan Lippert, Research Analyst
John Carlo Mandapat, Information Graphics Designer
Richard Wike, Director, Global Attitudes Research
William Miner, Research Analyst
Patrick Moynihan, Associate Director, International Research Methods
Georgina Pizzolitto, Research Methodologist
Andrew Prozorovsky, Research Assistant
Dana Popky, Associate Panel Manager
Jonathan Schulman, Research Associate
Laura Silver, Associate Director, Global Attitudes Research
Sofi Sinozich, International Research Methodologist
Maria Smerkovich, Research Associate
DeVonte Smith, Communications Associate
Brianna Vetter, Administrative Associate

Methodology

About Pew Research Center’s Spring 2025 Global Attitudes Survey

Results for the survey are based on a mix of telephone, face-to-face and online interviews conducted under the direction of Gallup, Langer Research Associates and Social Research Centre. The results are based on national samples, unless otherwise noted. Read more about our international survey methodology and country-specific sample designs.

Some, but not all, of our international analyses and reports use demographic variables or categorizations based on external data. We explain these more below:

Ideology

We analyze respondents’ attitudes based on where they place themselves on an ideological scale. We asked about political ideology using several slightly different scales and categorized people as being on the ideological left, center or right.

  • In most countries, we asked people to place themselves on a scale ranging from “Extreme left” to “Extreme right.” The question was asked this way in Argentina, Australia, Brazil, Canada, France, Germany, Greece, Hungary, Israel, Italy, Mexico, the Netherlands, Nigeria, Poland, South Africa, Spain, Sweden, Turkey and the UK.
  • In Japan and South Korea, ideology was measured on a scale from “Extremely progressive” to “Extremely conservative.”
  • In the U.S., ideology is defined as conservative (right), moderate (center) and liberal (left).
  • Ideology was not asked about in India, Indonesia or Kenya.

Education

To compare educational groups across countries, we standardize education levels based on the United Nations’ International Standard Classification of Education (ISCED).

High- and middle-income countries

Countries are classified as either high or middle income based on categories from the World Bank that rely on per capita gross national income. This is a classification we have used in other Pew Research Center analyses, including when looking at global views of China, satisfaction with democracy, globalization and national identity.

The American Trends Panel survey Wave 166 methodology

Overview

Data in this report comes from Wave 166 of the American Trends Panel (ATP), Pew Research Center’s nationally representative panel of randomly selected U.S. adults. The survey was conducted March 24-30, 2025. A total of 3,605 panelists responded out of 4,045 who were sampled, for a survey-level response rate of 89%.

The cumulative response rate accounting for nonresponse to the recruitment surveys and attrition is 3%. The break-off rate among panelists who logged on to the survey and completed at least one item is 1%. The margin of sampling error for the full sample of 3,605 respondents is plus or minus 1.9 percentage points.

The survey includes oversamples of Jewish, Muslim and non-Hispanic Asian adults in order to provide more precise estimates of the opinions and experiences of these smaller demographic subgroups. These oversampled groups are weighted back to reflect their correct proportions in the population.

SSRS conducted the survey for Pew Research Center via online (n=3,460) and live telephone (n=145) interviewing. Interviews were conducted in both English and Spanish.

To learn more about the ATP, read “About the American Trends Panel.”

Panel recruitment

Since 2018, the ATP has used address-based sampling (ABS) for recruitment. A study cover letter and a pre-incentive are mailed to a stratified, random sample of households selected from the U.S. Postal Service’s Computerized Delivery Sequence File. This Postal Service file has been estimated to cover 90% to 98% of the population.3 Within each sampled household, the adult with the next birthday is selected to participate. Other details of the ABS recruitment protocol have changed over time but are available upon request.4 Prior to 2018, the ATP was recruited using landline and cellphone random-digit-dial surveys administered in English and Spanish.

A national sample of U.S. adults has been recruited to the ATP approximately once per year since 2014. In some years, the recruitment has included additional efforts (known as an “oversample”) to improve the accuracy of data for underrepresented groups. For example, Hispanic adults, Black adults and Asian adults were oversampled in 2019, 2022 and 2023, respectively.

Sample design

The overall target population for this survey was noninstitutionalized persons ages 18 and older living in the United States. It featured a stratified random sample from the ATP in which Jewish, Muslim and non-Hispanic Asian adults were selected with certainty. The remaining panelists were sampled at rates designed to ensure that the share of respondents in each stratum is proportional to its share of the U.S. adult population to the greatest extent possible. Respondent weights are adjusted to account for differential probabilities of selection as described in the Weighting section below.

Questionnaire development and testing

The questionnaire was developed by Pew Research Center in consultation with SSRS. The web program used for online respondents was rigorously tested on both PC and mobile devices by the SSRS project team and Pew Research Center researchers. The SSRS project team also populated test data that was analyzed in SPSS to ensure the logic and randomizations were working as intended before launching the survey.

Incentives

All respondents were offered a post-paid incentive for their participation. Respondents could choose to receive the post-paid incentive in the form of a check or gift code to Amazon.com, Target.com or Walmart.com. Incentive amounts ranged from $5 to $20 depending on whether the respondent belongs to a part of the population that is harder or easier to reach. Differential incentive amounts were designed to increase panel survey participation among groups that traditionally have low survey response propensities.

Data collection protocol

The data collection field period for this survey was March 24-30, 2025. Surveys were conducted via self-administered web survey or by live telephone interviewing.

For panelists who take surveys online:5 Postcard notifications were mailed to a subset on March 24.6 Survey invitations were sent out in two separate launches: soft launch and full launch. Sixty panelists were included in the soft launch, which began with an initial invitation sent on March 24. All remaining English- and Spanish-speaking sampled online panelists were included in the full launch and were sent an invitation on March 25.

A table showing Invitation and reminder dates for web respondents, ATP Wave 166

Panelists participating online were sent an email invitation and up to two email reminders if they did not respond to the survey. ATP panelists who consented to SMS messages were sent an SMS invitation with a link to the survey and up to two SMS reminders.

For panelists who take surveys over the phone with a live interviewer: Prenotification postcards were mailed on March 21. Soft launch took place on March 24 and involved dialing until a total of five interviews had been completed. All remaining English- and Spanish-speaking sampled phone panelists’ numbers were dialed throughout the remaining field period. Panelists who take surveys via phone can receive up to six calls from trained SSRS interviewers.

Data quality checks

To ensure high-quality data, Center researchers performed data quality checks to identify any respondents showing patterns of satisficing. This includes checking for whether respondents left questions blank at very high rates or always selected the first or last answer presented. As a result of this checking, three ATP respondents were removed from the survey dataset prior to weighting and analysis.

Weighting

A table showing American Trends Panel weighting dimensions

The ATP data is weighted in a process that accounts for multiple stages of sampling and nonresponse that occur at different points in the panel survey process. First, each panelist begins with a base weight that reflects their probability of recruitment into the panel. These weights are then calibrated to align with the population benchmarks in the accompanying table to correct for nonresponse to recruitment surveys and panel attrition. If only a subsample of panelists was invited to participate in the wave, this weight is adjusted to account for any differential probabilities of selection.

Among the panelists who completed the survey, this weight is then calibrated again to align with the population benchmarks identified in the accompanying table and trimmed at the 1st and 99th percentiles to reduce the loss in precision stemming from variance in the weights. Sampling errors and tests of statistical significance take into account the effect of weighting.

The following table shows the unweighted sample sizes and the error attributable to sampling that would be expected at the 95% level of confidence for different groups in the survey.

A table showing Sample sizes and margins of error, ATP Wave 166

Sample sizes and sampling errors for other subgroups are available upon request. In addition to sampling error, one should bear in mind that question wording and practical difficulties in conducting surveys can introduce error or bias into the findings of opinion polls.

Dispositions and response rates

A table showing Final dispositions, ATP Wave 166
A table showing Cumulative response rate, ATP Wave 166

The American Trends Panel survey Wave 173 methodology

Overview

Data in this report comes from Wave 173 of the American Trends Panel (ATP), Pew Research Center’s nationally representative panel of randomly selected U.S. adults. The survey was conducted from June 9 to 15, 2025. A total of 5,023 panelists responded out of 5,737 who were sampled, for a survey-level response rate of 88%.

The cumulative response rate accounting for nonresponse to the recruitment surveys and attrition is 3%. The break-off rate among panelists who logged on to the survey and completed at least one item is 1%. The margin of sampling error for the full sample of 5,023 respondents is plus or minus 1.6 percentage points.

The survey includes an oversample of non-Hispanic Asian adults in order to provide more precise estimates of the opinions and experiences of this smaller demographic subgroup. Oversampled groups are weighted back to reflect their correct proportions in the population.

SSRS conducted the survey for Pew Research Center via online (n=4,842) and live telephone (n=181) interviewing. Interviews were conducted in both English and Spanish.

To learn more about the ATP, read “About the American Trends Panel.”

Panel recruitment

Since 2018, the ATP has used address-based sampling (ABS) for recruitment. A study cover letter and a pre-incentive are mailed to a stratified, random sample of households selected from the U.S. Postal Service’s Computerized Delivery Sequence File. This Postal Service file has been estimated to cover 90% to 98% of the population.7 Within each sampled household, the adult with the next birthday is selected to participate. Other details of the ABS recruitment protocol have changed over time but are available upon request.8 Prior to 2018, the ATP was recruited using landline and cellphone random-digit-dial surveys administered in English and Spanish.

A national sample of U.S. adults has been recruited to the ATP approximately once per year since 2014. In some years, the recruitment has included additional efforts (known as an “oversample”) to improve the accuracy of data for underrepresented groups. For example, Hispanic adults, Black adults and Asian adults were oversampled in 2019, 2022 and 2023, respectively.

Sample design

The overall target population for this survey was noninstitutionalized persons ages 18 and older living in the United States. It featured a stratified random sample from the ATP in which non-Hispanic Asian adults were selected with certainty. The remaining panelists were sampled at rates designed to ensure that the share of respondents in each stratum is proportional to its share of the U.S. adult population to the greatest extent possible. Respondent weights are adjusted to account for differential probabilities of selection as described in the Weighting section below.

Questionnaire development and testing

The questionnaire was developed by Pew Research Center in consultation with SSRS. The web program used for online respondents was rigorously tested on both PC and mobile devices by the SSRS project team and Pew Research Center researchers. The SSRS project team also populated test data that was analyzed in SPSS to ensure the logic and randomizations were working as intended before launching the survey.

Incentives

All respondents were offered a post-paid incentive for their participation. Respondents could choose to receive the post-paid incentive in the form of a check or gift code to Amazon.com, Target.com or Walmart.com. Incentive amounts ranged from $5 to $20 depending on whether the respondent belongs to a part of the population that is harder or easier to reach. Differential incentive amounts were designed to increase panel survey participation among groups that traditionally have low survey response propensities.

Data collection protocol

The data collection field period for this survey was June 9-15, 2025. Surveys were conducted via self-administered web survey or by live telephone interviewing.

For panelists who take surveys online:9 Postcard notifications were mailed to a subset on June 9.10 Survey invitations were sent out in two separate launches: soft launch and full launch. Sixty panelists were included in the soft launch, which began with an initial invitation sent on June 9. All remaining English- and Spanish-speaking sampled online panelists were included in the full launch and were sent an invitation on June 10.

A table showing Invitation and reminder dates for web respondents, ATP Wave 173

Panelists participating online were sent an email invitation and up to two email reminders if they did not respond to the survey. ATP panelists who consented to SMS messages were sent an SMS invitation with a link to the survey and up to two SMS reminders.

For panelists who take surveys over the phone with a live interviewer: Prenotification postcards were mailed on June 6. Soft launch took place on June 9 and involved dialing until a total of seven interviews had been completed. All remaining English- and Spanish-speaking sampled phone panelists’ numbers were dialed throughout the remaining field period. Panelists who take surveys via phone can receive up to six calls from trained SSRS interviewers.

Data quality checks

To ensure high-quality data, Center researchers performed data quality checks to identify any respondents showing patterns of satisficing. This includes checking for whether respondents left questions blank at very high rates or always selected the first or last answer presented. As a result of this checking, three ATP respondents were removed from the survey dataset prior to weighting and analysis.

Weighting

The ATP data is weighted in a process that accounts for multiple stages of sampling and nonresponse that occur at different points in the panel survey process. First, each panelist begins with a base weight that reflects their probability of recruitment into the panel. These weights are then calibrated to align with the population benchmarks in the accompanying table to correct for nonresponse to recruitment surveys and panel attrition. If only a subsample of panelists was invited to participate in the wave, this weight is adjusted to account for any differential probabilities of selection.

Among the panelists who completed the survey, this weight is then calibrated again to align with the population benchmarks identified in the accompanying table and trimmed at the 1st and 99th percentiles to reduce the loss in precision stemming from variance in the weights. Sampling errors and tests of statistical significance take into account the effect of weighting.

A table showing American Trends Panel weighting dimensions

The following table shows the unweighted sample sizes and the error attributable to sampling that would be expected at the 95% level of confidence for different groups in the survey.

A table showing Sample sizes and margins of error, ATP Wave 173

Sample sizes and sampling errors for other subgroups are available upon request. In addition to sampling error, one should bear in mind that question wording and practical difficulties in conducting surveys can introduce error or bias into the findings of opinion polls.

Dispositions and response rates

A table showing Final dispositions, ATP Wave 173
A table showing Cumulative response rate, ATP Wave 173