Pew Research Center

FOR RELEASE JANUARY 18, 2024

Language and Traditions Are Considered Central to National Identity

Publics around the world divided on birthplace and religion as requirements for national belonging

BY Christine Huang, Laura Clancy and Sarah Austin

FOR MEDIA OR OTHER INQUIRIES:

Communications Department
202.419.4372
www.pewresearch.org

RECOMMENDED CITATION

Pew Research Center, January 2024, "Language and Traditions Are Considered Central to National Identity"

About Pew Research Center

Pew Research Center is a nonpartisan, nonadvocacy fact tank that informs the public about the issues, attitudes and trends shaping the world. It does not take policy positions. The Center conducts public opinion polling, demographic research, computational social science research and other data-driven research. It studies politics and policy; news habits and media; the internet and technology; religion; race and ethnicity; international affairs; social, demographic and economic trends; science; research methodology and data science; and immigration and migration. Pew Research Center is a subsidiary of The Pew Charitable Trusts, its primary funder.

© Pew Research Center 2026

Table of contents

  • About Pew Research Center
  • Language and Traditions Are Considered Central to National Identity
  • 1. Views on the importance of language to national identity
  • 2. Views on the importance of customs and traditions to national identity
  • 3. Views on the importance of birthplace to national identity
  • 4. Views on the importance of religion to national identity
  • Acknowledgments
  • Appendix A: National identity index
  • Appendix B: Country-specific language
  • Appendix C: Country-specific religion
  • Methodology

Language and Traditions Are Considered Central to National Identity

Publics around the world divided on birthplace and religion as requirements for national belonging

How we did this

This Pew Research Center analysis explores attitudes on the importance of language, customs and traditions, birthplace, and religion as components of national identity in 23 countries in North America, Europe, the Middle East, the Asia-Pacific region, sub-Saharan Africa and Latin America. National identity is examined in the context of trend data. This is the first year since 2019 that the Global Attitudes Survey has included countries from Africa and Latin America due to the coronavirus outbreak.

The languages and religions we asked about in the survey vary by country and were determined with the input of local survey vendors. Refer to Appendix B for more information on the languages included in the survey and Appendix C for more on the religions included.

For non-U.S. data, this report draws on nationally representative surveys of a total of 24,674 adults conducted from Feb. 20 to May 22, 2023. All surveys were conducted over the phone with adults in Canada, France, Germany, Greece, Italy, Japan, the Netherlands, South Korea, Spain, Sweden and the United Kingdom. Surveys were conducted face-to-face in Hungary, Poland, Indonesia, Israel, Kenya, Nigeria, South Africa, Argentina, Brazil and Mexico. In Australia, we used a mixed-mode probability-based online panel.

In the United States, we surveyed 3,576 U.S. adults from March 20 to March 26, 2023. Everyone who took part in this survey is a member of the Center’s American Trends Panel (ATP), an online survey panel that is recruited through national, random sampling of residential addresses. This way nearly all U.S. adults have a chance of selection. The survey is weighted to be representative of the U.S. adult population by gender, race, ethnicity, partisan affiliation, education and other categories. Read more about the ATP’s methodology.

Here are the questions used for the report, along with responses, and the survey methodology.

Results of a Pew Research Center survey highlight language and customs as key components of national identity, while views on the importance of birthplace and religion are more divided.

A bar chart showing that Speaking the most common language and sharing traditions are considered key aspects of national identity

Across more than 20 countries surveyed, a median of 91% say being able to speak their country’s most common language is important for being considered a true national, and 81% say sharing their country’s customs and traditions is important for true belonging. Views on the importance of birthplace and religion to national identity are mixed.

Of the four dimensions of national identity included in the survey, language is by far the most valued. In all countries where we asked about it, about eight-in-ten or more point to language as important for true belonging in the country. And in 13 countries, at least six-in-ten consider it a very important factor. (Explore more views about language in Chapter 1.)

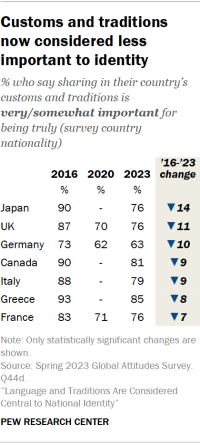
Participation in a country’s customs and traditions is also valued: Around seven-in-ten or more consider sharing national customs and traditions important for true belonging in most countries. Emphasis on shared customs has declined somewhat since 2016, including by double digits in Germany, Japan and the United Kingdom. (Explore more views about customs and traditions in Chapter 2.)
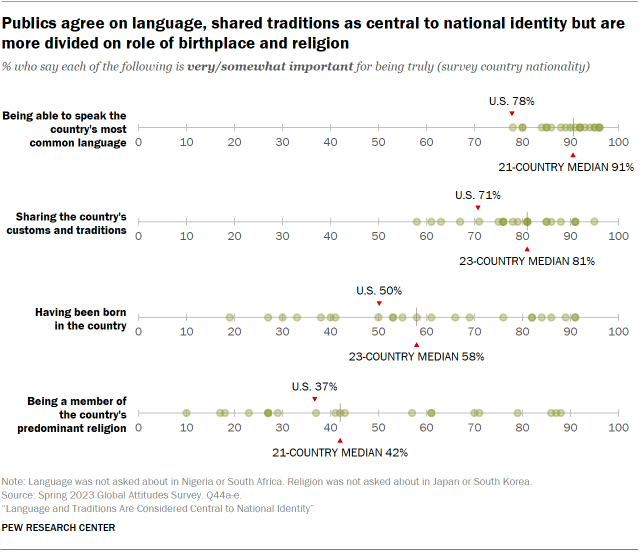
A dot plot showing that Publics agree on language and shared traditions as central to national identity but are more divided on role of birthplace and religion

The connection between birthplace and national identity is somewhat weaker. Majorities in about half of the countries say being born there is important for truly belonging. The middle-income countries surveyed place greater emphasis on birthplace than the high-income countries in the study. At least three-quarters in all seven middle-income countries believe being born in their country is important for being considered a true national. Notably, United Nations research has found that middle-income countries are home to a lower share of international migrants than high-income nations. (Explore more views about birthplace in Chapter 3.)

Views on religion as a component of national identity vary significantly across the nations surveyed, with several middle-income countries especially likely to consider it important. In contrast, fewer than one-in-four think being a member of the predominant religion is important to true belonging in the high-income countries of Australia, France, Spain and Sweden. (Explore more views about religion in Chapter 4.)

The United States stands out for having the lowest share who say speaking the country’s most common language is important for being a true national (78%). A relatively low share of Americans say the same about participating in the country’s traditions (71%). On the other hand, those in the U.S. place more emphasis on being a member of the country’s primary religion than people in most other high-income countries surveyed (37%). U.S. views on birthplace fall around the middle of the high-income countries (50%).

To compare how many dimensions respondents consider important for true belonging in each country, we created an index based on all four dimensions of national identity included in the survey. Using the index, Indonesians stand out as considering the greatest number of dimensions important for true belonging, while Sweden stands out as the nation with the fewest conditions. (For more information on the index, refer to Appendix A.)

These findings come from a Pew Research Center survey conducted from Feb. 20 to May 22, 2023, among 28,250 people in 23 countries.

Views by political ideology

Dot plot showing differences in how conservative, moderate, and liberal Americans view four components of national identity. Conservative Americans assign more importance to all four components than liberals do.

Who counts as a true national is a partisan issue in many countries, and those on the ideological right generally consider more factors important for belonging.

The U.S. sees some of the greatest ideological divides, with conservative Americans at least 30 percentage points more likely than liberals to consider each component we asked about important for being truly American. The gap is most pronounced when it comes to religion: Conservatives are 44 points more likely than liberals to say being a Christian is important for being truly American.

Views by age, education and religion

A dot plot showing that Older adults place greater importance on religion as part of their country’s national identity

Older adults tend to place greater importance on many of the components of national identity we asked about. The age divide is especially notable in Canada, Germany, Japan, South Korea, Sweden and the U.S., where older adults consider all factors included in the survey as more important for true belonging. For example, Canadians ages 40 and older are at least 10 points more likely than those ages 18 to 39 to label each dimension as important to Canadian identity.

Views also differ between those with more education and those with less. In most countries, those with less education tend to see being born in the country and being a member of the country’s primary religion as important components of national identity. Evaluations of the importance of customs and traditions also vary by education level in some countries, but no differences are present when it comes to the importance of language.

Religious identity is linked to views of national identity. Most, if not all, factors are seen as more important by members of the country’s primary religion in most places surveyed. In comparison, those who do not ascribe to the country’s most common religion place less importance on each factor. For example, in the U.S., Christians are more likely than those of other religious affiliations – including those who are atheist, agnostic or say their religion is “nothing in particular” – to see being Christian, being born in the U.S., speaking English, and sharing U.S. customs and traditions as important for being truly American.
1. Views on the importance of language to national identity

Large majorities in the 21 countries where we fielded this question say being able to speak their country’s most common language is important to national identity. And majorities in more than two-thirds of these countries say speaking the language is very important. (For more on which language was asked about in each country, refer to Appendix B.)

Opinions are strongest in Hungary, Indonesia and the Netherlands, where 96% say speaking the most common language is important, and at least six-in-ten say it is very important. High shares echo this sentiment in Brazil and Kenya, where around three-quarters or more say it is very important. Even in the U.S. – where people are the least likely to place importance on speaking the most common language – nearly eight-in-ten hold this view.

A dot plot showing that Those on the ideological right are more likely than those on the left to tie language to national belonging

Who is most likely to see language as important to national identity?

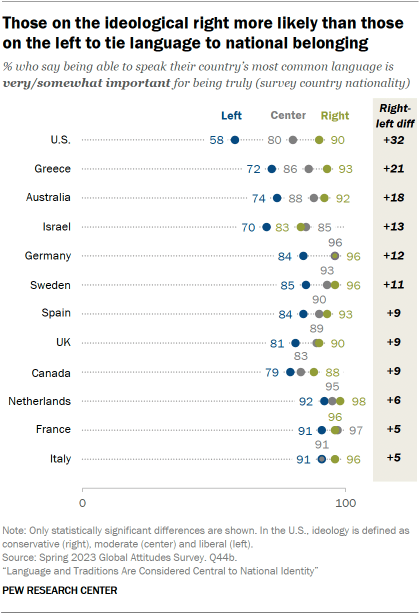
While most agree that speaking the country’s most common language is important to national identity, those on the ideological right are more likely than those on the left to say this in 12 countries. The U.S., which places the least importance on language, sees the greatest ideological difference. Conservatives in the U.S. are over 30 percentage points more likely than liberals to say speaking English is important to being truly American (90% vs. 58%).

Religious identity is also linked to views on this question. In some of the countries surveyed, members of the primary religion are more likely than those who do not belong to the primary religion to say speaking the country’s most common language is important.

Notably, there are no differences by education level or age on this question.

2. Views on the importance of customs and traditions to national identity

Majorities in all 23 countries surveyed say that sharing in their country’s customs and traditions is at least somewhat important to national identity. This includes seven countries where majorities say these national customs are very important to true belonging in their country.

Customs and traditions are seen as important to national identity by nine-in-ten or more in Hungary, Indonesia, Mexico and Poland. A notable 79% of Indonesian adults consider these practices a very important part of being Indonesian.

Israelis are some of the least likely to call shared traditions important to their national identity, along with Brazilians, Germans and Swedes. Roughly a third or more of each say such practices are not very or at all important.

A dot plot showing that Customs and traditions are considered more important to national identity by those on the ideological right

Who is most likely to see customs and traditions as important to national identity?

In over half of the countries surveyed, adults who are affiliated with the country’s primary religion are more likely than those who aren’t to place importance on partaking in national customs. For example, 85% of Italians who identify as Catholic see shared cultural practices as important to being truly Italian, compared with 65% of those who are not Catholic.

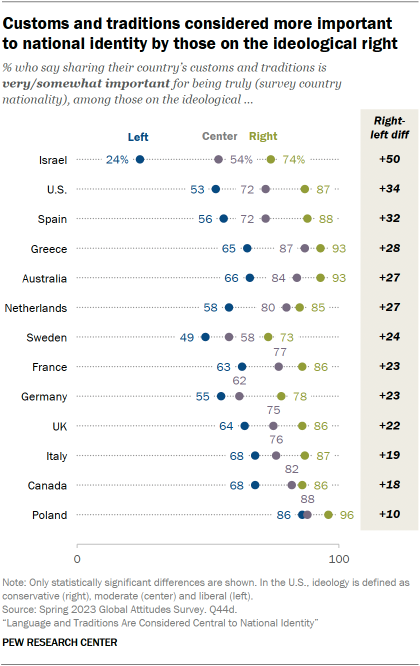
Political ideology is also tied to views of national identity. In many of the countries where we measure respondents’ ideology, those on the right are more likely than those on the left to place importance on shared customs and traditions. The difference is greatest in Israel, where about three-quarters of those on the right hold this view, compared with roughly a quarter of those on the left (74% vs. 24%).

Older adults – those ages 40 and older – are also more likely than their younger counterparts to call these practices important to their national identity in about half the countries surveyed. The largest age difference is in Japan, where 81% of older adults say sharing in traditions is important, compared with 60% of adults under 40.

Changes in views over time

A table showing that Customs and traditions are now considered less important to identity

In seven of the countries where this question was previously asked, the shares who say partaking in these practices is important have decreased significantly since 2016. These include Canada, Japan and several European countries.

Though the shares have decreased, shared customs and traditions remain an important component of national identity in each of these places.

3. Views on the importance of birthplace to national identity

On balance, respondents tend to see being born in their country as an important part of national identity. However, views vary widely across the 23 countries surveyed.

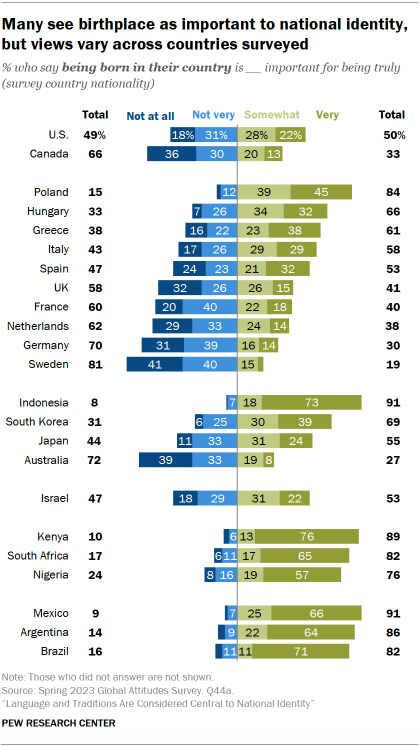
A bar chart showing that Many see birthplace as important to national identity, but views vary across countries surveyed

Majorities in just over half of the countries consider being born there meaningful to national identity. Sentiments in Indonesia, Kenya and Mexico are especially strong, with around nine-in-ten saying being born in their country is important for true belonging. In fact, two-thirds or more cite birthplace as a very important factor of national identity in these countries.

Those in middle-income nations (Argentina, Brazil, Indonesia, Kenya, Mexico, Nigeria and South Africa) are especially likely to say being born in their country is very important: A median of 66% say this across the seven middle-income countries surveyed. Overall, nations with lower GDP per capita tend to place greater importance on birthplace as a key element of national identity.

However, not all feel that birthplace is an important aspect of nationality: Majorities in about a third of the countries surveyed say birthplace is not important. Swedes are the most likely to express this view, with 81% saying being born in Sweden is not very or not at all important for being truly Swedish. In Israel, Spain and the U.S., people say this is and is not important in about equal measures.

Migrant populations and the importance of birthplace

Nations where immigrants make up a smaller share of the population tend to see birthplace as a more important component of national identity, and countries with a greater share of immigrants are more willing to accept those born outside of the country as true nationals.

Scatter plot comparing the share who say being born in the country is important for being a true national and the percent of the population that are international migrants for each country. Countries with higher shares of international migrants see birthplace as less important.

In Indonesia and Mexico, for example, where 91% say being born in the country is important for true belonging, immigrants make up less than 1% of the population. Conversely, immigrants make up about a fifth of the population in Canada, where only 33% consider birthplace important to being truly Canadian.

Who is most likely to see birthplace as important to national identity?

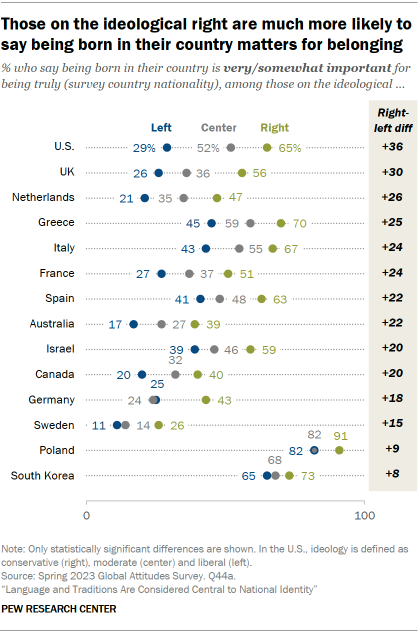
A dot plot showing that Those on the ideological right are much more likely to say being born in their country matters for belonging

When thinking about the importance of birthplace, there are stark divisions along ideological lines. In almost all the countries where we asked about respondents’ ideological affiliations, birthplace is much more important to those on the right than on the left. Large double-digit differences exist in 12 countries.

Ideological differences are particularly wide in the U.S., where about two-in-three conservatives say being born in the U.S. is important to being truly American, compared with less than three-in-ten liberals who say the same.

Age also plays a role: In about half the countries surveyed, older adults are more likely than younger adults to cite birthplace as an important component of national identity. In Japan, for example, 61% of adults ages 40 or older believe it is important for being truly Japanese, while only 36% of adults ages 18 to 39 say the same.

Views on this question are also tied to religious identity. In most countries, those who identify as part of the primary religion are somewhat more likely than those who don’t to consider birthplace important. This contrast is most visible in Greece, where members of the primary religion – Christians – are more than twice as likely as non-Christians to say birthplace is important (66% vs. 32%).

In around two-thirds of the countries surveyed, birthplace tends to be more important to both lower-income individuals and those with less education.

Changes in views over time

A table showing that Birthplace is considered less important to identity now

Shifts in opinions are mixed, since this question was last asked in 2020 in some countries and 2016 in others. However, there are a few notable exceptions:

  • Since 2016, Japanese and Italians have become 22 and 21 percentage points less likely, respectively, to say being born in their country matters. Significant decreases also occurred in Canada, France, Greece, Hungary and the UK.
  • This question was asked again in 2020 in France, Germany and the UK. In all those nations, the share of the public who believe it is important to be born in the country has increased somewhat over the past three years.

4. Views on the importance of religion to national identity

Across the 21 countries where we asked this question, the role of religion in national identity varies widely by country. Majorities in 12 countries – most of which are high-income – say being part of the country’s main religious group is not an important piece of national identity. In the other nine countries where we asked this question – mostly middle-income nations – majorities say the opposite. (For more on which religion was asked about in each country, refer to Appendix C.)

A bar chart showing that the Importance that publics place on religion as a part of national identity varies widely

Among the publics who do prioritize religion as a part of their national identity are Brazil, Indonesia, Israel, Kenya, Nigeria and South Africa, where seven-in-ten or more share this opinion. And in Indonesia, Kenya and Nigeria, about three-quarters call the primary religion very important to their national identity.

In Nigeria, where there are roughly equal shares of Muslims and Christians, all respondents were asked two separate questions – one on the importance of being Muslim and another on the importance of being Christian. About eight-in-ten say belonging to one of the country’s two most common religions is very important to being truly Nigerian.

About three-quarters or more in Australia, France, Germany, the Netherlands, Spain and Sweden say that being a member of their country’s predominant religious group is not an important factor in their national identity. This includes a 59% majority of Swedes who say that being Christian – the most common religion in Sweden – is not at all important to Swedish identity.

Views by religion

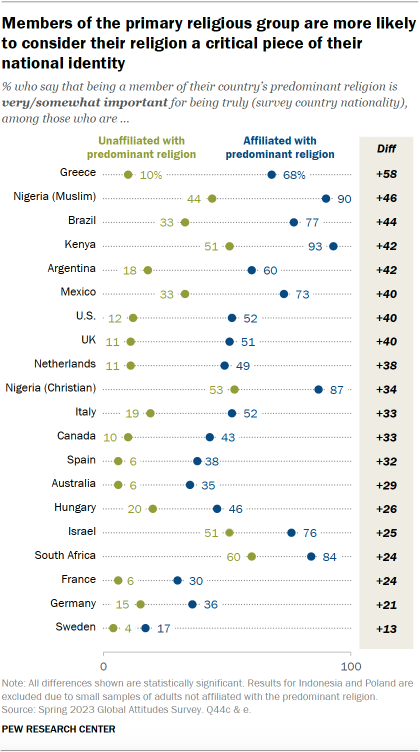
Those who belong to the main religious group in their country – whether that be Catholics in Italy or Muslims in Indonesia – are more inclined to see that religion as a key part of their national identity than those who do not identify with said religion.

A dot plot showing that Members of the primary religious group are more likely to consider their religion a critical piece of their national identity

In more than half the countries surveyed, just two-in-ten or fewer among those who do not identify with the religion in question see that religion as a key piece of their national identity. Take Argentina, for example, where 60% of adults who are Catholic say that being Catholic is important to being truly Argentine. Just 18% of those who are another religion or not religious at all agree.

In Nigeria, where all respondents were asked separate questions on the importance of being Christian and being Muslim, the pattern is similar: Muslim Nigerians are 46 percentage points more likely than those with other religious affiliations to say being Muslim is important to being a true Nigerian, while Christian Nigerians are 34 points more likely to say the same of Christianity.

Who is most likely to see religion as important to national identity?

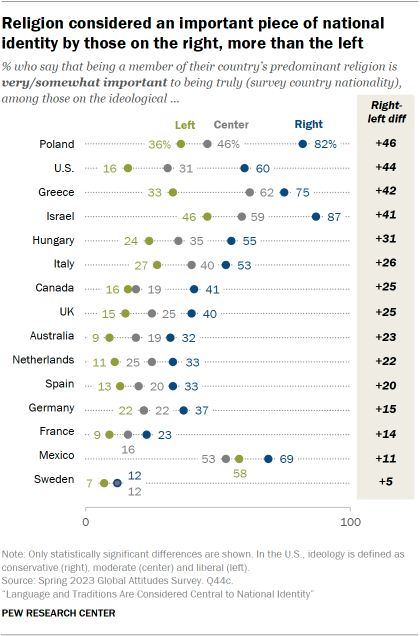
A dot plot showing that Religion is considered an important piece of national identity by those on the right, more than the left

Age is another demographic indicator tied to views of religion’s role in national identity. In most countries surveyed, older adults – those ages 40 and older – place greater importance on religion as a part of their national identity than their younger counterparts do. For example, 79% of Brazilians ages 40 and older say being Christian is important to their national identity, while 59% of adults under 40 agree.

Those on the ideological right are also more likely than those on the left to say that being part of their country’s main religion is important for being a true national. Take the U.S. as an example: 60% of conservatives say being Christian is important to American identity, but just 16% of liberals agree. (In the U.S., 85% of conservatives are Christian, compared with 52% of liberals.) This pattern exists in nearly every country where we can measure both ideology and the importance of religion.

And in most countries surveyed, those who make less than the median income and those with less education place greater importance on religion as a part of their national identity.

Acknowledgments

This report is a collaborative effort based on the input and analysis of the following individuals.

Christine Huang, Research Associate
Laura Clancy, Research Analyst    
Sarah Austin, Research Assistant

Laverne Acheampong, Administrative Associate
Dorene Asare-Marfo, Panel Manager
Janakee Chavda, Assistant Digital Producer
Moira Fagan, Research Associate
Janell Fetterolf, Senior Researcher
Sneha Gubbala, Research Assistant
Anna Jackson, Editorial Assistant
David Kent, Senior Copy Editor
Hannah Klein, Senior Communications Manager
Gar Meng Leong, Communications Manager
Carolyn Lau, International Research Methodologist
Jordan Lippert, Research Assistant
John Carlo Mandapat, Information Graphics Designer
Patrick Moynihan, Associate Director, International Research Methods
Georgina Pizzolitto, Research Methodologist
Jacob Poushter, Associate Director, Global Attitudes Research
Laura Silver, Associate Director, Global Attitudes Research
Sofi Sinozich, International Research Methodologist
Maria Smerkovich, Research Associate
Richard Wike, Director, Global Attitudes Research

Appendix A: National identity index

We created a scale to examine how the boundaries of national identity are viewed at a country level. The index combines responses for the four dimensions of national identity included in the survey: being born in the country, being able to speak the country’s most common language, sharing the nation’s customs and traditions, and being a member of the country’s main religion.

Stacked bar chart showing national identity index scores for 24 countries. Indonesia has the highest score, and Sweden has the lowest.

Each dimension receives a score from 1 (indicating the respondent considers the dimension not at all important) to 4 (indicating the respondent considers it very important). The mean rating for all dimensions is taken for each respondent to create an index ranging from 1 to 4, where a higher score on the scale indicates that more dimensions are considered essential parts of national identity.

Respondents were only asked about a subset of the dimensions in some countries, and the index scores are calculated using only the dimensions that were asked of the respondent. Those in Nigeria and South Africa were not asked about being able to speak the country’s most common language, and those in Japan and South Korea were not asked about being a member of the country’s predominant religion.

Respondents in Nigeria were asked, separately, about the importance of being members of the country’s two primary religions: Islam and Christianity. The index scores were calculated using the religion that received the highest score. For example, if a respondent felt it was somewhat important to be Muslim but not at all important to be Christian to be truly Nigerian, they would be coded as seeing religion as somewhat important for national identity based on their higher score for Islam.

Scores were only calculated for respondents who provided substantive answers to at least three dimensions of national identity. In countries where only three dimensions were measured, respondents who did not provide a response for all were excluded from the index. Our analysis reports the mean score for each country. The overall average for all valid responses is 2.97.

Indonesia has the highest score on the index (3.72) and sees the greatest number of dimensions as important for belonging to the country. Most Indonesians say partaking in the country’s traditions, being able to speak the country’s primary language, having been born in the country and being part of the country’s main religion are at least somewhat important for being a true national. Sweden sits on the other side of the spectrum with the lowest score on the index (2.37). Swedes are the least likely to consider having been born in the country or sharing the country’s main religion as important aspects of their national identity.

Appendix B: Country-specific language

Appendix C: Country-specific religion

Methodology

About Pew Research Center’s Spring 2023 Global Attitudes Survey

Results for the survey are based on telephone, face-to-face and online interviews conducted under the direction of Gallup, Kantar Public, Langer Research Associates and Social Research Centre. The results are based on national samples, unless otherwise noted. Here are more details about our international survey methodology and country-specific sample designs. Results for the U.S. survey are based on data from the American Trends Panel.

The American Trends Panel survey methodology

Overview

The American Trends Panel (ATP), created by Pew Research Center, is a nationally representative panel of randomly selected U.S. adults. Panelists participate via self-administered web surveys. Panelists who do not have internet access at home are provided with a tablet and wireless internet connection. Interviews are conducted in both English and Spanish. The panel is being managed by Ipsos.

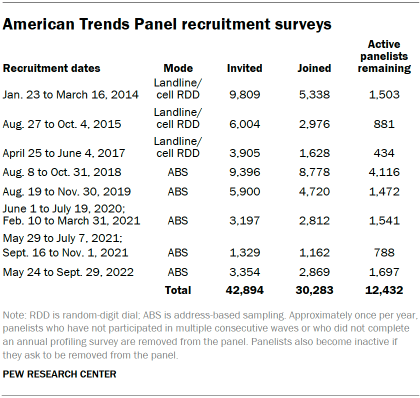
A table showing American Trends Panel recruitment surveys

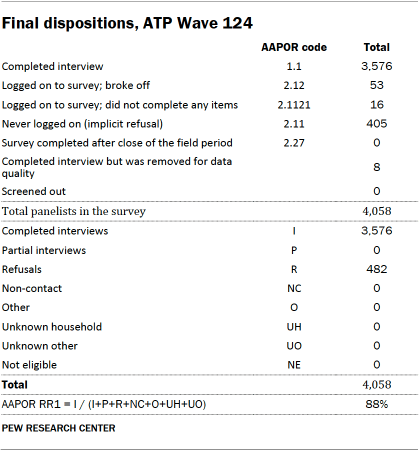
Data in this report is drawn from ATP Wave 124, conducted from March 20 to March 26, 2023, and includes an oversample of Hispanic men, non-Hispanic Black men and non-Hispanic Asian adults to provide more precise estimates of the opinions and experiences of these smaller demographic subgroups. These oversampled groups are weighted back to reflect their correct proportions in the population. A total of 3,576 panelists responded out of 4,058 who were sampled, for a response rate of 88%. The cumulative response rate accounting for nonresponse to the recruitment surveys and attrition is 4%. The break-off rate among panelists who logged on to the survey and completed at least one item is 1%. The margin of sampling error for the full sample of 3,576 respondents is plus or minus 2.0 percentage points.

Panel recruitment

The ATP was created in 2014, with the first cohort of panelists invited to join the panel at the end of a large, national, landline and cellphone random-digit-dial survey that was conducted in both English and Spanish. Two additional recruitments were conducted using the same method in 2015 and 2017, respectively. Across these three surveys, a total of 19,718 adults were invited to join the ATP, of whom 9,942 (50%) agreed to participate.

In August 2018, the ATP switched from telephone to address-based recruitment. Invitations were sent to a stratified, random sample of households selected from the U.S. Postal Service’s Delivery Sequence File. Sampled households receive mailings asking a randomly selected adult to complete a survey online. A question at the end of the survey asks if the respondent is willing to join the ATP. In 2020 and 2021 another stage was added to the recruitment. Households that did not respond to the online survey were sent a paper version of the questionnaire, $5 and a postage-paid return envelope. A subset of the adults who returned the paper version of the survey were invited to join the ATP. This subset of adults received a follow-up mailing with a $10 pre-incentive and invitation to join the ATP.

Across the five address-based recruitments, a total of 23,176 adults were invited to join the ATP, of whom 20,341 agreed to join the panel and completed an initial profile survey. In each household, one adult was selected and asked to go online to complete a survey, at the end of which they were invited to join the panel. Of the 30,283 individuals who have ever joined the ATP, 12,432 remained active panelists and continued to receive survey invitations at the time this survey was conducted.

The U.S. Postal Service’s Delivery Sequence File has been estimated to cover as much as 98% of the population, although some studies suggest that the coverage could be in the low 90% range.1 The American Trends Panel never uses breakout routers or chains that direct respondents to additional surveys.

Sample design

The overall target population for this survey was non-institutionalized persons ages 18 and older living in the U.S., including Alaska and Hawaii. It featured a stratified random sample from the ATP in which Hispanic men, non-Hispanic Black men and non-Hispanic Asian adults were selected with certainty. The remaining panelists were sampled at rates designed to ensure that the share of respondents in each stratum is proportional to its share of the U.S. adult population to the greatest extent possible. Respondent weights are adjusted to account for differential probabilities of selection as described in the Weighting section below.

Questionnaire development and testing

The questionnaire was developed by Pew Research Center in consultation with Ipsos. The web program was rigorously tested on both PC and mobile devices by the Ipsos project management team and Pew Research Center researchers. The Ipsos project management team also populated test data that was analyzed in SPSS to ensure the logic and randomizations were working as intended before launching the survey.

Incentives

All respondents were offered a post-paid incentive for their participation. Respondents could choose to receive the post-paid incentive in the form of a check or a gift code to Amazon.com or could choose to decline the incentive. Incentive amounts ranged from $5 to $20 depending on whether the respondent belongs to a part of the population that is harder or easier to reach. Differential incentive amounts were designed to increase panel survey participation among groups that traditionally have low survey response propensities.

Data collection protocol

The data collection field period for this survey was March 20 to March 26, 2023. Postcard notifications were mailed to all ATP panelists with a known residential address on March 20. 

A table showing Invitation and reminder dates for ATP Wave 124

Invitations were sent out in two separate launches: soft launch and full launch. Sixty panelists were included in the soft launch, which began with an initial invitation sent on March 20. The ATP panelists chosen for the initial soft launch were known responders who had completed previous ATP surveys within one day of receiving their invitation. All remaining English- and Spanish-speaking sampled panelists were included in the full launch and were sent an invitation on March 21.

All panelists with an email address received an email invitation and up to two email reminders if they did not respond to the survey. All ATP panelists who consented to SMS messages received an SMS invitation and up to two SMS reminders.

Data quality checks

To ensure high-quality data, the Center’s researchers performed data quality checks to identify any respondents showing clear patterns of satisficing. This includes checking for very high rates of leaving questions blank, as well as always selecting the first or last answer presented. As a result of this checking, eight ATP respondents were removed from the survey dataset prior to weighting and analysis.

Weighting

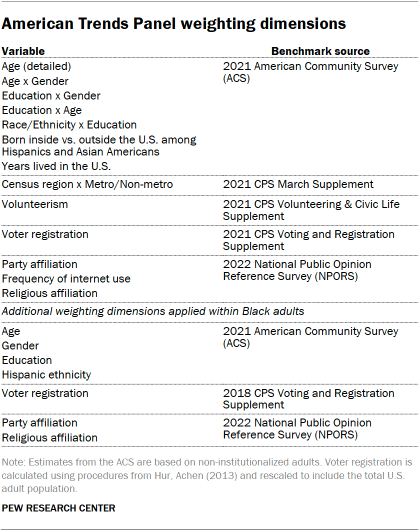
A table showing American Trends Panel weighting dimensions

The ATP data is weighted in a multistep process that accounts for multiple stages of sampling and nonresponse that occur at different points in the survey process. First, each panelist begins with a base weight that reflects their probability of selection for their initial recruitment survey. These weights are then rescaled and adjusted to account for changes in the design of ATP recruitment surveys from year to year. Finally, the weights are calibrated to align with the population benchmarks in the accompanying table to correct for nonresponse to recruitment surveys and panel attrition. If only a subsample of panelists are invited to participate in the wave, this weight is adjusted to account for any differential probabilities of selection.

Among the panelists who completed the survey, this weight is then calibrated again to align with the population benchmarks identified in the accompanying table and trimmed at the 1st and 99th percentiles to reduce the loss in precision stemming from variance in the weights. Sampling errors and tests of statistical significance take into account the effect of weighting.

The following table shows the unweighted sample sizes and the error attributable to sampling that would be expected at the 95% level of confidence for different groups in the survey.

A table showing Sample sizes and margins of error for ATP Wave 124

Sample sizes and sampling errors for other subgroups are available upon request. In addition to sampling error, one should bear in mind that question wording and practical difficulties in conducting surveys can introduce error or bias into the findings of opinion polls.

Dispositions and response rates

A table showing Final dispositions for ATP Wave 124
A table showing Cumulative response rate as of ATP Wave 124

© Pew Research Center, 2023