Pew Research Center

FOR RELEASE JULY 19, 2023

Most Asian Americans View Their Ancestral Homelands Favorably, Except Chinese Americans

A majority view the U.S. positively and see it as the world's leading economic power of the next decade

BY Neil G. Ruiz, Carolyne Im, Christine Huang and Laura Silver

FOR MEDIA OR OTHER INQUIRIES:

Communications Department
202.419.4372
www.pewresearch.org

RECOMMENDED CITATION

Pew Research Center, July 2023, "Most Asian Americans View Their Ancestral Homelands Favorably, Except Chinese Americans"

About Pew Research Center

Pew Research Center is a nonpartisan, nonadvocacy fact tank that informs the public about the issues, attitudes and trends shaping the world. It does not take policy positions. The Center conducts public opinion polling, demographic research, computational social science research and other data-driven research. It studies politics and policy; news habits and media; the internet and technology; religion; race and ethnicity; international affairs; social, demographic and economic trends; science; research methodology and data science; and immigration and migration. Pew Research Center is a subsidiary of The Pew Charitable Trusts, its primary funder.

© Pew Research Center 2026

Table of contents

  • About Pew Research Center
  • Most Asian Americans View Their Ancestral Homelands Favorably, Except Chinese Americans
  • 1. Chinese Americans’ views of China and other places
  • 2. Filipino Americans’ views of the Philippines and other places
  • 3. Indian Americans’ views of India and other places
  • 4. Japanese Americans’ views of Japan and other places
  • 5. Korean Americans’ views of South Korea and other places
  • 6. Taiwanese Americans’ views of Taiwan and other places
  • 7. Vietnamese Americans’ views of Vietnam and other places
  • Acknowledgments
  • Methodology
  • Appendix: How we defined the survey’s Taiwanese sample

Most Asian Americans View Their Ancestral Homelands Favorably, Except Chinese Americans

A majority view the U.S. positively and see it as the world's leading economic power of the next decade

How we did this

Pew Research Center conducted this analysis to understand Asian Americans’ views of their ancestral homelands and the U.S. It highlights the attitudes and opinions on global affairs of all U.S. Asian adults as well as the specific views of Chinese, Filipino, Indian, Japanese, Korean, Taiwanese and Vietnamese adults in the U.S. This report is the latest in the Center’s in-depth analyses of public opinion among Asian Americans. 

The data in this report comes from a nationally representative survey of 7,006 Asian adults that explores the experiences, attitudes and views of Asians living in the U.S. on several topics, including identity, affirmative action and global affairs. The survey sampled U.S. adults who self-identify as Asian, either alone or in combination with other races or Hispanic ethnicity. It was offered in six languages: Chinese (Simplified and Traditional), English, Hindi, Korean, Tagalog and Vietnamese. Responses were collected from July 5, 2022, to Jan. 27, 2023, by Westat on behalf of Pew Research Center.

The Center recruited a large sample to examine the diversity of the U.S. Asian population, with oversamples of Chinese, Filipino, Indian, Korean and Vietnamese populations. These are the five largest origin groups among Asian Americans. The survey also includes a large enough sample of self-identified Japanese adults to make findings about them reportable. Findings for Taiwanese adults are likewise reportable and accompanied with margins of sampling error in charts. In this report, the seven Asian origin groups highlighted include those who identify with one Asian origin only, either alone or in combination with a non-Asian race or ethnicity. Together, these seven groups constitute 81% of all U.S. Asian adults, according to a Pew Research Center analysis of the Census Bureau’s 2021 American Community Survey (ACS). For more information on how we defined our sample of Taiwanese adults – and the other Asian origin groups – refer to the appendix.

Survey respondents were drawn from a national sample of residential mailing addresses, which included addresses from all 50 states and the District of Columbia. Specialized surnames list frames maintained by the Marketing Systems Group were used to supplement the sample. Those eligible to complete the survey were offered the opportunity to do so online or by mail with a paper questionnaire. For details, refer to the methodology. For questions used in this analysis, refer to the topline questionnaire.

Survey results were complemented by 66 pre-survey focus groups of Asian adults, conducted from Aug. 4 to Oct. 14, 2021, with 264 recruited participants from 18 Asian origin groups. Focus group discussions were conducted in 18 different languages and moderated by members of their origin groups. In the focus groups, participants were asked about their opinions of the places they trace their heritage to, and some quotations are used in this report. Quotations are not necessarily representative of the majority opinion in any particular group or in the United States. Quotations may have been edited for grammar, spelling and clarity.

Pew Research Center is a subsidiary of The Pew Charitable Trusts, its primary funder. The Center’s Asian American portfolio was funded by The Pew Charitable Trusts, with generous support from The Asian American Foundation; Chan Zuckerberg Initiative DAF, an advised fund of the Silicon Valley Community Foundation; the Robert Wood Johnson Foundation; the Henry Luce Foundation; the Doris Duke Foundation; The Wallace H. Coulter Foundation; The Dirk and Charlene Kabcenell Foundation; The Long Family Foundation; Lu-Hebert Fund; Gee Family Foundation; Joseph Cotchett; the Julian Abdey and Sabrina Moyle Charitable Fund; and Nanci Nishimura.

We would also like to thank the Leaders Forum for its thought leadership and valuable assistance in helping make this survey possible.

The strategic communications campaign used to promote the research was made possible with generous support from the Doris Duke Foundation.

Terminology

The terms Asians, U.S. Asian adults and Asian Americans are used interchangeably throughout this report to refer to U.S. adults who self-identify as Asian, either alone or in combination with other races or Hispanic identity.

Asian origins and origin group labels, such as Chinese and Chinese origin, are used interchangeably in this report for findings for Asian origin groups, such as Chinese, Filipino, Indian, Japanese, Korean, Taiwanese or Vietnamese. Origin groups in this report include those who report being one Asian origin only, either alone or in combination with a non-Asian race or ethnicity. For this report, Chinese adults do not include those who self-identify as Taiwanese. For more information on how we defined the Taiwanese sample, refer to the appendix.

Ancestral homeland is used in this report to refer to the place in Asia that people trace their ancestry or heritage to, including the place they are from or the place their family or ancestors are from. It is used interchangeably with homeland, homeland of their ancestors, homeland of their heritage, place of origin and place they trace their heritage to throughout this report.

To make comparisons between a specific Asian origin group and the rest of the U.S. Asian population, other Asian adults is used in this report to refer to Asian adults who report being some other Asian origin than the one highlighted. This includes those who report being another Asian origin, either alone or in combination with a non-Asian race or ethnicity, or two or more Asian origins.

Immigrants in this report are people who were not U.S. citizens at birth – in other words, those born outside the U.S., Puerto Rico or other U.S. territories to parents who are not U.S. citizens. Immigrant, foreign born and born abroad are used interchangeably to refer to this group.  

Naturalized citizens are immigrants who are lawful permanent residents who have fulfilled the length of stay and other requirements to become U.S. citizens and who have taken the oath of citizenship.

U.S. born refers to people born in the 50 U.S. states or the District of Columbia, Puerto Rico or other U.S. territories.

Primary language is a composite measure based on self-described assessments of speaking and reading abilities. People who are origin language dominant are more proficient in the Asian origin language of their family or ancestors than in English (i.e., they speak and read their Asian origin language “very well” or “pretty well” but rate their ability to speak and read English lower). Bilingual refers to those who are proficient in both English and their Asian origin language. People who are English dominant are more proficient in English than in their Asian origin language.

Throughout this report, the phrases Democrats and Democratic leaners and Democrats refer to respondents who identify politically with the Democratic Party or who are independent or identify with some other party but lean toward the Democratic Party. Similarly, the phrases Republicans and Republican leaners and Republicans both refer to respondents who identify politically with the Republican Party or are independent or identify with some other party but lean toward the Republican Party.

The terms Republican Party and GOP are used interchangeably in this report.

Comparing Asian Americans’ views with those of the American public

In separate surveys in 2023, Pew Research Center measured U.S. adults’ attitudes toward China, India, Taiwan, the U.S. and other countries. And in past years, the Center has also evaluated U.S. adults’ views of Japan and other Asian countries.

Broadly speaking, in 2023, the views of Asian Americans are similar to those of the American public. For example, 20% of Asian Americans have a favorable view of China, as does 14% of the American public. By contrast, around three-quarters of both groups see the U.S. in a positive light, and majorities of both have favorable views of Taiwan.

Still, there are some differences between how Asian Americans see certain places and how the general public does – related both to differences in who was surveyed (the sample) and how the question was asked. In particular, Asian Americans were asked about their opinion using a five-point scale that allowed them to say they had very favorable, somewhat favorable, neither favorable nor unfavorable, somewhat unfavorable or very unfavorable views. The general public, on the other hand, was given a four-point scale that did not have the option of saying that they had neither a favorable nor unfavorable opinion. For more on how views of foreign countries may differ based on the inclusion of a neutral option, read our post, “What different survey modes and question types can tell us about Americans’ views of China.”

Pew Research Center has a long history of measuring Americans’ views of the United States, China and other countries, but less is known about Asian Americans’ views of these countries. Amid the American public’s increasingly negative views of China and rising concern over tensions between mainland China and Taiwan, how do Asian Americans feel about the homelands in Asia to which they trace their heritage, as well as about the U.S., China and elsewhere?

A bar chart showing Asian Americans’ favorability of different places. Asian adults in the U.S. have majority favorable views of the U.S., Japan, South Korea and Taiwan; mostly neutral views of the Philippines, Vietnam and India; and majority unfavorable views of China.

Jump to:

  • Chinese Americans’ views of China and other places
  • Filipino Americans’ views of the Philippines and other places
  • Indian Americans’ views of India and other places
  • Japanese Americans’ views of Japan and other places
  • Korean Americans’ views of South Korea and other places
  • Taiwanese Americans’ views of Taiwan and other places
  • Vietnamese Americans’ views of Vietnam and other places

Around three-quarters of Asian Americans (78%) have a favorable view of the United States – including 44% who report very favorable views of the country. A majority also say they have positive views of Japan (68%), South Korea (62%) and Taiwan (56%), according to a new analysis of a multilingual, nationally representative survey of Asian American adults conducted from July 5, 2022, to Jan. 27, 2023.

Opinion of Vietnam, the Philippines and India is more mixed. In the case of both Vietnam and the Philippines, 37% of Asian adults have positive views, while around half say they have neither favorable nor unfavorable views, and only around one-in-ten see the countries in a negative light. Meanwhile, 33% of Asian Americans have favorable views of India, 41% report a neutral view and 23% view it unfavorably.

Asian Americans have predominantly negative views of China. Only 20% of Asian adults have a favorable opinion of China, compared with 52% who have an unfavorable opinion and 26% with neither a favorable nor unfavorable opinion.

Asian Americans have largely favorable views of their ancestral homelands
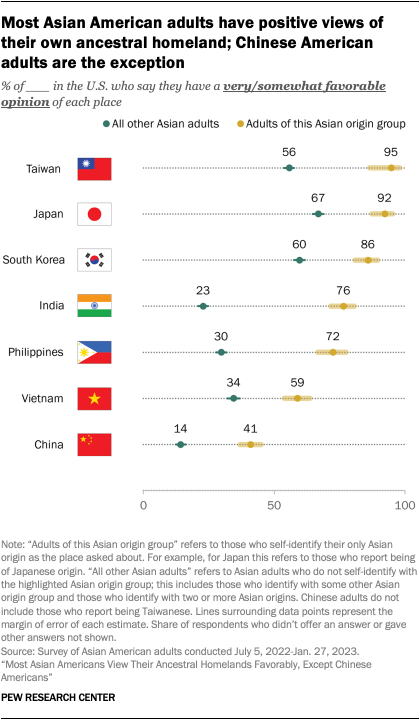
A dot plot showing that most Asian American adults have positive views of the homelands of their ancestors. Taiwanese, Japanese, Korean, Indian, Filipino and Vietnamese adults have majority favorable views of their ancestral homelands. Only 41% of Chinese American adults have a favorable view of China.

Overall, Asian Americans have positive views of the places they trace their heritage to. About nine-in-ten Taiwanese and Japanese Americans say their opinion of their own ancestral homeland is very or somewhat favorable, as do large majorities of Korean, Indian and Filipino adults. A smaller majority of Vietnamese Americans say they have a favorable view of Vietnam.

By contrast, Chinese Americans have more mixed views of China.1 Fewer than half say they hold a favorable opinion. Still, a larger share of Chinese Americans have a positive opinion of China than other Asian adults,2 41% vs. 14%.

Origin groups also see their ancestral homelands much more favorably than other Asian adults. Among the seven origin groups highlighted in this report, the difference is largest on views of India: 76% of Indian adults have a favorable opinion of India, compared with 23% of other Asian adults, a gap of 53 percentage points. The gap is smallest on views of Vietnam, though there is still a sizable difference: 59% of Vietnamese adults have a favorable view versus 34% of other Asian adults, a 25-point difference.

Chinese and Vietnamese adults are the only origin groups in this analysis to express more favorable views of other places in Asia than their homelands. Chinese adults see Japan, Taiwan and South Korea more favorably than they do China. Vietnamese adults see Japan more favorably than they do Vietnam.

Chinese Americans favor Taiwan over China

A bar chart showing that among Chinese Americans, immigrants are more likely than U.S. born to have a favorable view of China, and less likely to have a favorable view of Taiwan.

Amid rising tensions between mainland China and Taiwan, Chinese Americans’ favorability of Taiwan over China is particularly notable: 62% of Chinese Americans say they have a favorable view of Taiwan, higher than the share that says the same about China (41%).

Even so, Chinese Americans’ views of China and Taiwan vary depending on where they were born and, for immigrants, how long they have lived in the United States:

  • Chinese immigrant adults are more likely than U.S.-born Chinese adults to have a favorable view of China (45% vs. 25%).
  • On their views of Taiwan, Chinese immigrants are somewhat less likely than those born in the U.S. to have a favorable opinion (60% vs. 70%).
Favorability of Asian Americans’ ancestral homelands varies across some origin groups  

Asian origin groups differ in their assessments of some of the places asked about in the survey. Some groups stand out for their general positivity toward most places, as in the case of Filipinos. Others vary widely depending on which specific place is asked about. For instance: 

  • Asian Americans overall have majority favorable views of Japan. But Korean Americans stand out: Only 36% have positive views of Japan.
  • By comparison, Japanese Americans’ views of South Korea are more positive, at 53%. Still, Japanese and Chinese Americans’ evaluations of South Korea are slightly less favorable than the views among other origin groups – especially Filipino adults.
  • Indian adults in the U.S. are around three times as likely as almost any other Asian origin group to have favorable views of India. While 76% of Indian Americans have favorable views of India, the next highest ratings come from Filipino Americans – only 31% of whom agree. Ratings of India are particularly negative among Chinese and Korean adults in the U.S.
  • Few Asian adults overall have favorable views of China, though there is some variation across origin groups. While 19% of Filipino adults in the U.S. have a favorable opinion of China, smaller shares of Indian (10%), Korean (8%) and Taiwanese adults (2%) say the same.3
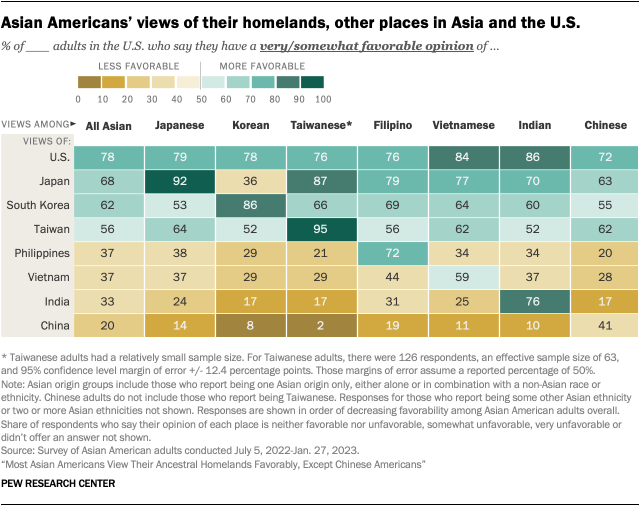
A heat map showing the comparative shares of Asian adults overall, Japanese, Korean, Taiwanese, Filipino, Vietnamese, Indian and Chinese adults who say they have a very/somewhat favorable opinion of the U.S., Japan, South Korea, Taiwan, the Philippines, Vietnam, India and China.

Favorability varies across nativity, education and other demographic factors

Foreign-born and U.S.-born Asian Americans differ in their views of certain places:

  • In most cases, Asian immigrants express more positive views of the places they trace their heritage to than U.S.-born Asian adults.
  • Foreign-born Asian adults have much more favorable views of the United States than those born in the U.S. (83% vs. 64%).
  • Asian immigrants also have slightly more positive views of India and China than U.S.-born Asian adults. There are no differences between foreign- and U.S.-born Asian Americans when it comes to any of the other places asked about in the survey.

Asian Americans with higher levels of educational attainment often feel more positively about the places they were asked about than those with lower levels of formal schooling:

  • When it comes to views of India, 42% of those with a postgraduate degree have favorable views of the country, compared with 35% of those with a bachelor’s degree and 27% of those with less formal schooling.
  • The pattern is reversed, though, when it comes to China. Asian Americans with lower levels of education tend to feel more positively about China than those with more education. For example, 17% of those with at least a bachelor’s degree have positive views of China, compared with 23% of those who did not complete college.

Overall, there is little variation in attitudes by party identification. This lack of difference is notable on views toward China. Nearly identical shares of Republican and Democratic Asian Americans see the country positively (20% and 18%, respectively) and negatively (55% and 52%). This departs from trends seen among the general U.S. public: Our past analyses have found that Republicans are more likely than Democrats to hold an unfavorable opinion of China.

Most Asian adults would not move to their ancestral homelands

While Asian adults have largely favorable views of their ancestral homelands, most say they would not move (or, in some cases, move back) there if they had the chance. Nearly three-quarters of Asian adults say this, while 26% say they would.

A bar chart showing that Asian Americans’ interest in moving to their ancestral homelands varies by nativity and time spent in the U.S. 47% of immigrants who have been in the U.S. for less than a decade say they would move there, while only 14% of U.S.-born Asian adults say the same.

Asian immigrants are twice as likely as those who are U.S. born to say they would move to the homelands of their heritage (30% vs. 14%).

Likewise, interest in moving to their homelands is lower among immigrants who have been in the U.S. for a longer time. About half (47%) of Asian immigrants who have been in the U.S. for 10 years or less say they would move to their ancestral homeland, compared with roughly one-in-five (22%) who have been in the U.S. for more than 20 years.

Asian Americans’ response to this question differs somewhat across origin groups. Willingness to move to the places they trace their heritage to ranges from a low of 16% among Chinese Americans to a high of 33% among Indian Americans. And among many origin groups, immigrants are more likely to say that they would move there than those born in the U.S.  

Among the 26% of Asian Americans who say they would move to the homeland of their ancestors, top reasons include proximity to friends or family (36%) and a lower cost of living (22%). Smaller shares also pointed to greater familiarity with the culture, better support for older people and feeling safer there.
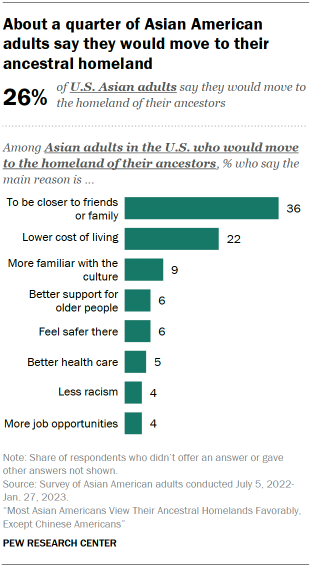
A bar chart showing that among the 26% of Asian American adults who would move to their ancestral homelands, 36% say the main reason they would move is to be closer to friends or family, 22% say they would move for lower cost of living, and smaller shares site other reasons.

The survey also finds the main reasons Asian Americans say they would move to their places of origin varies across some Asian origin groups:4

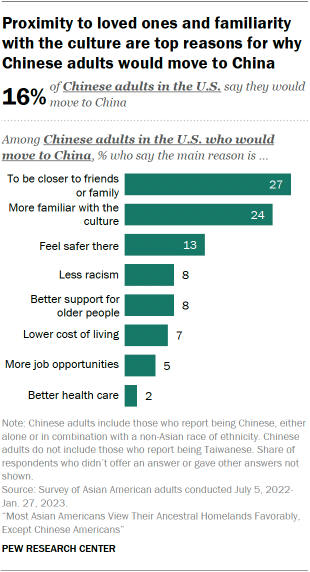
  • Chinese adults who say they would move to China would do so to be closer to family and friends (27%) and because they are more familiar with Chinese culture (24%).
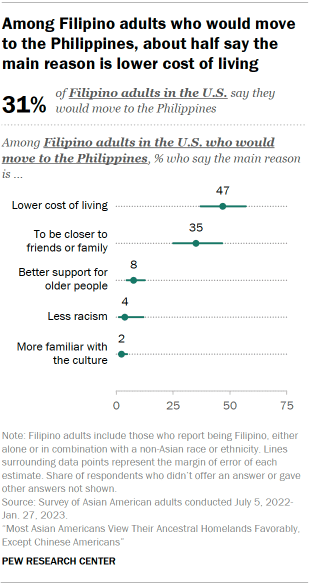
  • Filipino adults who say they would move to the Philippines would do so for the lower cost of living (47%) and to be closer to friends or family (35%).
  • Half of Indian adults who say they would move to India would do so because of its lower cost of living (52%).
  • Korean adults who say they would move to South Korea would do so for better health care (24%) and to be closer to family and friends (22%).
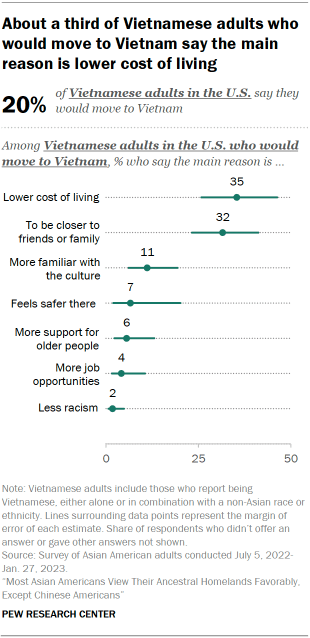
  • Vietnamese adults who say they would move to Vietnam would do so for its lower cost of living (35%) and to be closer to friends and family (32%).

Majority of Asian Americans see the U.S. as the world’s leading economic power in the next decade

About half of Asian Americans (53%) say the United States will be the world’s leading economic power over the next decade. Roughly one-third (36%) say China will be the leading economic power globally in the next 10 years, and much lower shares say the same of India and Japan.
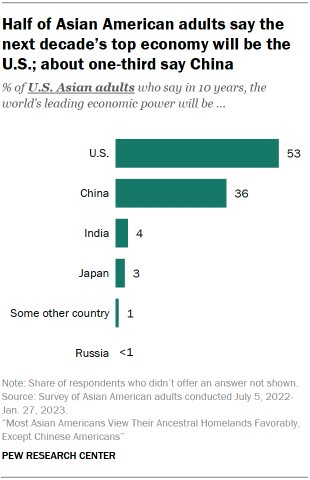
A bar chart showing that 53% of Asian American adults say the U.S. will be the world’s leading economic power in the next 10 years, while 36% say China.

These views are broadly consistent with those of the American public. In a March 2023 survey using a slightly different question asking which of four places – the U.S., China, the EU or Japan – is currently the world’s leading economic power, 48% named the U.S. and 38% China.

Views of the next decade’s top economy vary across place of birth and age:

  • Among Asian immigrants, 57% see the U.S. as the leading economic power, while just 32% say it will be China.
  • U.S.-born Asian adults are roughly divided over whether the U.S. or China will be the top economy (43% vs. 46%).
  • Older Asian Americans are more likely than younger ones to say the U.S. will be the top economy: 62% of Asian adults ages 65 and older name the U.S. as the next decade’s leading economic power, compared with 49% of those under 50.

Views of the world’s leading economic power by Asian origin group

Asian adults are more likely to say the U.S. will be the leading economic power in 10 years than China. Still, origin groups differ in the degree to which they see this pattern.
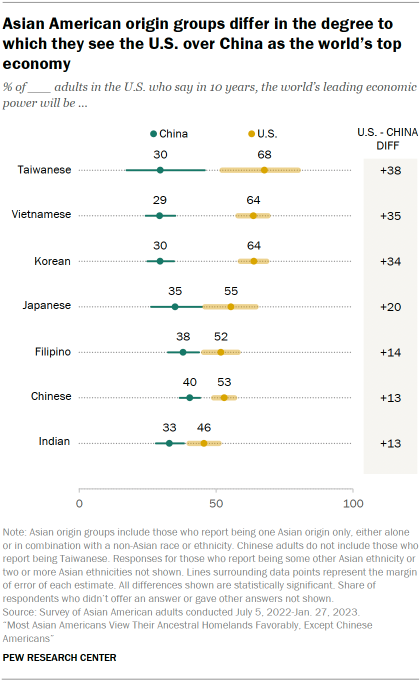
A dot plot showing that across origin groups, Asian Americans are more likely to name the U.S. over China as the leading economic power in the next ten years, but the degree that they say this varies.

For example, Chinese adults are somewhat more divided than most other groups, with 53% naming the U.S. as the top power compared with 40% who name China. This gap of 13 percentage points is much smaller than the gap of 38 points between the U.S. and China among Taiwanese adults, or the gap of 20 points or more among Vietnamese, Korean and Japanese Americans.

Indian adults are also the most likely to say India will be the world’s leading economic power, with 15% holding this view. No more than 2% of any other origin group highlighted in this report say the same.

Japanese (5%) and Filipino (6%) adults are also relatively more likely than most other origin groups to describe Japan as the next decade’s leading economic power than other origin groups – though the absolute share who see Japan this way (3%) still pales in comparison to those who name China or the U.S.

The remainder of this report explores in depth the views of each of the seven origin groups – Chinese, Filipino, Indian, Japanese, Korean, Taiwanese and Vietnamese adults in the U.S.

1. Chinese Americans’ views of China and other places

Chinese Americans view the United States more favorably than any other place asked about in the survey.5 About three-quarters hold a favorable view of it, including about three-in-ten who see the U.S. very favorably. Japan, Taiwan and South Korea are other places that majorities of Chinese Americans see favorably, our survey analysis finds.

About four-in-ten Chinese Americans see China in a positive light, and around a third (35%) see the country unfavorably. Roughly a fifth say they have a neither favorable nor unfavorable view of China. Chinese adults stand out for being one of the few origin groups that rate other Asian places more favorably than their own place of origin – more Chinese Americans say they have positive views of Japan, Taiwan and South Korea than China.

A bar chart showing Chinese American adults’ favorability of different places. Chinese Americans have majority favorable views of the U.S., Japan, Taiwan and South Korea; more neutral views of Vietnam, the Philippines, and India; and split views of China.

On the Philippines, Vietnam and India, Chinese adults generally hold neutral opinions. About half or more say they have a neither favorable nor unfavorable view of each place.

How Chinese Americans’ views differ from those of other Asian Americans

Chinese Americans’ views of the places asked about tend to differ substantially from those of other Asian American adults.6 The difference is greatest when it comes to China, which only 14% of other Asian adults see favorably (compared with 41% of Chinese adults). They are also more likely than other Asian adults to see Taiwan favorably (62% vs. 55%).

Outside of these two places, though, Chinese Americans tend to have less favorable views when compared with other Asian adults. For example, while 42% of other Asian Americans see the Philippines favorably, only 20% of Chinese Americans do.

A bar chart showing that Chinese Americans who have lived in the U.S. for longer are less likely to have a favorable opinion of China and more likely to have a favorable opinion of Taiwan. 25% of U.S.-born Chinese adults have a favorable view of China, compared with 56% of Chinese immigrants who have been in the U.S. for 10 years or less. On views of Taiwan, 70% of U.S.-born Chinese Americans have a favorable opinion, compared with 53% of Chinese immigrants.

More time spent in the U.S. is associated with less favorable views of China, more favorable views of Taiwan

The number of years Chinese Americans have lived in the U.S. is related to how they see China and Taiwan.

On views of China, those who were born in the U.S. are much less likely to hold a positive view of China than those who were born abroad (25% vs. 45%). And, among immigrants, those who have been in the U.S. longer tend to feel much less positively about China than those who immigrated more recently.

When it comes to favorability of Taiwan, U.S.-born Chinese Americans are more likely to see Taiwan favorably than Chinese immigrants (70% vs. 60%).

Chinese Americans mostly uninterested in moving to China

A dot plot showing the share of Chinese American adults who say they would move to China.

Though a plurality of Chinese Americans hold a favorable view of China, few are interested in moving there. About eight-in-ten say they would not move to China, compared with 16% who say they would.

Chinese Americans who are bilingual or whose primary language is a Chinese dialect are somewhat more likely to be interested or willing to move to China than those who are English dominant. While about one-in-five bilingual or Chinese-dominant Chinese Americans say they would ever move to China, only 7% of English-dominant Chinese Americans would ever do the same.

“I have high hopes for the Chinese language. For example, mainland China has become strong in power [recently], so if there are fewer opportunities in the United States, you could still go back to Hong Kong, Taiwan or mainland China. To me, even if we were born here, we ultimately do not really belong here.”

– Immigrant woman of Chinese origin, age 47 (translated from Mandarin)

Among Chinese Americans born outside of the U.S., citizenship status plays a role in how they see moving to China. Noncitizens are much more likely than citizens to say they would move to China.

A bar chart showing among the 16% of Chinese American adults who would move to China, 27% say the main reason they would move there is to be closer to friends or family and 24% say the main reason is because they’re more familiar with the culture.

Likewise, immigrants who have been in the U.S. for longer are less likely to say they would move to China: Whereas less than a fifth of those who have spent more than 10 years in the U.S. express a willingness to move back to China, about a third of those who have been in the U.S. for 10 years or less (36%) would ever move back.

Among Chinese Americans who would move to China, being closer to friends or family and more familiarity with the culture are the most common reasons for considering doing so (about a quarter each). Some 13% say they would feel safer in China, while others point to less racism (8%), better elder care (8%), and lower cost of living (7%) as the primary factor.

“[F]or me, I would not say that it would be better or bad for personal development to stay in the United States, or return to the homeland, but that if this would be what I want, and I am able to make it, that would be good.”

– Immigrant woman of Chinese origin, age 29 (translated from Mandarin)

2. Filipino Americans’ views of the Philippines and other places

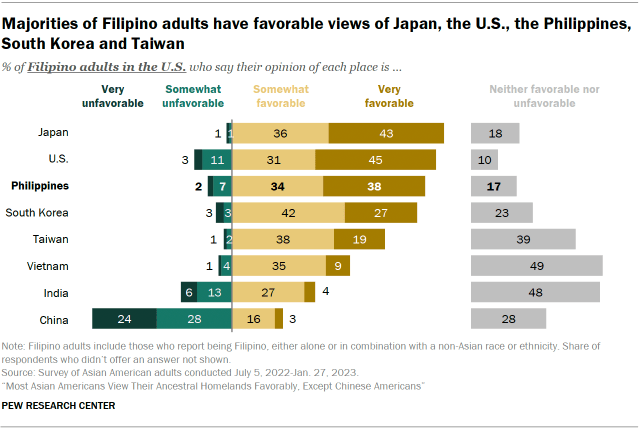
Filipino adults see many places asked about in our survey favorably. About eight-in-ten (79%) hold a favorable view of Japan, including 43% who see it very favorably. Filipino Americans also have largely positive views of the United States, with 76% seeing it in a favorable light.

Filipino immigrants, Republicans and those 50 and older have particularly favorable views of the U.S., with nearly nine-in-ten of each group saying they see the place very or somewhat favorably. 

A bar chart showing Filipino American adults’ favorability of different places. Filipino Americans have majority favorable views of Japan, the U.S., the Philippines, South Korea and Taiwan; more neutral views of Vietnam and India; and majority unfavorable views of China.

“It’s hard to think of having […] America next to my nationality or to my identity because I have gripes about what the U.S. did to the Philippines in the past…. Although I love the opportunity that the U.S. gives me here … there’s still some bitterness. Like when you read about historical accounts that are well researched and you wouldn’t have read just on the internet, it stuck.”

– Immigrant man of Filipino origin, age 32 (translated from Tagalog)

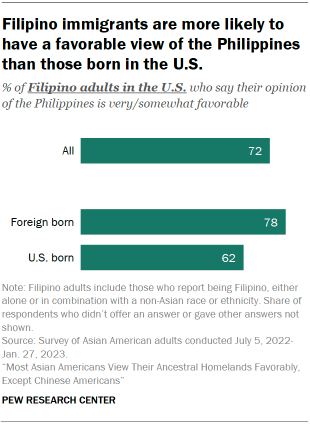
A bar chart showing that 78% of Filipino immigrants adults have a very or somewhat favorable opinion of the Philippines, while 62% of U.S.-born Filipino adults say the same.

A large majority of Filipino adults (72%) see the Philippines favorably. Only 9% say they hold an unfavorable opinion, and about two-in-ten say their opinion of the Philippines is neither favorable nor unfavorable.

Filipino immigrants tend to view the Philippines more positively than those who were born in the United States. Filipino immigrants are much more likely to have a very favorable view of the Philippines than U.S.-born Filipinos (45% vs. 26%). And U.S.-born Filipino Americans are more likely to see the country neutrally (27% vs. 12%).

When it comes to South Korea and Taiwan, a majority of Filipino adults say their opinion of each place is favorable.

About half of Filipino Americans say their opinion of Vietnam and India is neither favorable nor unfavorable. However, views of both places skew more positive than they do negative. For Vietnam, 44% hold a favorable opinion, compared with 5% with an unfavorable one. And for India, 31% view it positively, while 19% view it negatively.

Half of Filipino adults have an unfavorable view of China, with similar shares saying their opinion is very and somewhat unfavorable. On these views, there are some differences by education: Filipino adults with a bachelor’s degree or higher are more likely to have unfavorable views than those with less education.

Compared with other Asian adults,7 Filipino adults tend to have more positive views of the places asked about. They are more than twice as likely as other Asian adults to have a favorable view of the Philippines (72% vs. 30%). Filipino Americans are also more likely to see Japan and Vietnam in a positive light.

Two-thirds of Filipino adults say they would not move to the Philippines, though interest differs by nativity

Though a large majority of Filipino Americans have favorable views of the Philippines, most say they would not move there. Some 67% of Filipino adults say they would not move to the Philippines if they had the chance, while 31% say they would.

A dot plot showing that among the 31% of Filipino adults who would move to the Philippines, 47% say the main reason they would move there is for lower cost of living, and 35% say they would move there to be closer to friends or family.

However, willingness to move to the Philippines varies significantly by place of birth. Filipino immigrants are about four times as likely as U.S.-born Filipino adults to say they would move to the Philippines (43% vs. 10%).

Among those who could see themselves moving to the Philippines, half say the main reason is lower cost of living. About one-third say proximity to loved ones is the main draw, while smaller shares point to better support for older people, less racism and more familiarity with Filipino culture.

“[I]n the Philippines, [the next generation] get Filipino opportunities. If they come here, they’ll get U.S. opportunities. And the scale will be much larger because America is bigger, and it’s a more advanced economy.”

– Immigrant man of Filipino origin, age 51 (translated from Tagalog)

“[Visiting the Philippines] was the biggest culture shock ever. I think … it did give me a new appreciation to be an American just because I saw the disparities and … different social classes, how hard it is to get a job out there…. [B]ut I did see a lot of beautiful nature and I got to see my provinces and all that, you know…. I did take a step back and had to appreciate the life that I do have.”

– U.S.-born woman of Filipino origin, age 27

3. Indian Americans’ views of India and other places

Indian Americans are more likely to have a favorable opinion of the United States than of any other place our survey asked about. Nearly nine-in-ten Indian adults say this, including 56% who have a very favorable view of the U.S.

Roughly three-quarters of Indian adults in the U.S. say their opinion of India is very or somewhat favorable, compared with 5% who offer unfavorable views of the country and 16% who have neither favorable nor unfavorable views. Indian Americans’ views of India are also substantially more positive than other Asians’ views: 76% vs. 23%.8

Though similar shares of U.S.-born Indian adults and Indian immigrants have a favorable opinion of India, those born in the U.S. are more like than those born abroad to say they have a neutral view of the country (31% vs. 13%). And among immigrants, those who are not U.S. citizens are more likely to have favorable views of India than those who are naturalized citizens (87% vs. 73%). 

A bar chart showing Indian American adults’ favorability of different places. Indian Americans have majority favorable views of the U.S., India, Japan, South Korea and Taiwan; more neutral views of Vietnam and the Philippines; and majority unfavorable views of China.

“I would say my relationship with India definitely changed. [When I visited India] when I was younger, … I felt – especially with how coming from the U.S. we were treated, I felt like India was primitive in a lot of ways…. And as I got older, … my view of India was often formed through the White lens of the exotic…. So my relationship has changed dramatically…. [Now when I visit India, I try] to absorb the culture, and understand it, and kind of in some ways deconstruct all of these myths that I’ve had built up in my head. That’s been kind of in many ways put upon me either through education or just the society I exist in.”

– U.S.-born woman of Indian origin, age 43

Most Indian adults also see Japan (70%) and South Korea (60%) in a favorable light. About half say they have a favorable opinion of Taiwan.

When asked about their opinion of Vietnam and the Philippines, about half of Indian Americans say they have neither a favorable nor unfavorable opinion of each country (52% each). Among those who do indicate favorability, views skew more positive than negative: 37% of Indian adults say they view Vietnam favorably, compared with only 5% who view it unfavorably. And 34% say they have a positive opinion of the Philippines, compared with 9% who say the opposite.

Indian Americans’ views of China are much more negative. Some 59% of Indian adults say they have an unfavorable opinion of China, including 32% who report very unfavorable opinions of the country. Overall, Indian adults are 12 percentage points less likely than other Asian adults to say their opinion of China is favorable.

Indian Americans’ views vary by gender and partisan identity

There are some differences in Indian Americans’ views by gender. On views of Taiwan and Vietnam, men are more likely than women to have favorable views of each country. Views of China are an exception to this pattern: A higher share of Indian men than women have an unfavorable opinion (66% vs. 53%). This stems from Indian men being more likely to have a very unfavorable opinion of China than Indian women (40% vs. 23%).

Partisan identity also colors how Indian adults view some places. Indian adults who are Democrats or lean to the Democratic Party are more likely than Indian Republicans or Republican leaners to have favorable views of South Korea and Taiwan.

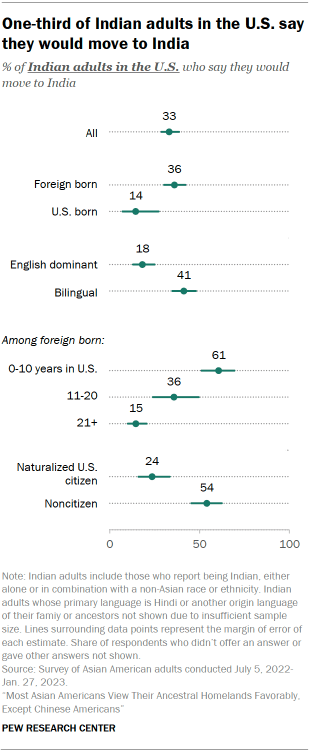
A dot plot showing the share of Indian adults in the U.S. who say they would move to India.

Interest in moving to India differs across time spent in the U.S.

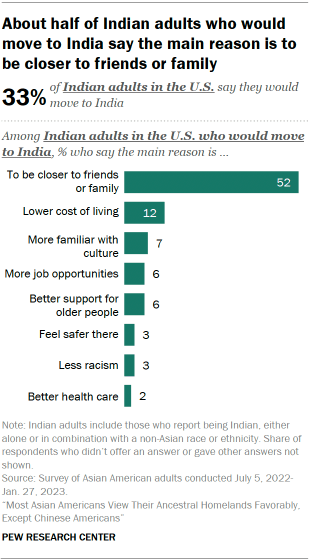
When asked whether they would ever move to India, 33% of Indian adults say they would, compared with 65% of Indian adults who say the opposite.

Foreign-born Indian adults are more likely than those born in the U.S. to say they would move to India (36% vs. 14%). Immigrants who have been in the U.S. for less time are also particularly likely to be open to moving back relative to those who have been in the U.S. for longer.

Nearly all U.S.-born Indian adults say they would not move to India (85%).

“I remember [my last trip to India] was one that I really … spent time with my grandma and grand aunt as much as I could…. [P]revious India trips growing up were this cycle of getting there for the whole summer and initially not liking it at all and then slowly like just kind of falling in love with my family and the people around me.”

– U.S.-born man of Indian origin, age 26

A bar chart showing that among the 33% of Indian adults in the U.S. who would move to India, 52% say the main reason is to be closer to friends or family.

Among the third of Indian adults who say they would move to India, about half say the main reason for the move is to be closer to loved ones. Smaller shares cite lower cost of living (12%), more familiarity with Indian culture (7%), more job opportunities (6%), and better elder care (6%) as the main reason they would move there.

“There is a difference between the standard of living in India and the standard of living in the USA. The medical facilities available here are better than in India. It feels safer here too. The education that we can give to our children here is of a very high standard. Competition here is also very less than in India, so whatever field one wants to choose for oneself, they will get it here.”

– Immigrant woman of Indian origin, age 46 (translated from Hindi)

4. Japanese Americans’ views of Japan and other places

Why we don’t report on differences in the Japanese adult population

In this report, we are unable to report on subgroup differences among Japanese adults in the U.S. This is because the sample included too few Japanese adults to make reliable estimates of smaller demographic subgroups (e.g., Japanese adults under 50, Japanese adults with some college experience or less, etc.).

For example, in the 2022-23 survey of Asian Americans, we conducted 81 raw interviews with foreign-born Japanese adults. That yields an effective sample size of 33 and a 95% confidence level margin of error (which assumes a reported percentage of 50%) of +/- 17.2 percentage points. This does not fulfill the Center’s requirements for responsible reporting on small subgroups. For more information, read our explainer on why we display margins of error in some graphics.

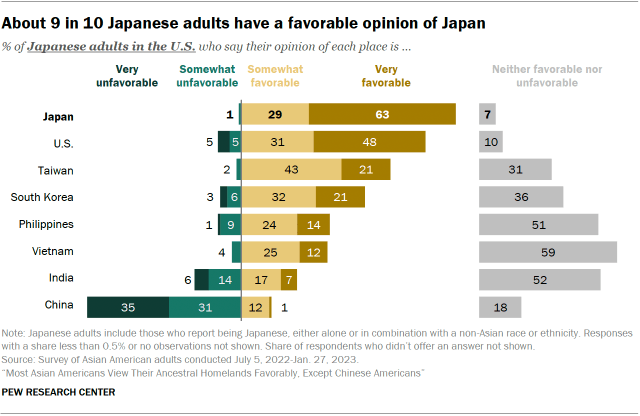
Nearly all Japanese adults in the U.S. (92%) say they have a favorable opinion of Japan, including 63% who have a very favorable view. This is a more favorable rating than any other place asked about in the survey. And Japanese adults’ views of Japan are somewhat more positive than among other Asian adults,9 67% of whom say they have a positive view of Japan.

Though about nine-in-ten Japanese adults say they have a favorable opinion of their ancestral homeland, only about a quarter say they would ever move to Japan, compared with 72% who say they would not.

Japanese Americans have largely positive views of the United States (79%) and Taiwan (64%). In the case of the U.S., around half even report very favorable views (48%), our survey analysis finds.

A bar chart showing Japanese American adults’ favorability of different places. Japanese Americans have majority favorable views of Japan, the U.S., Taiwan and South Korea; more neutral views of the Philippines, Vietnam and India; and unfavorable views of China.

“[W]hen [people] find out I am Japanese – in our generation, Japan was a technological powerhouse at one time, like Sony, so they say, ‘Japan is great, isn’t it? Their technology is great.’ Now such conversation happens less often. So that presence of Japan is becoming the past, I feel. [Another] thing is about World War II. I’m over 60 years old now, so I feel World War II is closer to me than younger people. When I talk to older people here, they often mention the war. Like they were in Okinawa as a soldier, or served in the Korean War, they talk about their history. So the war-related matters come up in my mind.”

– Immigrant man of Japanese origin, age 62 (translated from Japanese)

About half of Japanese adults (53%) say they have a favorable view of South Korea, while 36% say their opinion is neither favorable nor unfavorable. Around one-in-ten have negative views of South Korea.

When it comes to Vietnam, Japanese Americans’ views are more neutral. About six-in-ten say their opinion of Vietnam is neither favorable nor unfavorable, though a higher share say their opinion is favorable than unfavorable (37% vs. 4%).

“[Japan is an] ally. Unlike China, America and Japan have been primary allies for a long time. They are allies, not enemies.”

– Immigrant woman of Japanese origin, age 45 (translated from Japanese)

About half of Japanese adults also have a neutral opinion of India and the Philippines (52% and 51%, respectively). In the case of India, similar shares report favorable and unfavorable views (24% and 21%). In the case of the Philippines, though, the balance of opinion is more positive than negative (38% vs. 10%).

Like some other Asian origin groups, Japanese Americans view China the most negatively of all the places asked about. Two-thirds of Japanese adults (66%) say they have an unfavorable opinion of the country. Similar shares say their view is favorable or neutral (14% and 18%).   

5. Korean Americans’ views of South Korea and other places

A large majority (86%) of Korean adults in the U.S. have a favorable view of South Korea. They see the country most favorably of all the places asked about in our survey.

“Not long ago, I went to Korea and came back after about three and a half months. Now, Korea has developed so much that I wonder why I received (U.S.) citizenship. Still, if you want to live [comfortably] with the same amount of money, I don’t think there is anywhere comparable to the United States.”

– Immigrant man of Korean origin, age 48 (translated from Korean)

Korean men and those with a postgraduate degree stand out in their positive views. Nine-in-ten Korean adults of both groups (92%) view South Korea favorably, including 61% of men and 50% of advanced degree holders who say their opinion of South Korea is very favorable.

About three-quarters of Korean adults hold broadly positive views toward the U.S.

A bar chart showing Korean Americans’ favorability of different places. Korean Americans have majority favorable views of South Korea, the U.S. and Taiwan; more neutral views of Vietnam, the Philippines, and India; split views of Japan; and majority unfavorable views of China.

When asked about their views of Taiwan, Korean Americans skew positive in their opinions but are more split: They are only slightly more likely to say they have a favorable view than a neutral one (52% vs. 41%). Few Korean Americans (5%) have negative views of Taiwan.

Korean Americans are about evenly split when it comes to views of Japan. Some 36% of Korean adults have a favorable view of the country, 34% have a neutral opinion and 29% have an unfavorable view.

Korean Americans hold more neutral views of Vietnam, the Philippines and India.

About six-in-ten Korean adults say their opinions of Vietnam and the Philippines are neither favorable nor unfavorable (59% and 57% respectively). Around three-in-ten see each of these countries favorably, and around one-in-ten see each unfavorably.

While around half of Korean adults (52%) say they have a neutral opinion of India, the balance of opinion is somewhat more negative (30%) than positive (17%).

A majority of Korean adults have negative views of China. About two-thirds of Korean Americans say they have an unfavorable opinion of China.

Stronger ties to the Korean Peninsula are associated with less favorable views of Japan

Korean adults are about half as likely to hold a favorable view of Japan as other Asian adults.10 Perhaps related to the contentious historical relationship between Korea and Japan, Korean Americans’ views of Japan vary by their connection to the Korean Peninsula.

U.S.-born Korean adults are more likely to have positive views of Japan than those born abroad (50% vs. 31%). Among Korean immigrants, those who have been in the U.S. for more than two decades are more likely than those who arrived more recently to say they have a favorable view of Japan (38% vs. 20%).

Younger Korean adults are also more likely to have a favorable view of Japan than older Korean adults: Four-in-ten Korean adults in the U.S. ages 18 to 49 say their opinion of Japan is very or somewhat favorable, compared with about a quarter of those 50 and older.

Most Korean adults say they would not move to Korea

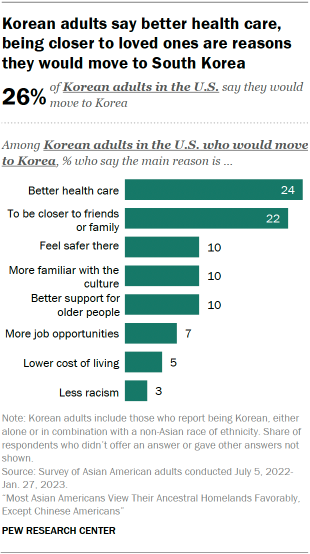
A bar chart showing that among the 26% of Korean adults in the U.S. who would move to South Korea, 24% say the main reason they would move is for better health care and 22% say they would move to be closer to family and friends.

Though an overwhelming majority of Korean adults in the U.S. have a favorable view of South Korea, only about a quarter (26%) say they would ever move there. Roughly three-quarters of Korean adults (72%) say they would not move to Korea.

Views do not differ between those who are foreign born and those who were born in the U.S.

Among the one-in-four Korean adults who say they would move to Korea, about half said the main reason would be to receive better health care (24%) or to be closer to friends or family (22%).

Smaller shares of Korean adults who said they would move to South Korea said the main reason is because they feel safer there, they’re more familiar with Korean culture, or because South Korea has better support for older people (10% each).

“It has been more than a decade since I first came to the United States, and in the meantime South Korea has developed a lot. Electronic devices that used to be dominated by Japanese products have now been replaced with Korean products, making me proud to be a Korean. There are many Korean cars, and K-pop and Korean food – all have grown a lot.… Talking about Korea’s rapid growth made me feel proud as a Korean.”

– Immigrant woman of Korean origin, age 41 (translated from Korean)

6. Taiwanese Americans’ views of Taiwan and other places

How we measure Taiwanese Americans’ views and why we don’t report on differences within the Taiwanese adult population

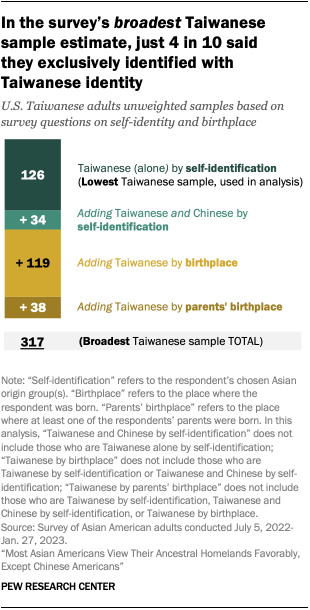
In this report, we have chosen to separate the Chinese and Taiwanese samples in the 2022-23 survey of Asian American adults to discuss differences in attitudes on several geopolitical issues. In the sample of Taiwanese adults, we include only those who self-identify as Taiwanese alone. For more information on how we defined the survey’s Taiwanese sample, refer to the appendix.

We are unable to report on subgroup differences among Taiwanese adults in the U.S. This is because the sample included too few Taiwanese adults to make reliable estimates of smaller demographic subgroups (e.g., Taiwanese men, Taiwanese women, Taiwanese adults under 50, etc.).

In the 2022-23 survey of Asian Americans, we conducted 126 raw interviews with self-identified Taiwanese adults. That yields an effective sample size of 63 and a 95% confidence level margin of error (which assumes a reported percentage of 50%) of +/- 12.4 percentage points. Due to the relatively small sample size, we have chosen to display margins of sampling error in charts while reporting on views of Taiwanese adults overall. However, among demographic subgroups within Taiwanese adults, the sample sizes do not fulfill the Center’s requirements for responsible reporting on small subgroups. For more information, read our explainer on why we display margins of error in some graphics.

A large majority of Taiwanese Americans (95%) hold a favorable view of Taiwan, including 75% who say their opinion is very favorable.

Though nearly all Taiwanese adults in the U.S. have a positive attitude toward Taiwan, only three-in-ten say they would consider moving there, our survey analysis finds.

A dot plot showing Taiwanese American adults’ favorability of different places. Taiwanese Americans have majority favorable views of Taiwan, Japan, the U.S. and South Korea; more neutral views of Vietnam, the Philippines, and India; and unfavorable views of China.

“It’s about the future, a better future and the hope for changes. The U.S. is a major democratic country, and so is Taiwan. But they are different. That is why we want to come here to observe how a real democracy works. How does a real two-party system work? … [A]s a Taiwanese living in the U.S., we want to understand what the U.S. stance on Taiwan is. That is whether they recognize Taiwan as a country…. This is a much-debated issue.”

– Immigrant man of Taiwanese origin, age 37 (translated from Mandarin)

About nine-in-ten have a positive view of Japan, and roughly three-quarters see the U.S. positively. South Korea is also seen favorably by about two-thirds of Taiwanese Americans.

Taiwanese Americans generally hold neither favorable nor unfavorable views of Vietnam, the Philippines and India.

“For me, I think one of the biggest things that defines being Taiwanese American is the political struggle with China, and also the fact that Taiwan had gone through industrialization as part of the Four Tigers, whereas China is going through it now. Also, China is a much larger region with its own different backgrounds for each area and differences in cuisine and stuff like that. So there is a lot more to being Chinese, whereas the Taiwan culture is a little bit more uniform, but it’s still different.”

– U.S.-born man of Taiwanese origin, age 32

Taiwanese Americans see China the most unfavorably out of the places they were asked about. Just 2% of Taiwanese U.S. adults have a positive opinion of China. Conversely, 84% have an unfavorable view of China, including 62% who have a very unfavorable view.11

Taiwanese Americans’ views of many of the places included in the survey differ significantly from those of other Asian Americans.12 They are much more likely than other Asian adults to hold a favorable view of Taiwan (95% vs. 56%) and Japan (87% vs. 68%). Compared with other Asian Americans, they also hold less positive views of China (2% vs. 20%).

7. Vietnamese Americans’ views of Vietnam and other places

CORRECTION (July 19, 2023): A previous version of this report misstated which places in Asia Vietnamese American adults are more likely to have a favorable view of than Vietnam. The text has been updated to reflect that Vietnamese adults are more likely to have a favorable view of Japan than Vietnam.

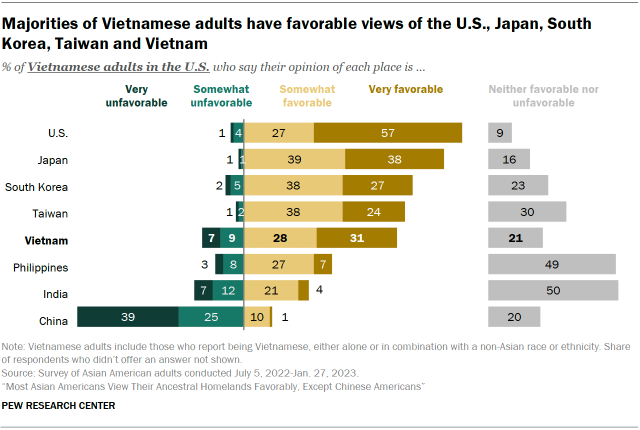
A higher share of Vietnamese Americans view the United States favorably than any other place asked about in our survey. Some 84% of Vietnamese adults say they have a favorable view, including 57% who say their opinion of the U.S. is very favorable. Only 6% of Vietnamese Americans have an unfavorable view of the country.

A majority of Vietnamese adults have favorable views of Japan, South Korea and Taiwan.

When it comes to Vietnamese Americans’ views of Vietnam, about six-in-ten say they have a favorable opinion. Similar shares say their opinion of Vietnam is neutral or unfavorable (21% and 16%).

A bar chart showing Vietnamese American adults’ favorability of different places. Vietnamese Americans have majority favorable views of the U.S., Japan, South Korea, Taiwan and Vietnam; more neutral views of the Philippines and India; and majority unfavorable views of China.

“[My children] have more opportunities to develop than we did when we were in Vietnam. They have opportunities to learn, and their study is better…. [M]y generation grew up after April 30, 1975 [the fall of Saigon], and there were a lot of obstacles. Schools were far away. I had to walk 4 kilometers (2.5 miles) to my middle school back then. Here, the school buses take them to school and drive them home.”

– Immigrant man of Vietnamese origin, age 49 (translated from Vietnamese)

Though a majority of Vietnamese adults have a positive impression of Vietnam, their view of the homeland of their ancestors is more moderate than some other Asian origin groups. Japanese and Korean adults view the place they trace their heritage to more positively than any other Asian location asked about. However, Vietnamese adults are more likely to say that they have a favorable view of Japan than they do of Vietnam.

Vietnamese women are more likely than Vietnamese men to view the country in a positive light. Two-thirds of women say their view of Vietnam is very or somewhat favorable, compared with about half of Vietnamese men. Vietnamese adults younger than 50 and those born in the U.S. also have particularly positive views of Vietnam (72% and 70%).

Vietnamese Americans’ opinions of India and the Philippines are more neutral. About half say they see both countries neither favorably nor unfavorably (50% and 49%, respectively). In the case of India, the balance of opinion is somewhat divided between positive (25%) and negative (19%) views. Views of the Philippines skew generally more positive, however, with 34% saying they have a favorable view of the country and 11% saying they have an unfavorable view.

Vietnamese Americans have negative views China. About two-thirds of Vietnamese adults (64%) have an unfavorable view of China, including 39% who say they see it very unfavorably.

Vietnamese Americans’ views vary by partisan identity

When it comes to views of the U.S. and Vietnam, views vary across political party affiliation. Nearly all Vietnamese adults who are Republicans or lean to the GOP (95%) have a favorable opinion of the U.S., including 74% who view the country very favorably. In comparison, fewer Vietnamese Democrats or Democratic leaners (71%) say their opinion of the U.S. is favorable.

“[My parents] said Vietnam is way different from when they left it, but I guess they did leave during the [Vietnam] war so it would really be different. But they said we’re a lot more privileged [where we live in the U.S. now] at least, especially where I grew up where it’s mostly Vietnamese. They said the food’s actually better here because we have more access to better resources and produce. They said they wouldn’t move back but they just want to take me and my older brother just to see it.”

– U.S.-born woman of Vietnamese origin, age 22

This pattern is reversed on favorability toward Vietnam. Though similar shares say they have a favorable opinion of the country, Vietnamese Republicans are more likely than Vietnamese Democrats to have an unfavorable opinion (24% vs. 8%).

In general, Vietnamese registered voters are more likely to identify as Republicans or lean to the GOP than Asian American registered voters overall.

A large majority of Vietnamese Americans say they would not move to Vietnam given the chance

A dot plot showing that among the 20% of Vietnamese adults in the U.S. who would move to Vietnam, 35% say the main reason they would move is for lower cost of living and 32% say the main reason is to be closer to friends or family.
When asked if they would ever move to Vietnam, most Vietnamese Americans (78%) say no. Foreign-born Vietnamese adults are slightly more likely to say they would move (21%) than those born in the United States (14%).

Among those who say they would be willing to move to Vietnam, the main reasons named are lower cost of living (35%) or to be closer to friends or family (32%). Smaller shares of Vietnamese adults also point to more familiarity with Vietnamese culture (11%), feeling safer in Vietnam (6%) or more support for older people (4%) as the primary reason they would be interested in moving there.

“I think over there [in Vietnam] it’s a lot easier to socialize. You can just walk out and go wherever in crowded areas and just kind of walk around but I think the opportunities here [in the U.S.] is a lot more than over there in Vietnam.”

– U.S.-born man of Vietnamese origin, age 40

Acknowledgments

Pew Research Center is a subsidiary of The Pew Charitable Trusts, its primary funder. The Center’s Asian American portfolio was funded by The Pew Charitable Trusts, with generous support from The Asian American Foundation; Chan Zuckerberg Initiative DAF, an advised fund of the Silicon Valley Community Foundation; the Robert Wood Johnson Foundation; the Henry Luce Foundation; the Doris Duke Foundation; The Wallace H. Coulter Foundation; The Dirk and Charlene Kabcenell Foundation; The Long Family Foundation; Lu-Hebert Fund; Gee Family Foundation; Joseph Cotchett; the Julian Abdey and Sabrina Moyle Charitable Fund; and Nanci Nishimura.

We would also like to thank the Leaders Forum for its thought leadership and valuable assistance in helping make this survey possible.

The strategic communications campaign used to promote the research was made possible with generous support from the Doris Duke Foundation.

This report was written by Neil G. Ruiz, head of new research initiatives and associate director of race and ethnicity research; Carolyne Im, research assistant; Christine Huang, research associate; and Laura Silver, associate director of global attitudes research.

The appendix of this report was written by Abby Budiman, temporary research associate.

Many individuals contributed to this study’s design, data collection and methodology. This survey and the subsequent reports from it would not be possible without Associate Director of Survey Methods Ashley Amaya, who designed the survey’s methodology, managed the long fielding period with Westat and helped with the questionnaire development. The entire survey project was expertly managed by Research Associate Luis Noe-Bustamante. Noe-Bustamante also managed a team that carried out the survey’s data processing and included Budiman, Im, Research Methodologist Arnold Lau and Research Assistant Lauren Mora. Research Assistant Mohamad Moslimani also contributed to the survey’s data processing and analysis of focus group transcripts for this report.

Ruiz and former Research Associate Sunny Shao led the development of the survey questionnaire with help from Amaya, Research Associate Khadijah Edwards, Mora, Moslimani and Noe-Bustamante. Senior Demographer Jeffrey Passel provided advice on the demographic analysis. Pew Research Center is also grateful to Westat’s Mike Brick, Ismael Flores Cervantes, Eric Jodts and Hanna Popick for their many contributions to this project.

Director of Race and Ethnicity Research Mark Hugo Lopez provided editorial guidance over the project, including the survey questionnaire, report and related products. Director of Global Attitudes Research Richard Wike also provided editorial guidance over the report. The report was number-checked by Mora, Moslimani, and Research Interns Rachel Chen and Joanne Haner. Senior Copy Editor David Kent copy edited the report. The report was produced by Assistant Digital Producer Janakee Chavda, Senior Digital Producer Shannon Greenwood and Associate Digital Producer Beshay Sakla.

The communications and outreach strategy for the report was led by Senior Communications Manager Hannah Klein and Communications Manager Gar Meng Leong, with help from Senior Communications Manager Tanya Arditi, Communications Manager Julia O’Hanlon and Communications Associate Mimi Cottingham. The charts and illustrations were designed by Im, Huang and Information Graphics Designer John Carlo Mandapat.

Pew Research Center is grateful to a panel of expert advisers who provided advice at all stages of this survey and report’s development: Devesh Kapur, Starr Foundation Professor of South Asian Studies at Johns Hopkins School of Advanced International Studies; Janelle Wong, Professor of American Studies and Asian American Studies at the University of Maryland; Yến Lê Espiritu, Distinguished Professor of Ethnic Studies at University of California, San Diego; Anthony Christian Ocampo, Professor of Sociology at California State Polytechnic University, Pomona; Karthick Ramakrishnan, Professor of Public Policy at the University of California, Riverside; and Yang Sao Xiong, Assistant Professor at College of Social Sciences at California State University, Fresno.

Methodology

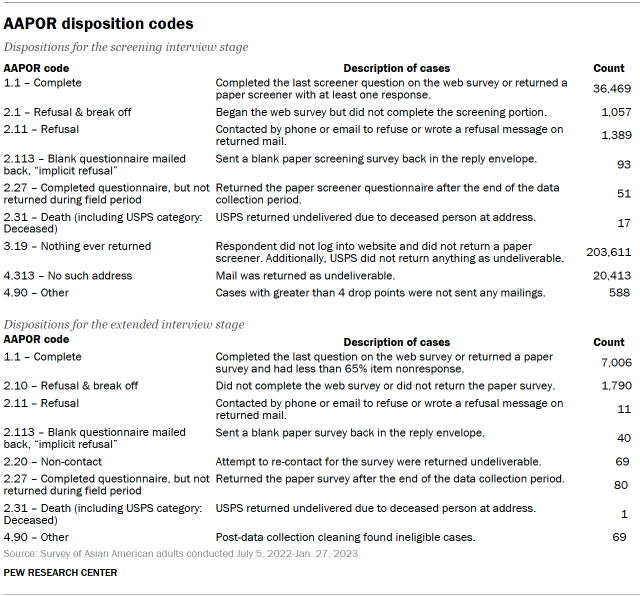
The data in this report is drawn from a national cross-sectional survey conducted for Pew Research Center by Westat. The sampling design of the survey was an address-based sampling (ABS) approach, supplemented by list samples, to reach a nationally representative group of respondents. The survey was fielded July 5, 2022, through Jan. 27, 2023. Self-administered screening interviews were conducted with a total of 36,469 U.S. adults either online or by mail, resulting in 7,006 interviews with Asian American adults. It is these 7,006 Asian Americans who are the focus of this report. After accounting for the complex sample design and loss of precision due to weighting, the margin of sampling error for these respondents is plus or minus 2.1 percentage points at the 95% level of confidence.

The survey was administered in two stages. In the first stage, a short screening survey was administered to a national sample of U.S. adults to collect basic demographics and determine a respondent’s eligibility for the extended survey of Asian Americans. Screener respondents were considered eligible for the extended survey if they self-identified as Asian (alone or in combination with any other race or ethnicity). Note that all individuals who self-identified as Asian were asked to complete the extended survey.

To maintain consistency with the Census Bureau’s definition of “Asian,” individuals responding as Asian but who self-identified with origins that did not meet the bureau’s official standards prior to the 2020 decennial census were considered ineligible and were not asked to complete the extended survey or were removed from the final sample. Those excluded were people solely of Southwest Asian descent (e.g., Lebanese, Saudi), those with Central Asian origins (e.g., Afghan, Uzbek) as well as various other non-Asian origins. The impact of excluding these groups is small, as together they represent about 1%-2% of the national U.S. Asian population, according to Pew Research Center tabulations of the 2021 American Community Survey.

Eligible survey respondents were asked in the extended survey how they identified ethnically (for example: Chinese, Filipino, Indian, Korean, Vietnamese, or some other ethnicity with a write-in option). Note that survey respondents were asked about their ethnicity rather than nationality. For methodological purposes (such as the sample design, weighting and variance estimation) respondents were classified based on their ethnicity. For example, those classified as Chinese in the survey methodology are those self-identifying as of Chinese ethnicity, rather than necessarily being a citizen or former citizen of the People’s Republic of China. Since this is an ethnicity, classification of survey respondents as Chinese also includes those who are Taiwanese. This report, however, classifies respondents based on their Asian origin to discuss differences in views among origin groups on several geopolitical issues. For example, it details the views of Chinese and Taiwanese respondents separately. In the remainder of this methodology statement, references to Chinese respondents refer to those who are ethnically Chinese and therefore includes those who report being Taiwanese.

The research plan for this project was submitted to Westat’s institutional review board (IRB), which is an independent committee of experts that specializes in helping to protect the rights of research participants. Due to the minimal risks associated with this questionnaire content and the population of interest, this research underwent an expedited review and received approval (approval #FWA 00005551).

Throughout this methodology statement, the terms “extended survey” and “extended questionnaire” refer to the extended survey of Asian Americans that is the focus of this report, and “eligible adults” and “eligible respondents” refer to those individuals who met its eligibility criteria, unless otherwise noted.

Sample design

The survey had a complex sample design constructed to maximize efficiency in reaching Asian American adults while also supporting reliable, national estimates for the population as a whole and for the five largest ethnic groups (Chinese, Filipino, Indian, Korean and Vietnamese). Asian American adults include those who self-identify as Asian, either alone or in combination with other races or Hispanic identity.

The main sample frame of the 2022-2023 Asian American Survey is an address-based sample (ABS). The ABS frame of addresses was derived from the USPS Computerized Delivery Sequence file. It is maintained by Marketing Systems Group (MSG) and is updated monthly. MSG geocodes their entire ABS frame, so block, block group, and census tract characteristics from the decennial census and the American Community Survey (ACS) could be appended to addresses and used for sampling and data collection.

All addresses on the ABS frame were geocoded to a census tract. Census tracts were then grouped into three strata based on the density of Asian American adults, defined as the proportion of Asian American adults among all adults in the tract. The three strata were defined as:

  • High density: tracts with an Asian American adult density of 10% or higher
  • Medium density: tracts with a density 3% to less than 10%
  • Low density: tracts with a density less than 3%

Mailing addresses in census tracts from the lowest density stratum, strata 3, were excluded from the sampling frame. As a result, the frame excluded 54.1% of the 2020 census tracts, making up 49.1% of the U.S. adult population, including 9.1% of adults who self-identified as Asian alone or in combination with other races or Hispanic ethnicity. For the largest five Asian ethnic subgroups, Filipinos had the largest percentage of excluded adults with 6.8%, while Indians had the lowest with 4.2% of the adults. Addresses were then sampled from the two remaining strata. This stratification and the assignment of differential sampling rates to the strata were critical design components because of the rareness of the Asian American adult population.

Despite oversampling of the high- and medium-density Asian American strata in the ABS sample, the ABS sample was not expected to efficiently yield the required number of completed interviews for some ethnic subgroups. Therefore, the ABS sample was supplemented with samples from the specialized surnames list frames maintained by the MSG. These list frames identify households using commercial databases linked to addresses and telephone numbers. The individuals’ surnames in these lists could be classified by likely ethnic origin. Westat requested MSG to produce five list frames: Chinese, Filipino, Indian, Korean and Vietnamese. The lists were subset to include only cases with a mailing address. Addresses sampled from the lists, unlike those sampled from the ABS frame, were not limited to high- and medium-density census tracts.

Once an address was sampled from either the ABS frame or the surname lists, an invitation was mailed to the address. The invitation requested that the adult in the household with the next birthday complete the survey.

Data collection

To maximize response, the survey used a sequential mixed-mode protocol in which sampled households were first directed to respond online and later mailed a paper version of the questionnaire if they did not respond online.

A table showing sample allocation and Asian American incidence by sampling frame.

The first mailing was a letter introducing the survey and providing the information necessary (URL and unique PIN) for online response. A pre-incentive of $2 was included in the mailing. This and remaining screener recruitment letters focused on the screener survey, without mentioning the possibility of eligibility for a longer survey and associated promised incentive, since most people would only be asked to complete the short screening survey. It was important for all households to complete the screening survey, not just those who identify as Asian American. As such, the invitation did not mention that the extended survey would focus on topics surrounding the Asian American experience. The invitation was generic to minimize the risk of nonresponse bias due to topic salience bias.

After one week, Westat sent a postcard reminder to all sampled individuals, followed three weeks later by a reminder letter to nonrespondents. Approximately 8.5 weeks after the initial mailing, Westat sent nonrespondents a paper version screening survey, which was a four-page booklet (one folded 11×17 paper) and a postage-paid return envelope in addition to the cover letter. If no response was obtained from those four mailings, no further contact was made.

Eligible adults who completed the screening interview on the web were immediately asked to continue with the extended questionnaire. If an eligible adult completed the screener online but did not complete the extended interview, Westat sent them a reminder letter. This was performed on a rolling basis when it had been at least one week since the web breakoff. Names were not collected until the end of the web survey, so these letters were addressed to “Recent Participant.”

If an eligible respondent completed a paper screener, Westat mailed them the extended survey and a postage-paid return envelope. This was sent weekly as completed paper screeners arrived. Westat followed these paper mailings with a reminder postcard. Later, Westat sent a final paper version via FedEx to eligible adults who had not completed the extended interview online or by paper.

Incentives

A pre-incentive of $2 (in the form of two $1 bills) was sent to all sampled addresses with the first letter, which provided information about how to complete the survey online. This and subsequent screener invitations only referred to the pre-incentive without reference to the possibility of later promised incentives.

Respondents who completed the screening survey and were found eligible were offered a promised incentive of $10 to go on and complete the extended survey. All participants who completed the extended web survey were offered their choice of a $10 Amazon.com gift code instantly or $10 cash mailed. All participants who completed the survey via paper were mailed a $10 cash incentive.

In December 2022 a mailing was added for eligible respondents who had completed a screener questionnaire, either by web or paper but who had not yet completed the extended survey. It was sent to those who had received their last mailing in the standard sequence at least four weeks earlier. It included a cover letter, a paper copy of the extended survey, and a business reply envelope, and was assembled in a 9×12 envelope with a $1 bill made visible through the envelope window.

In the last month of data collection, an additional mailing was added to boost the number of Vietnamese respondents. A random sample of 4,000 addresses from the Vietnamese surname list and 2,000 addresses from the ABS frame who were flagged as likely Vietnamese were sent another copy of the first invitation letter, which contained web login credentials but no paper copy of the screener. This was sent in a No. 10 envelope with a wide window and was assembled with a $1 bill visible through the envelope window.

Languages

The mail and web screening and extended surveys were developed in English and translated into Chinese (Simplified and Traditional), Hindi, Korean, Tagalog and Vietnamese. For web, the landing page was displayed in English initially but included banners at the top and bottom of the page that allowed respondents to change the displayed language. Once in the survey, a dropdown button at the top of each page was available to respondents to toggle between languages.

The paper surveys were also formatted into all six languages. Recipients thought to be more likely to use a specific language option, based on supplemental information in the sampling frame or their address location, were sent a paper screener in that language in addition to an English screener questionnaire. Those receiving a paper extended instrument were sent the extended survey in the language in which the screener was completed. For web, respondents continued in their selected language from the screener.

Weighting and variance estimation

Household-level weighting

The first step in weighting was creating a base weight for each sampled mailing address to account for its probability of selection into the sample. The base weight for mailing address k is called BWk and is defined as the inverse of its probability of selection. The ABS sample addresses had a probability of selection based on the stratum from which they were sampled. The supplemental samples (i.e., Chinese, Filipino, Indian, Korean and Vietnamese surname lists) also had a probability of selection from the list frames. Because all of the addresses in the list frames are also included in the ABS frame, these addresses had multiple opportunities for these addresses to be selected, and the base weights include an adjustment to account for their higher probability of selection.

Each sampled mailing address was assigned to one of four categories according to its final screener disposition. The categories were 1) household with a completed screener interview, 2) household with an incomplete screener interview, 3) ineligible (i.e., not a household, which were primarily postmaster returns), and 4) addresses for which status was unknown (i.e., addresses that were not identified as undeliverable by the USPS but from which no survey response was received).

The second step in the weighting process was adjusting the base weight to account for occupied households among those with unknown eligibility (category 4). Previous ABS studies have found that about 13% of all addresses in the ABS frame were either vacant or not home to anyone in the civilian, non-institutionalized adult population. For this survey, it was assumed that 87% of all sampled addresses from the ABS frame were eligible households. However, this value was not appropriate for the addresses sampled from the list frames, which were expected to have a higher proportion of households as these were maintained lists. For the list samples, the occupied household rate was computed as the proportion of list cases in category 3 compared to all resolved list cases (i.e., the sum of categories 1 through 3). The base weights for the share of category 4 addresses (unknown eligibility) assumed to be eligible were then allocated to cases in categories 1 and 2 (known households) so that the sum of the combined category 1 and 2 base weights equaled the number of addresses assumed to be eligible in each frame. The category 3 ineligible addresses were given a weight of zero.

The next step was adjusting for nonresponse for households without a completed screener interview to create a final household weight. This adjustment allocated the weights of nonrespondents (category 2) to those of respondents (category 1) within classes defined by the cross-classification of sampling strata, census region, and sample type (e.g., ABS and list supplemental samples). Those classes with fewer than 50 sampled addresses or large adjustment factors were collapsed with nearby cells within the sample type. Given the large variance in the household weights among the medium density ABS stratum, final household weights for addresses within this stratum were capped at 300.

Weighting of extended survey respondents

The extended interview nonresponse adjustment began by assigning each case that completed the screener interview to one of three dispositions: 1) eligible adult completed the extended interview; 2) eligible adult did not complete the extended interview; and 3) not eligible for the extended interview.

An initial adult base weight was calculated for the cases with a completed extended interview as the product of the truncated number of adults in the household (max value of 3) and the household weight. This adjustment accounted for selecting one adult in each household.

The final step in the adult weighting was calibrating the adult weights for those who completed the extended interview so that the calibrated weights (i.e., the estimated number of adults) aligned with benchmarks for non-institutionalized Asian adults from the 2016-2020 American Community Surveys Public Use Microdata Sample (PUMS). Specifically, raking was used to calibrate the weights on the following dimensions:

  1. Ethnic group (Chinese, Filipino, Indian, Japanese, Korean, Vietnamese, other single Asian ethnicities, and multiple Asian ethnicities)
  2. Collapsed ethnic group (Chinese, Filipino, Indian, Korean, Vietnamese, all other single and multiple Asian ethnicities) by age group
  3. Collapsed ethnic group by sex
  4. Collapsed ethnic group by census region
  5. Collapsed ethnic group by education
  6. Collapsed ethnic group by housing tenure
  7. Collapsed ethnic group by nativity
  8. Income group by number of persons in the household

The control totals used in raking were based on the entire population of Asian American adults (including those who live in the excluded stratum) to correct for both extended interview nonresponse and undercoverage from excluding the low-density stratum in the ABS frame.

Variance estimation

Because the modeled estimates used in the weighting are themselves subject to sampling error, variance estimation and tests of statistical significance were performed using the grouped jackknife estimator (JK2). One hundred sets of replicates were created by deleting a group of cases within each stratum from each replicate and doubling the weights for a corresponding set of cases in the same stratum. The entire weighting and modeling process was performed on the full sample and then separately repeated for each replicate. The result is a total of 101 separate weights for each respondent that have incorporated the variability from the complex sample design.13

Response rates

Westat assigned all sampled cases a result code for their participation in the screener, and then they assigned a result for the extended questionnaire for those who were eligible for the survey of Asian Americans. Two of the dispositions warrant some discussion. One is the category “4.313 No such address.” This category is for addresses that were returned by the U.S. Postal Service as not being deliverable. This status indicates the address, which was on the USPS Delivery Sequence File at the time of sampling, currently is not occupied or no longer exists. The second category is “4.90 Other.” This category contains 588 addresses that were never mailed because they had a drop count of greater than four. Drop points are addresses with multiple households that share the same address. The information available in the ABS frame on drop points is limited to the number of drop points at the address, without information on the type of households at the drop point, or how they should be labeled for mailing purposes. In this survey, all drop points were eligible for sampling, but only those with drop point counts of four or fewer were mailed. Westat treated drop point counts of five or more as out of scope, and no mailing was done for those addresses.

Westat used the disposition results to compute response rates consistent with AAPOR definitions. The response rates are weighted by the base weight to account for the differential sampling in this survey. The AAPOR RR3 response rate to the screening interview was 17.0%.14 The RR1 response rate to the extended Asian American interview (77.9%) is the number of eligible adults completing the questionnaire over the total sampled for that extended questionnaire. The overall response rate is the product of the screener response rate and the conditional response rate for the extended questionnaire. The overall response rate for the Asian American sample in the Pew Research Center survey was 13.3% (17.0% x 77.9%).

A table that shows AAPOR disposition codes.

Appendix: How we defined the survey’s Taiwanese sample

Measuring the identity of Taiwanese Americans, and Asian origin groups in the United States more generally, is a challenging endeavor, whether in survey research or when trying to generate estimates of population size, such as the Taiwanese American population through Census Bureau data. Pew Research Center generally tends to rely on self-identification when it comes to measuring identity, and in this section, we will explain how this applies to our survey’s Taiwanese sample.

In this report, we classify the Taiwanese sample – as well as the samples of other Asian origin groups – based on survey participants’ responses to a question about their ethnic identity. Ultimately, origin groups were categorized based on the answers of those who self-identified with one single Asian origin only. But a respondent’s identity can also be expressed through multiple, overlapping markers, such as birthplace, ancestry, or cultural and linguistic roots. To capture this complexity, the Center’s 2022-2023 survey of Asian American adults included a series of questions that probe these different markers.

To holistically grasp how a respondent self-identifies, the survey specifically inquired about their race and ethnicity, spoken and written language fluency, birthplace, as well as the birthplace of both parents. Many of these identity markers relate to overlapping concepts that rarely have clear definitions:

  • Race is a concept that groups individuals together based on shared physical characteristics. The understanding of race in the United States may differ from how race is conceptualized in various countries across Asia. Through the U.S. lens, all Asian origin groups indiscriminately belong under the “Asian” race banner.
  • Ethnicity is a concept that relates to a broader cultural identity that is shared by a group of people. People from multiple countries or nations, who may identify in disparate ways, can share one ethnicity.
  • Nationality is a concept that relates to an individual’s ties to a particular country or nation. Nationality is often – but not always – associated with where one was born or holds citizenship.
  • Ancestry is a concept that relates to an individuals’ familial ties to a particular country, nation, region or place. Ancestry is often associated with a particular place that someone can trace their cultural heritage or roots to, including the backgrounds of their parents or older generations.

All these concepts, and more, can shape how one sees their own identity. In the case of Taiwanese Americans, for instance, those who said they were born in Taiwan may imply that they are Taiwanese by nationality. Meanwhile, those who reported that only their parents were born in Taiwan might indicate that they possess Taiwanese ancestry. Additionally, people who have Taiwanese nationality or ancestry may or may not identify as Taiwanese themselves. These measures in particular point to the larger concept of a Taiwanese diaspora, or a population that lives outside of the place where they or their ancestors originated. In the Chinese language, the terms huá qiáo (华侨) and huá rén
(华人) refer to those of Chinese descent who currently reside outside their country of origin. A person of Taiwanese descent (tái wān rén, or 台湾人) may or may not identify with these Chinese diasporic concepts.

How we classify and report Asian origin groups

In our 2022-23 survey of Asian Americans, we primarily relied on one question to classify respondents into specific Asian origin groups. We asked how respondents identified ethnically by asking them to select specific Asian origin groups that they self-identify with. This particular question is key to determining how respondents personally differentiate between their Chinese and Taiwanese identities.

ASIANID_MOD. Do you consider yourself to be any of the following?

(Check all that apply.)

1.         Chinese
2.         Filipino
3.         Indian
4.         Korean
5.         Vietnamese
6.         Some other ethnicity (Please specify) ________

As respondents were permitted to choose more than one ethnicity, they can be categorized into any Asian group alone or in combination. For example, a person may identify as Vietnamese alone, while another may say that they are Chinese, Filipino and Japanese in combination. If someone identifies as Taiwanese, or other Asian origin groups that are not explicitly listed, they must enter that response under the “Some other ethnicity” box. This process is similar to how the U.S. Census Bureau has asked about Asian identity in their recent questionnaire.

When discussing Asian origin groups in this report, as well as in previous reports, we strictly relied only on the respondent’s self-identified ethnicity – their answer to the ASIANID_MOD question – and not on the more expansive markers of identity, which took into account broader identity markers such as birthplace and ancestry that were asked in the survey questionnaire.15

However, there are some challenges and limitations to this approach. First, when deciding how to define specific Asian origin groups for analysis, we only considered those who identified with one Asian origin group alone. We did this to ensure that there is no overlap between categories, allowing us to directly compare public attitudes between distinct, mutually exclusive origin groups.

Second, this understanding of Asian “origin groups” does not have a clear definition and is ultimately based on how respondents choose to self-identify. Even though ASIANID_MOD inquired about ethnic identity, respondents may have provided answers that actually speak more to their nationality, ancestry or other factors.

What may have driven some participants to respond with their nationality or ancestry instead of with their ethnicity? In some countries, ethnicity, nationality and ancestry are largely overlapping concepts; but in others, the relationship between these concepts is more complicated. This is particularly apparent in the case of the Taiwanese sample, where classifying respondents strictly by a shared Chinese ethnicity may obscure disparate identities for people who more strongly identify with Taiwanese nationality or ancestry. Past Pew Research Center analyses have found that among those who live in Taiwan, many do not consider themselves Chinese.

How does this apply to the Taiwanese sample in the 2022-23 Asian American survey?

In this report, we classify the Taiwanese sample the same way we classified all other Asian origin groups: by relying solely on responses to the ASIANID_MOD question. This means that we classify a respondent as Taiwanese American only if they explicitly self-identify as Taiwanese alone.

By contrast, a broader definition of the Taiwanese American sample in the survey would consider respondents who say that they are Taiwanese in addition to some other Asian origin group (primarily Chinese), as well as those who did not self-identify as Taiwanese, but were born in Taiwan or reported having at least one parent who was born in Taiwan.

A bar chart showing that in the survey’s broadest Taiwanese sample estimate, just 4 in 10 said 
they exclusively identified with the Taiwanese identity.

Given the potential differing interpretations of the Taiwanese identity being either a nationality, ancestry or both, in this section, we examine how our reporting of the Taiwanese sample estimate and its resulting attitudes would differ if we were to use different, more expansive definitions of identity.

In the 2022-23 survey of Asian Americans, we conducted 126 interviews with respondents who self-identified as Taiwanese alone, which accounts for 40% of the respondents in the broadest Taiwanese sample. An additional 34 respondents self-identified as both Taiwanese and Chinese, or an additional 11% of the total estimate. Finally, 157 respondents did not self-identify as Taiwanese but have some connection to Taiwan because either they or at least one of their parents was born there. This last subgroup accounted for 50% of the most expansive definition of our Taiwanese sample, and all respondents self-identified as being of Chinese origin instead. All factors considered, we conducted a total of 317 interviews with respondents who have at least some Taiwanese background.

Significant overlap exists among these distinct measures of the Taiwanese identity, however. For example, among the 126 respondents who self-identified as being Taiwanese only, six-in-ten (61%) said that they, and at least one of their parents, were born in Taiwan. On the other hand, out of the 227 people who said they were born in Taiwan, just over one-third (37%) said they strictly identified as being Taiwanese, while about one-in-ten (11%) reported being both Taiwanese and Chinese.

A venn diagram that shows how different measures of Taiwanese identity in the survey overlap.

How does our classification of the sample impact our analysis of the responses?

When analyzing responses based on these different groups, significant differences exist in attitudes between the smallest subset of the Taiwanese sample that includes those who explicitly self-identified as being Taiwanese alone (which is the one used in the report); the broader subset that includes those who have self-identified as Taiwanese in addition to Chinese; an even broader subset that also includes those who reported Taiwan as a birthplace; and finally the broadest subset that also includes those who reported Taiwan as a parents’ birthplace.

A chart that shows views toward China are less favorable among respondents who only self-identified as Taiwanese compared with those who reported any ties to Taiwan.

For example, when questioned about their views of China, a very large majority (84%) of those who identify as Taiwanese alone report an unfavorable opinion toward the country. Meanwhile, those who have any ties to Taiwan – whether by identity, birthplace or parents’ birthplace – still have broadly negative views of China, but the share who hold this opinion is markedly smaller (64%). The shares who hold favorable views toward China are not significantly lower among the sample of respondents who only identified as Taiwanese, compared with the sample that also includes those who reported broader ties to Taiwan.

Attitudes do not always differ significantly between the different subsets of the sample, however. For example, huge majorities across all groups (89% or higher) hold favorable views toward Taiwan.

The issues that we have highlighted in this section reflect the larger challenge behind the task of measuring various forms of identities in social science research. Identity, by its nature, is nuanced and subject to the lens of different cultures and communities that it is examined through. The various methods for defining Taiwanese identity that we have outlined in this section present just one example of how a single identity can inspire numerous definitions and present sincere research challenges. This also brings attention to how data disaggregation can help us understand attitudes and opinions within subgroups.

This appendix was written by temporary Research Associate Abby Budiman in addition to the co-authors of this report.