Pew Research Center

FOR RELEASE JUNE 22, 2022

International Attitudes Toward the U.S., NATO and Russia in a Time of Crisis

Most say U.S. is reliable partner, and ratings for Biden are mostly positive – although down significantly from last year

BY Richard Wike, Janell Fetterolf, Moira Fagan and Sneha Gubbala

FOR MEDIA OR OTHER INQUIRIES:

Communications Department
202.419.4372
www.pewresearch.org

RECOMMENDED CITATION

Pew Research Center, June 2022, "International Attitudes Toward the U.S., NATO and Russia in a Time of Crisis"

About Pew Research Center

Pew Research Center is a nonpartisan, nonadvocacy fact tank that informs the public about the issues, attitudes and trends shaping the world. It does not take policy positions. The Center conducts public opinion polling, demographic research, computational social science research and other data-driven research. It studies politics and policy; news habits and media; the internet and technology; religion; race and ethnicity; international affairs; social, demographic and economic trends; science; research methodology and data science; and immigration and migration. Pew Research Center is a subsidiary of The Pew Charitable Trusts, its primary funder.

© Pew Research Center 2026

Table of contents

  • About Pew Research Center
  • International Attitudes Toward the U.S., NATO and Russia in a Time of Crisis
  • 1. International public opinion of the U.S. remains positive
  • 2. Positive ratings for NATO
  • 3. Ratings for Russia drop to record lows
  • 4. High confidence in Biden, Macron and Scholz, but low trust in Xi and Putin
  • Acknowledgments
  • Appendix: Classifying European political parties
  • Methodology

International Attitudes Toward the U.S., NATO and Russia in a Time of Crisis

Most say U.S. is reliable partner, and ratings for Biden are mostly positive – although down significantly from last year

How we did this

This Pew Research Center analysis focuses on public opinion of the United States, Russia and NATO in 17 countries in North America, Europe, the Middle East and the Asia-Pacific region. The report draws on nationally representative surveys of 19,903 adults from Feb. 14 to May 11, 2022. All surveys were conducted over the phone with adults in Canada, Belgium, France, Germany, Greece, Italy, the Netherlands, Spain, Sweden, the United Kingdom, Japan, Malaysia, Singapore and South Korea. Surveys were conducted face to face in Poland and Israel and online in Australia.

Data collection began a week prior to Russia’s invasion of Ukraine in Canada, France, Germany, Italy, the UK and Japan. All other countries began fieldwork the same day as or shortly after the invasion. Due to the time it takes to translate, program and test questions on our international surveys, we prioritized gathering data at the start of this significant international event rather than delaying, or pausing, fieldwork to add questions specifically about the war or the actions taken by world leaders in response. Analysis focuses on ratings of Presidents Joe Biden and Vladimir Putin, the countries they lead and NATO as the war in Ukraine was unfolding. In this report, the data is discussed in the context of over a decade of cross-national trends.

Views of Russia and NATO also include data from the United States. We surveyed 3,581 U.S. adults from March 21 to 27, 2022, after the start of the war in Ukraine. Everyone who took part in this survey is a member of the Center’s American Trends Panel (ATP), an online survey panel that is recruited through national, random sampling of residential addresses. This way nearly all U.S. adults have a chance of selection. The survey is weighted to be representative of the U.S. adult population by gender, race, ethnicity, partisan affiliation, education and other categories.

The Pew Research Center has conducted several studies on the ATP since the start of the war to measure American’s attitudes toward Russia, NATO and the invasion. Read more about American public opinion of the war:

  • Public Expresses Mixed Views of U.S. Response to Russia’s Invasion of Ukraine
  • Zelenskyy inspires widespread confidence from U.S. public as views of Putin hit new low
  • Seven-in-Ten Americans Now See Russia as an Enemy
  • Americans’ Concerns About War in Ukraine: Wider Conflict, Possible U.S.-Russia Clash

Here are the questions used for the report, along with responses. See our methodology database for more information about the survey methods outside the U.S. For respondents in the U.S., read more about the ATP’s methodology.
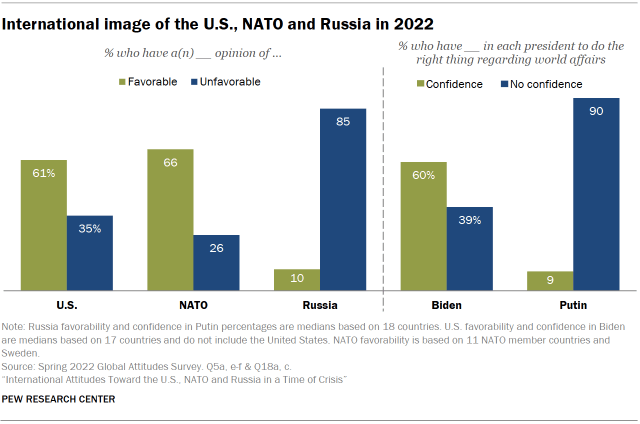
Bar charts showing International image of the U.S., NATO and Russia in 2022

Russia’s invasion of Ukraine has brought war to Europe at a scale unseen since the 1940s. In response, the United States and its NATO allies have supplied Ukrainian defense forces with weapons and training, while millions of refugees have fled into neighboring countries. The war has been the center of international attention for months, and as a new 18-nation Pew Research Center survey shows, it has had an impact on public opinion.  

Ratings for Russia, which were already negative in most of the nations surveyed, have plummeted further following the invasion. In 10 countries, 10% or less of those polled express a favorable opinion of Russia. Positive views of Russian President Vladimir Putin are in single digits in more than half of the nations polled.

Attitudes toward NATO, in contrast, are largely positive, and ratings for the alliance have improved in several nations since last year, including Germany and the U.S., as well as nonmember Sweden. Swedish attitudes toward NATO grew increasingly positive over the course of the survey’s field dates.

Meanwhile, overall ratings for the U.S. are largely positive and stable. A median of 61% across 17 nations (not including the U.S.) express a favorable view of the U.S. Still, there have been some changes since last year, with favorable opinions increasing significantly in South Korea, Sweden and Australia, while declining significantly in Greece, Italy and France.

Bar charts showing most see U.S. as a reliable partner, but many see strong partisan conflicts

Over the past couple of years, our surveys have found strong concerns in advanced economies about the health of American democracy. In 2021, more than half in most nations surveyed said democracy in the U.S. used to be a good example for other nations to follow, but that it no longer is. This year’s survey reveals a consensus about America’s divisive politics: Large majorities in nearly all the nations polled say there are strong conflicts between people who support different political parties in the U.S.

Large majorities in most countries see America as a reliable partner to their country, and the share of the public holding that view has risen over the past year in most nations where trends are available. For instance, 83% of South Koreans consider the U.S. a reliable partner, up from 58% in 2021.

Small multiple line charts showing that U.S. increasingly seen as a reliable partner among 9 countries surveyed

Ratings for U.S. President Joe Biden have slipped since 2021, with confidence in the American leader dropping significantly in 13 countries, including declines of 20 percentage points or more in Italy, Greece, Spain, Singapore and France. Despite these shifts, attitudes toward Biden remain mostly positive, with a median of 60% across the nations polled expressing confidence in him to do the right thing in world affairs. Biden gets his highest marks in Poland (82% confidence) and his lowest in Greece (41%).  

Data from four nations that we have surveyed consistently over the past two decades – France, Germany, Spain and the United Kingdom – illustrates the long-term pattern on views of recent American presidents in Western Europe. George W. Bush received low and declining ratings during his time in office, while Barack Obama got mostly high marks. Attitudes toward Donald Trump were overwhelmingly negative. Biden receives much more positive reviews than his predecessor, although his ratings have fallen in all four countries in year two of his presidency.

Line chart showing that in Western Europe, confidence in U.S. president drops in Biden’s second year, but still higher than Trump

The one country in the study where Biden receives lower ratings than Trump is Israel. Six-in-ten Israelis see Biden positively, but 71% felt this way about Trump when we last surveyed there in 2019 (in 2017 56% of Israelis rated Trump positively, and in 2018 it was 69%). Israeli views toward American presidents have fluctuated considerably over the past two decades, although overall attitudes toward the U.S. have remained consistently favorable.

CORRECTION (Aug. 11, 2023): A previous version of this report misstated Spanish confidence in U.S. President Joe Biden. A chart has been updated to reflect that in 2022, 48% of Spanish adults reported confidence in Biden to do the right thing regarding world affairs.

Scope and timing of the 2022 Global Attitudes Survey

This report includes data from a survey of 18 nations: the U.S., Canada, Belgium, France, Germany, Greece, Italy, the Netherlands, Poland, Spain, Sweden, the United Kingdom, Israel, Australia, Japan, Malaysia, Singapore and South Korea. Throughout the pandemic, our international survey research has mostly focused on advanced economies where phone or online polling is available. In many regions, we typically conduct face-to-face interviews, which have often been difficult since the COVID-19 outbreak. However, for the current survey, in-person face-to-face interviews were conducted in Israel and Poland, and we are optimistic that face-to-face research will be more widely available moving forward.

Interviews were conducted from Feb. 14 to May 11, 2022, with most taking place after Russia’s invasion of Ukraine, which began Feb. 24. Due to the timelines involved in designing and executing the survey, we were unable to include questions directly measuring opinions related to the war. However, as this report highlights, we have several findings that reflect the impact of the war on public opinion, particularly regarding attitudes toward Russia and NATO.

The survey does not include questions directly measuring opinions about how Biden or the U.S. has handled the Russian invasion of Ukraine.

However, one issue leading to lower ratings for Biden could be the major foreign policy issue of summer 2021: the U.S. withdrawal from Afghanistan after two decades of having a military presence in the country. The current survey finds that on balance the publics surveyed believe pulling out of Afghanistan was the right decision, but that the withdrawal was handled poorly. And confidence in Biden is notably lower among those who say the withdrawal was not handled well. Trust in Biden has also dropped sharply among those who do not believe the U.S. is a strong partner to their country.

Biden’s high ratings in 2021 may have also reflected in part people’s reactions to a new president after Trump’s tenure, during which the U.S. president received historically low ratings in many nations. In year two of his presidency, Biden remains popular, but some of the initial enthusiasm for his presidency has waned. And the declines for Biden are larger than those for Obama during his second year in office.

Bar chart showing confidence in Putin ranks lowest among key world leaders

Biden’s overall ratings are similar to those for two European leaders included on the survey, French President Emmanuel Macron (a median of 62% express confidence in him) and German Chancellor Olaf Scholz (a median of 59%). There are some notable differences, however, in ratings for the three leaders within specific countries. For instance, Biden gets much better reviews than his French and German counterparts in both Poland and Israel, while Macron is easily the most popular of the three leaders in Greece. The survey, which was conducted while the French presidential election was taking place, finds modest improvements in ratings for Macron in several nations. Overall, Scholz gets somewhat lower ratings than his predecessor, Angela Merkel, although this is partially due to the fact that some respondents are unfamiliar with the new German leader.

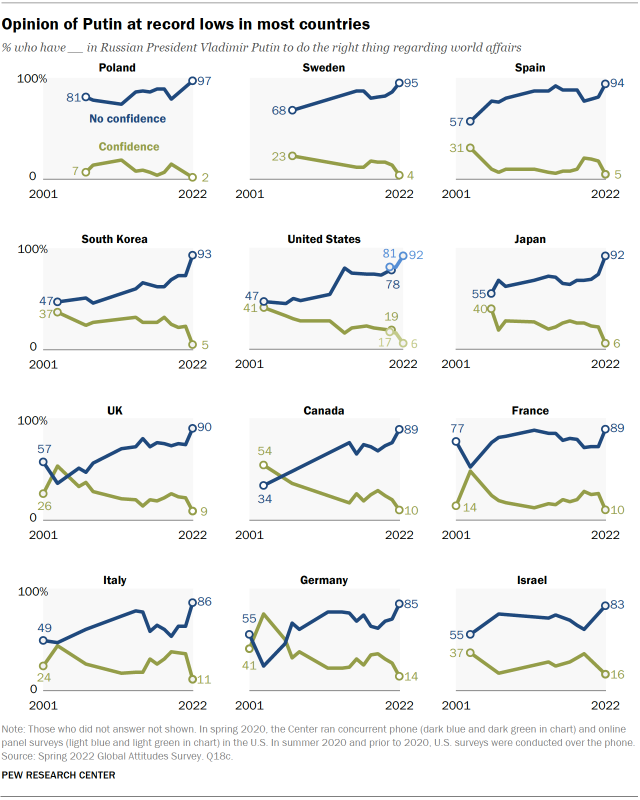
Chinese President Xi Jinping gets mostly low ratings, although majorities in Singapore and Malaysia express confidence in him. A median of just 9% have confidence in Putin to do the right thing in world affairs, with his already low ratings dropping over the past year in all countries where trends are available. 

However, views about Putin have not always been so negative. Pew Research Center has been tracking attitudes toward the Russian leader for two decades, and in the early 2000s his ratings were much more positive in North America and Western Europe. For example, in a 2003 survey, 75% of Germans voiced confidence in Putin. In a 2003 phone survey, Americans were somewhat divided in their views (47% no confidence in Putin, 41% confidence). Since then, however, he has received mostly negative marks, and his ratings are at all-time lows now in every country where we have trend data. In the U.S., the partisan divide in trust in Putin seen during Trump’s administration has narrowed, with overwhelming majorities of both Democrats and Republicans now lacking trust in the Russian president.

Confidence in world leaders often differs by age, but while younger adults tend to trust Biden and Macron less than older adults, they are more likely to have confidence in Putin in a number of countries. In Germany for example, half of adults ages 18 to 29 trust Biden to do the right thing in world affairs, compared with roughly three-quarters of adults ages 50 and older. And though overall confidence in Putin is much lower, about a quarter of young Germans trust him, compared with only 10% of older Germans.

Small multiple line charts showing negative ratings of Putin at record highs

Ratings for Russia are also at all-time lows in nearly all countries in the study. Poles and Swedes stand out for the intensity of their negative views. Fully 97% of Poles have an unfavorable opinion of Russia, and 91% have a very unfavorable opinion. In Sweden, 94% express an unfavorable view, with 80% saying their opinion of Russia is very unfavorable. Malaysia is the lone exception in attitudes towards Russia, with almost half (47%) holding a favorable opinion, while 50% view Russia unfavorably.

Line chart showing views of NATO in Sweden since 2016

The survey includes 11 NATO member states, and views of the alliance have improved in five of those nations since 2021 (Germany, the UK, Poland, the U.S. and the Netherlands), although they have declined in two (Greece and Italy). One of the more interesting patterns regarding attitudes toward NATO is in Sweden, a long-time officially neutral country that has recently applied for NATO membership in the wake of Russia’s invasion of Ukraine. Swedish views toward NATO have been trending in a positive direction in recent years, and in the current survey, 79% give the alliance a favorable rating – the highest ever registered in a Pew Research Center poll of Sweden. Moreover, attitudes grew more positive over the course of the survey, which began in Sweden on Feb. 24, the same day as Russia’s invasion. Among Swedes interviewed between April 5 and 20, toward the end of the survey’s field period, 84% said they have a favorable opinion of NATO.

Chart showing those on ideological right more positive on NATO in several countries, but in the U.S. and Canada the pattern is reversed

In several nations, views of NATO are more positive among people who place themselves on the right of the ideological spectrum. Among Greeks on the political right, for example, 41% have a favorable opinion of NATO, compared with just 19% among those on the left. Similar patterns are found in Spain, Sweden, France and the UK. However, in the U.S. and Canada, this pattern is reversed: Americans and Canadians on the left are significantly more likely to express a positive view of the alliance than those on the right.

In the U.S., ratings for NATO are more positive among Democrats and Democratic-leaning independents (78% favorable) than among Republicans and Republican leaners (55%), although this partisan gap has narrowed since 2021, when 77% of Democrats and 44% of Republicans gave the alliance positive marks.

These are among the major findings of a new Pew Research Center survey, conducted from Feb. 14 to May 11, 2022, among 23,484 adults in 18 nations. The analysis of attitudes toward the United States excludes data from the U.S. The analysis of views about NATO includes data from 11 member states plus Sweden. All 18 nations are included in the sections on views about Russia and international leaders. 
1. International public opinion of the U.S. remains positive

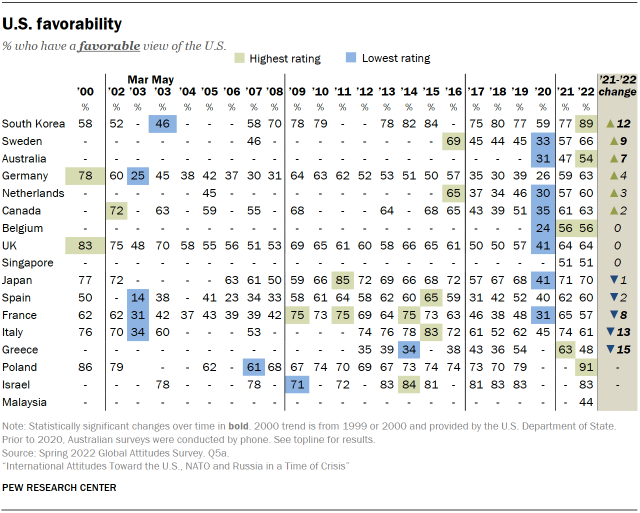
After all-time low ratings in many countries in 2020 and a sharp recovery in 2021, ratings of the U.S. remain high this year. A median of 61% across the 17 countries surveyed have a favorable view of the U.S., while only 35% have an unfavorable view.

In Poland and Israel, where more than eight-in-ten have a positive assessment of the U.S., this is the first time Pew Research Center has surveyed since the coronavirus outbreak and the end of Trump’s presidency. In Poland, ratings of the U.S. are now at a record high.

Nearly nine-in-ten also have a positive view of the U.S. in South Korea, a 12 percentage point increase since 2021, and the largest uptick in positive ratings since the previous year. Positive opinion has increased in only two other countries since 2021: Sweden (+9 points) and Australia (+7 points).

Views of the U.S. have stayed about the same in roughly half the countries surveyed in both 2021 and 2022, but have dropped since last year in Greece (-15 points), Italy (-13 points) and France (-8 points).

Publics in Singapore and Greece are roughly split in their views. Malaysia is the only country surveyed where a majority has a negative opinion of the U.S.

Table showing U.S. favorability among countries surveyed from 2000 to 2022

As we have seen consistently in Pew Research Center surveys, people who place themselves on the right of the ideological spectrum tend to view the U.S. more favorably than those on the left. For instance, in Greece, 60% of those on the right have a favorable view of the U.S., compared with only 22% of those on the left. This pattern can also be seen in Australia, the Netherlands, Sweden, the UK, Canada, Israel, Spain, South Korea, France and Belgium. (Ideology is not asked in Japan, Malaysia or Singapore.)

Key allies say the U.S. is a reliable partner to their country

Bar chart showing most countries surveyed view U.S. as a reliable partner

A median of 79% across the 17 countries surveyed say that the U.S. is a reliable partner to their country. Still, a median of just 19% say the U.S. is a very reliable partner. The share of the public who consider the U.S. a very reliable partner is largest in Israel, where 31% hold this view.

The share who says the U.S. is very or somewhat reliable has increased since 2021 in several nations. In South Korea, 83% express this opinion, up 25 points since 2021. Significant increases can also be seen in Sweden (+21 points), Australia (+16 points), Canada (+16 points), Germany (+11 points), Belgium (+10 points), the UK (+10 points), the Netherlands (+9 points) and Spain (+7 points). 

In every country, to the extent that people see the U.S. as reliable, they are much more likely to rate the U.S. positively overall. In the Netherlands, for example, among people who say the U.S. is a reliable partner to their country, 65% have a favorable view of the U.S. Among those who say the U.S. is not reliable, only 17% view the U.S. positively.

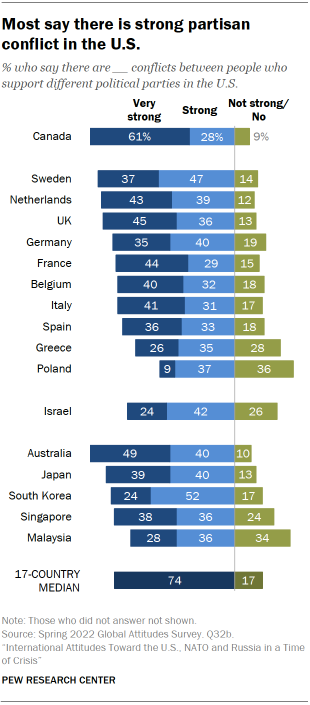
Majorities say partisan divisions are deep in U.S.

Bar chart showing that most people in countries surveyed say there is strong partisan conflict in the U.S.

People in the countries surveyed tend to rate the U.S. political system poorly, despite generally positive views of the country overall. For example, in our 2021 survey conducted shortly after the Jan. 6 attack on the U.S. Capitol, people were split over whether the U.S. political system works well or not. Most of those surveyed did not believe that democracy in the U.S. was a good example for other countries to follow. And in a 2017 survey, many people in Canada and Europe said they dislike American ideas about democracy.

In the current survey, a median of 74% across 17 countries say there are strong or very strong conflicts between people who support different political parties in the U.S. In seven nations, four-in-ten or more see very strong partisan conflicts in the U.S. Almost half in Australia and 61% in Canada see intense partisan divisions. 

Few people see only weak conflicts or no conflicts at all when it comes to party differences in the U.S., but it is notable that the share of people who did not respond to this question is relatively high in some countries, including as many as 18% in Poland.

Americans agree with others around the world that there are strong partisan conflicts in their country. In a 2021 survey, the U.S., along with South Korea, had the largest share of the public saying there were strong conflicts between people who support different political parties in their own society.

People who say there are very strong partisan conflicts in the U.S. are less likely than those who say there are not very strong conflicts to see the U.S. favorably in 12 countries. This difference is largest in Sweden: Among those who say there are not very strong conflicts (including strong, not strong and no conflicts at all), 75% have a favorable view of the U.S. Among those who say there are very strong partisan conflicts in the U.S., only 53% have a positive opinion of the country. Smaller differences in the same direction can be seen in Australia, the Netherlands, Canada, Malaysia, Italy, South Korea, Greece, Spain, Germany, France and Singapore. 

Many favorable on U.S. withdrawal from Afghanistan, yet say the withdrawal was poorly handled

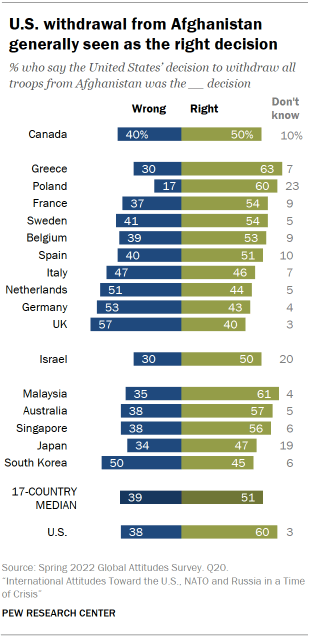
U.S. withdrawal from Afghanistan generally seen as the right decision

The U.S. decision to withdraw all American troops from Afghanistan in August 2021 is generally seen as having been the right decision. A median of 51% across 17 countries say this action was the right choice, compared with a median of 39% who say it was the wrong choice. In a few places, though, roughly one-in-five do not offer an opinion.

Half of Canadians feel the American decision to withdraw troops was the right one, while 40% say it was the wrong one.

In Europe, views of the withdrawal are more positive than negative. Half or more in six of the 10 nations surveyed feel favorably toward the U.S. withdrawal from Afghanistan. Views are split in Italy, while half or more are negative on the withdrawal in the Netherlands, Germany and the UK.

Half of Israelis say the U.S. troop withdrawal was the right decision, while 30% say it was the wrong decision and 20% do not offer an opinion.

Across the Asia-Pacific publics surveyed, views of the U.S. exit of Afghanistan are slightly more positive overall than in Europe. Majorities in Malaysia, Australia and Singapore look favorably on the decision. While 47% say the withdrawal was a good choice in Japan, 19% do not offer a view either way. And opinion is split in South Korea: 45% say the withdrawal was the right choice and 50% say it was the wrong choice.

Few across the world say the U.S. withdrawal from Afghanistan was handled well

Americans generally approve of the decision to withdraw U.S. troops from Afghanistan: 60% say this was the right decision. Democrats and Democratic-leaning independents (78%) are much more likely than Republicans and GOP leaners (39%) to hold this view.

Despite generally supportive views of the U.S. withdrawal of troops from Afghanistan, public opinion in the countries surveyed is less positive on how the withdrawal was handled. A median of 57% across the 17 countries polled say the withdrawal was not handled well, compared with a median of 33% who say it was handled well. Only in two countries do half or more feel favorably toward the handling of the U.S. exit from Afghanistan: Poland and Malaysia.

In Canada and Europe, views of how the American withdrawal was handled are more negative than positive. About six-in-ten Canadians and majorities in seven of the 10 European countries polled feel negatively toward the handling of the withdrawal, including two-thirds or more in Germany (67%) and the UK (77%).

Israelis view the U.S. handling of the withdrawal from Afghanistan more unfavorably than favorably: 51% say it was not handled well, compared with 31% who say it was handled well (19% did not offer an opinion).

In the Asia-Pacific region, negative views of how the U.S. dealt with its troop withdrawal range from 46% in Malaysia to 73% in Australia.

Those with more education more likely to say U.S. Afghanistan withdrawal was not handled well

Again, American views look similar to those in other parts of the world. Only around a third of Americans say the withdrawal from Afghanistan was handled well, though this share is higher among Democrats (46%) than Republicans (15%).

Those with more education (postsecondary degree or above) are more likely to say the U.S. withdrawal from Afghanistan was not handled well, compared with those with less education (secondary or below) in most countries surveyed. In Belgium, for example, those with more education are 20 percentage points more likely to have a negative view than those with less education.

Less confidence in Biden in his second year as president

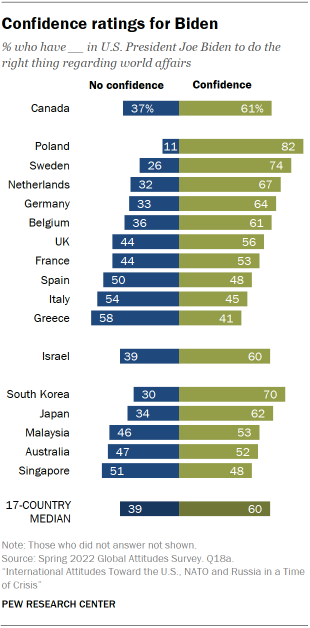
Confidence ratings for Biden

Along with a positive opinion of the U.S., most in the nations surveyed also have trust in the U.S. president. A median of 60% across 17 countries have confidence in Biden to do the right thing in world affairs.

Poles stand out for their particularly high trust in Biden (82%). Not only is it higher than any other country in the current survey, but it is also a record high for trust in the U.S. president in Poland. The last time this question was asked in 2019, 51% of Poles had confidence in Trump’s handling of international affairs. The previous high was in 2015, when 64% expressed confidence in Obama.

People in Sweden, South Korea, the Netherlands and Germany also have relatively high levels of confidence in Biden to do the right thing on the international stage. But not all countries have positive ratings of the U.S. president: Half or more lack confidence in Biden in Spain, Singapore, Italy and Greece.

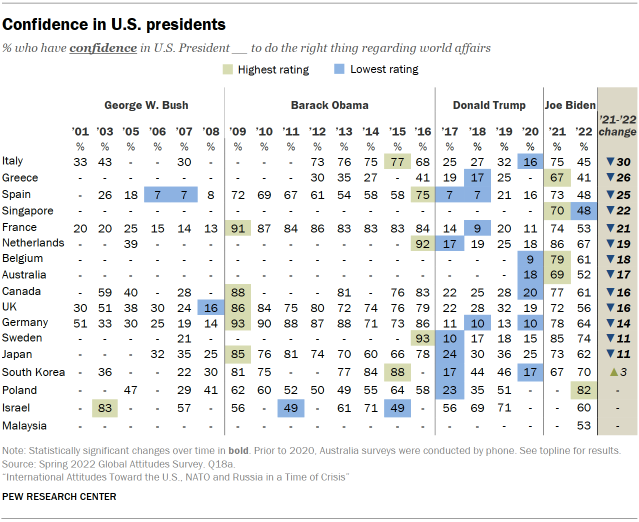
While still relatively high in most places, trust in the U.S. president has dropped sharply since 2021 in nearly every country surveyed. Some initial excitement about a new president may wane after their first year, but the decrease in trust since 2021 is much larger than any small dips Obama saw in 2010 or 2011 in the same countries.

Despite double-digit decreases in most countries, confidence in the U.S. president is nowhere near the lowest it has been in the past. (The exception is Singapore, which was surveyed for the first time last year.) Ratings for Biden are still higher than those for Trump or Bush in every country except Israel.

Israeli views about U.S. presidents have often differed from attitudes in Europe and the Asia-Pacific region. In most other countries polled, confidence in the U.S. president was highest while Obama was in office and lowest during Trump’s administration. In Israel, Obama received both the highest (2014) and lowest (2011 and 2015) ratings. Confidence in Trump was similar, if somewhat higher, than trust in Obama.

Table showing confidence in U.S. Presidents Bush, Obama, Trump and Biden across countries surveyed
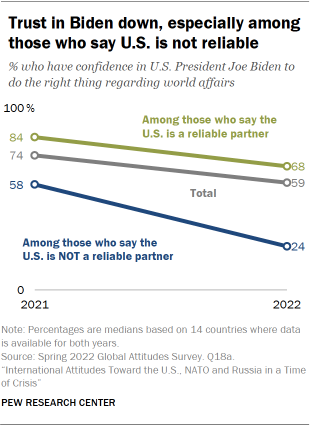
Trust in Biden down, especially among those who say U.S. is not reliable

Changes in confidence over time are related to perceptions of America’s reliability as a partner. While most groups have shown a decrease in trust in Biden since 2021, the change is largest among people who think the U.S. is not a reliable partner to their country. Across the 14 countries surveyed in both 2021 and 2022, confidence in Biden has plummeted among those who think the U.S. is not reliable, from a median of 58% in 2021 to just 24% now. But among those who say the U.S. is reliable, the drop in confidence in the U.S. president is much smaller, from a median of 84% in 2021 to 68% in the current survey.

In every country except Germany, confidence in Biden to do the right thing in world affairs is much lower among people who think America’s withdrawal from Afghanistan was handled poorly. For example, among Canadians who think the withdrawal was handled well, 75% trust Biden when it comes to international affairs. Among Canadians who think the withdrawal was not handled well, only 54% trust Biden.

2. Positive ratings for NATO

Russia’s invasion of Ukraine has brought renewed attention to the NATO alliance, and has even led nations such as Sweden and Finland to apply for NATO membership. While the organization is consistently seen favorably across many member countries, positive opinion of NATO is up in several places.

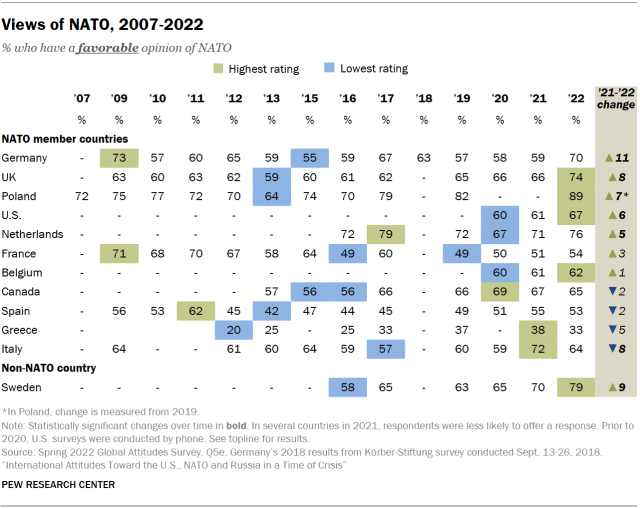
A median of 65% across 11 member states have a favorable view of NATO, and 26% have an unfavorable view. Seven-in-ten or more feel positively toward NATO in the Netherlands, the UK and Germany. Americans are more positive on NATO than negative, though partisan divides shape opinion. And in Poland, a particularly prominent member of NATO since Russia’s invasion of Ukraine, 89% feel favorably toward the alliance.

In Greece, favorable views of NATO have never risen above roughly four-in-ten (38% in 2021). Greece is the only nation in the current survey with a majority expressing negative views of the alliance.

Sweden is not currently a member of NATO, but Swedes are very favorable toward the organization. About eight-in-ten hold a positive opinion, while 18% hold a negative one (the survey was conducted before Sweden submitted its application to join NATO).

Favorable views of NATO have increased in several countries from when this question was last asked. In Germany, for example, positive opinion of the alliance is up 11 percentage points from 2021. Positive views have increased significantly in the UK, Poland, the U.S., the Netherlands and nonmember state Sweden.

Among NATO member countries, British, Polish and Belgian views of NATO are at a record high since the question was first asked. And in non-NATO member Sweden, the 79% who have a favorable view of the alliance is also an all-time high.

Ratings of NATO are down significantly, however, in Italy, from a record high of 72% in spring 2021 to 64% now. In Greece, positive views have also fallen somewhat from an all-time high in 2021.

Table showing views of NATO from 2007 to 2022 in 12 countries
Swedes grew more favorable toward NATO during fieldwork

In Sweden, views of NATO increased over the course of the survey period, with very favorable opinions of the alliance increasing substantially. Fieldwork began the day Russia invaded Ukraine (Feb. 24) and in the early weeks, around three-quarters saw the alliance positively, including around one-in-five who said they had very positive views. By early April, 84% of Swedes said they had favorable views of NATO, including around three-in-ten who had very favorable views.  

As observed in past surveys, those on the ideological right in some countries are more likely than those on the left to give NATO a positive rating. This difference is largest in Greece, where NATO favorability is typically lower than among the other member states included in the poll. In Greece, those who place themselves on the ideological right are 22 percentage points more likely to have a favorable opinion of NATO than those on the ideological left. Significant differences are also present in Spain, nonmember Sweden, France and the UK. In Canada and the U.S., this pattern is reversed: Those on the left are more likely to express a positive view of the alliance than those on the right.

3. Ratings for Russia drop to record lows

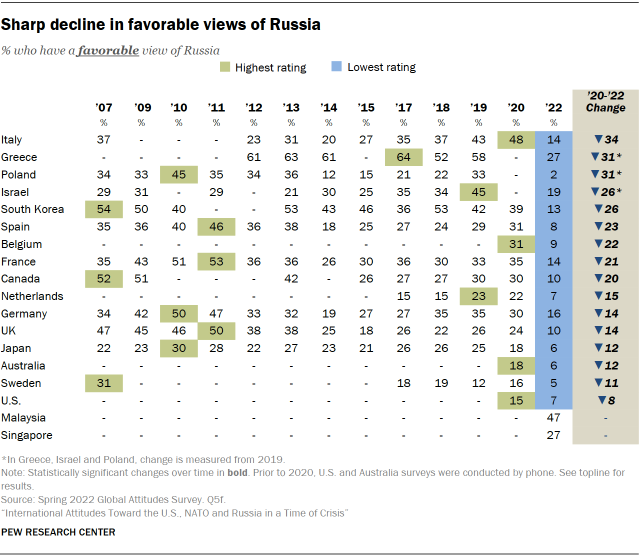
A median of 85% across 18 countries express an unfavorable opinion of Russia, with majorities in most nations saying they have a very unfavorable opinion of Russia.

In almost every country surveyed, at least seven-in-ten have an unfavorable opinion of Russia. Malaysia is the only country where this is not true; instead, Malaysian opinion is more mixed, with only half saying this. Poles are especially critical of Russia: 97% have an unfavorable opinion, including 91% with a very unfavorable view.

There has been a steep decline in Russian favorability since the question was last asked in 2020, with record low shares in all 18 countries expressing positive opinions of Russia. In nearly every country where there is trend data available, favorability for Russia has dropped by double digits. In Italy, Greece and Poland, positive views of Russia have declined by more than 30 percentage points since the question was last asked (2020 for Italy and 2019 for Greece and Poland).

Sharp decline in favorable views of Russia

Confidence in Putin reaches a 20-year low in most countries

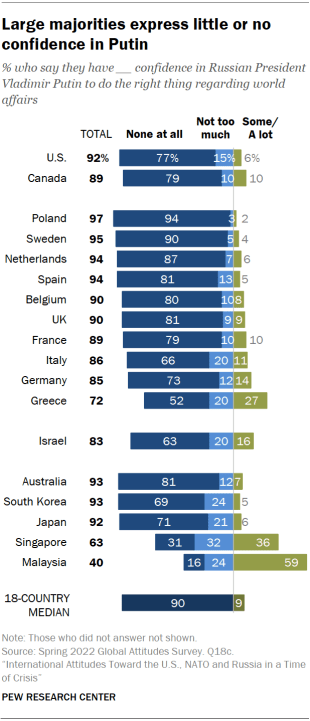
Large majorities express little or no confidence in Putin

Consistent with trends for Russian favorability, majorities in almost every country surveyed express little confidence in Russian President Vladimir Putin. Across 18 nations, a median of 90% say they do not have confidence in Putin to do the right thing in world affairs, and nearly eight-in-ten (78%) express no confidence at all in Putin.

Malaysia is again an exception to the overall trend, as it is the only country surveyed where a majority expresses confidence in the Russian leader.

Over the last two decades, ratings for Putin have been on a downward trend in many countries, but in 2022, these numbers reached record lows in every nation where trends are available, with double-digit declines in most since the last survey year.                                  

In general, Europeans who support right-wing populist parties in their country are more likely to have confidence in Putin to do the right thing in world affairs. For example, among Greeks who have a favorable view of the Greek Solution party, 55% trust Putin’s handling of international affairs; only 18% trust Putin among those who have an unfavorable view of the party. Similar patterns can be seen among supporters of right-wing populist parties in Germany (Alternative for Germany), the Netherlands (Forum for Democracy and Party for Freedom), the UK (Reform UK), France (National Rally) and Sweden (Sweden Democrats). Yet, while right-wing populist supporters rate Putin more positively than their counterparts, confidence in Putin has decreased more drastically among this group since 2021. In Sweden, for example, 9% of Sweden Democrats supporters trust Putin, down from 30% in 2021. Among those who do not support Sweden Democrats, confidence in Putin was already very low in 2021 (8%) and therefore did not drop as much this year (2%). (For more information on European populist parties, see Appendix.)

A similar pattern exists regarding general ideological leanings. There were large ideological divides in 2021 on attitudes toward Putin, with those on the right of the political spectrum expressing more confidence in him than those on the left. In the current survey, confidence in Putin has decreased more starkly among those on the right, and in many countries both groups have similarly poor views of the Russian president.

Opinion of Putin at record lows in most countries

4. High confidence in Biden, Macron and Scholz, but low trust in Xi and Putin

To place the ratings of Biden and Putin in perspective, the survey also asked people to rate three other major world leaders: French President Emmanuel Macron, German Chancellor Olaf Scholz and Chinese President Xi Jinping.

Similar to ratings of Biden, a median of 62% have confidence in Macron and 59% have confidence in Scholz to do the right thing in world affairs. Ratings of both European leaders are particularly high in Sweden, the Netherlands and Germany, and more than half in nearly every country surveyed have confidence in each leader. The exceptions are Israel and Poland, where only around four-in-ten trust either to do the right thing, and Greece, where a similarly small share has confidence in Scholz.

Bar chart showing confidence in Biden, Putin, Macron, Scholz and Xi among countries surveyed

In most countries, trust in Scholz is much lower than it was in former German Chancellor Angela Merkel during her last year in office. Fewer people express an opinion about Scholz in general in most places, but this only partly explains the lower levels of trust. For example, more people in Spain did not provide a rating of Scholz this year (6%) compared with Merkel last year (1%), but the difference in trust is much larger than this gap: While 85% had confidence in Merkel in 2021, just 58% now say the same about Scholz, a 27 percentage point difference.

Confidence in Macron, who was reelected during the fieldwork period of the survey, has remained steady since last year in most places. However, more people in Italy, Belgium, South Korea, the UK, Australia and Poland now say they have confidence in the French president.

A median of just 18% across the 18 countries surveyed have confidence in Xi to do the right thing in world affairs. But only half as many have confidence the Russian president (a median of 9%). Overall, Putin is the least trusted of all leaders included in the survey, with more people expressing confidence in Xi, Scholz, Macron and Biden in every country polled. Malaysia and Singapore stand out, however, for their positive assessments of both Xi and Putin.

While confidence in Putin has decreased since 2021, confidence in Xi has stayed roughly the same in most of the countries surveyed. The largest changes in ratings for Xi are in Poland and Israel, where this question was last asked in 2019. Confidence in the Chinese president has decreased over that period in both countries, from 35% to 20% in Israel and 18% to 11% in Poland.

There are a few differences among age groups regarding attitudes toward international leaders. In many countries, younger adults are less likely to have confidence in Biden. In Belgium for example, 73% of people ages 50 and older trust Biden when it comes to his handling of international affairs, compared with 49% of people ages 18 to 29. A similar pattern can be seen in Germany, Canada, the Netherlands, Spain, Australia, South Korea, Sweden, Japan and France. Older adults also have more positive assessments of Macron in 11 countries. In contrast, Putin gets more positive reviews from younger adults in eight countries. For instance, 22% of young Germans have confidence in Putin, compared with only 10% of Germans ages 50 and older.
Acknowledgments

This report is a collaborative effort based on the input and analysis of the following individuals.

Richard Wike, Director, Global Attitudes Research
Janell Fetterolf, Senior Researcher
Moira Fagan, Research Analyst
Sneha Gubbala, Research Assistant

Dorene Asare-Marfo, Panel Manager
Sara Atske, Associate Digital Producer
Alexandra Castillo, Research Methodologist
Janakee Chavda, Editorial Assistant
Laura Clancy, Research Assistant
Aidan Connaughton, Research Assistant
Shannon Greenwood, Digital Producer
Christine Huang, Research Analyst
Michael Keegan, Senior Information Graphics Designer
Hannah Klein, Communications Manager
Gar Meng Leong, Communications Associate
Clark Letterman, Senior Survey Manager
Gracie Martinez, Senior Administrative Coordinator
Patrick Moynihan, Associate Director, International Research Methods
Jacob Poushter, Associate Director, Global Attitudes Research
Laura Silver, Senior Researcher
Adam Wolsky, Research Methodologist

Appendix: Classifying European political parties

Classifying parties as populist

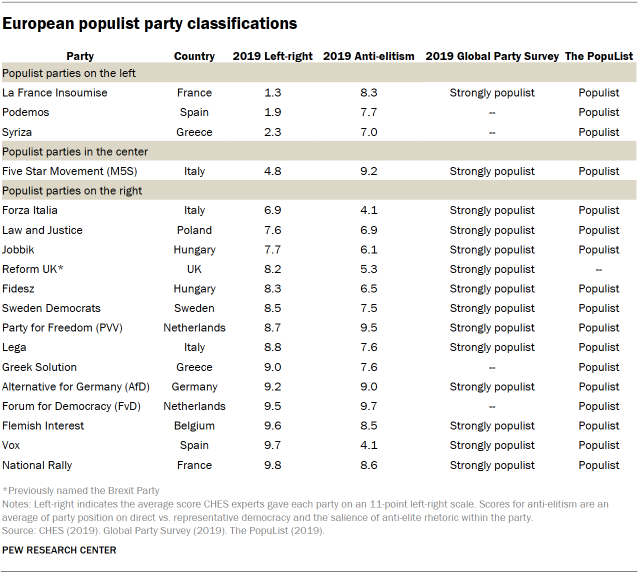
Although experts generally agree that populist political leaders or parties display high levels of anti-elitism, definitions of populism vary. We use three measures to classify populist parties: anti-elite ratings from the 2019 Chapel Hill Expert Survey (CHES), Norris’ Global Party Survey and The PopuList. We define a party as populist when at least two of these three measures classify it as such.   

CHES, which was conducted from February to May 2020, asked 421 political scientists specializing in political parties and European integration to evaluate the 2019 positions of 277 European political parties across all European Union member states. CHES results are regularly used by academics to classify parties with regard to their left-right ideological leanings, their key party platform positions and their degree of populism, among other things.

We measure anti-elitism using an average of two variables in the CHES data. First, we used “PEOPLE_VS_ELITE,” which asked the experts to measure the parties with regard to their position on direct vs. representative democracy, where 0 means that the parties support elected officeholders making the most important decisions and 10 means that “the people,” not politicians, should make the most important decisions. Second, we used “ANTIELITE_SALIENCE,” which is a measure of the salience of anti-establishment and anti-elite rhetoric for that particular party, with 0 meaning not at all salient and 10 meaning extremely salient. The average of these two measures is shown in the table below as “anti-elitism.” In all countries, we consider parties that score at or above a 7.0 as “populist.”

The Global Party Survey, which was conducted from November to December 2019, asked 1,861 experts on political parties, public opinion, elections and legislative behavior to evaluate the ideological values, issue position and populist rhetoric of parties in countries on which they are an expert, classifying a total of 1,051 parties in 163 countries. We used “TYPE_POPULISM,” which categorizes populist rhetoric by parties. We added only “strongly populist” parties using this measure. In Italy, experts were asked to categorize the Center-Right coalition instead of individual parties within the coalition. The coalition includes Lega and Forza Italia. For both parties, we have used the coalition rating of “strongly populist.”

The PopuList is an ongoing project to classify European political parties as populist, far right, far left and/or euroskeptic. The project specifically looks at parties that “obtained at least 2% of the vote in at least one national parliamentary election since 1998.” It is based on collaboration between academic experts and journalists. The PopuList classifies parties that emphasize the will of the people against the elite as populist.1

Reform UK, formerly the Brexit Party, is only classified as populist on one measure but is still included for analysis in the report. It is not included in the PopuList and does not meet our anti-elite CHES threshold of 7.0, but is considered a right-wing populist party by the Global Party Survey and other experts.

Classifying parties as left, right or center

We can further classify these traditional and populist parties into three groups: left, right and center. When classifying parties based on ideology, we relied on the variable “LRGEN” in the CHES dataset, which asked experts to rate the positions of each party in terms of its overall ideological stance, with 0 meaning extreme left, 5 meaning center and 10 meaning extreme right. We define left parties as those that score below 4.5 and right parties as those above 5.5. Center parties have ratings between 4.5 and 5.5.

European populist party classifications

Methodology

Pew Research Center’s Spring 2022 Global Attitudes Survey

Results for the survey are based on telephone, face-to-face and online interviews conducted under the direction of Gallup, Langer Research Associates and Social Research Centre. The results are based on national samples, unless otherwise noted. More details about our international survey methodology and country-specific sample designs are available here. Results for the U.S. survey are based on data from the American Trends Panel.

The American Trends Panel survey methodology

Overview

The American Trends Panel (ATP), created by Pew Research Center, is a nationally representative panel of randomly selected U.S. adults. Panelists participate via self-administered web surveys. Panelists who do not have internet access at home are provided with a tablet and wireless internet connection. Interviews are conducted in both English and Spanish. The panel is being managed by Ipsos.

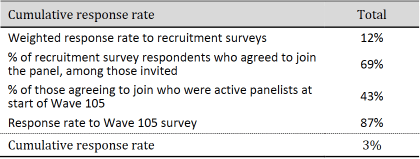
Data in this report is drawn from the panel wave conducted from March 21 to March 27, 2022. A total of 3,581 panelists responded out of 4,120 who were sampled, for a response rate of 87%. The cumulative response rate accounting for nonresponse to the recruitment surveys and attrition is 3%. The break-off rate among panelists who logged on to the survey and completed at least one item is 1%. The margin of sampling error for the full sample of 3,581 respondents is plus or minus 2.3 percentage points.

Panel recruitment

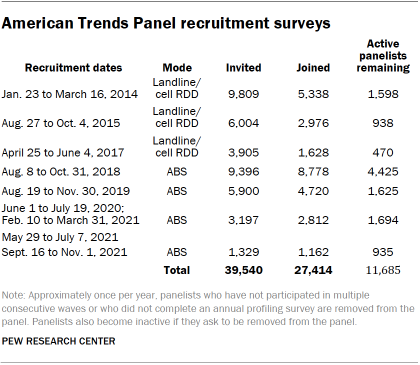
The ATP was created in 2014, with the first cohort of panelists invited to join the panel at the end of a large, national, landline and cellphone random-digit-dial survey that was conducted in both English and Spanish. Two additional recruitments were conducted using the same method in 2015 and 2017, respectively. Across these three surveys, a total of 19,718 adults were invited to join the ATP, of whom 9,942 (50%) agreed to participate.

American Trends Panel recruitment surveys

In August 2018, the ATP switched from telephone to address-based recruitment. Invitations were sent to a stratified, random sample of households selected from the U.S. Postal Service’s Delivery Sequence File. Sampled households receive mailings asking a randomly selected adult to complete a survey online. A question at the end of the survey asks if the respondent is willing to join the ATP. Starting in 2020, another stage was added to the recruitment. Households that do not respond to the online survey are sent a paper version of the questionnaire, $5 and a postage-paid return envelope. A subset of the adults returning the paper version of the survey are invited to join the ATP. This subset of adults receive a follow-up mailing with a $10 pre-incentive and invitation to join the ATP.

Across the four address-based recruitments, a total of 19,822 adults were invited to join the ATP, of whom 17,472 agreed to join the panel and completed an initial profile survey. In each household, the adult with the next birthday was asked to go online to complete a survey, at the end of which they were invited to join the panel. Of the 27,414 individuals who have ever joined the ATP, 11,685 remained active panelists and continued to receive survey invitations at the time this survey was conducted.

The U.S. Postal Service’s Delivery Sequence File has been estimated to cover as much as 98% of the population, although some studies suggest that the coverage could be in the low 90% range.2 The American Trends Panel never uses breakout routers or chains that direct respondents to additional surveys.

Sample design

This study featured a stratified random sample from the ATP. The overall target population for this survey was non-institutionalized persons ages 18 and older, living in the U.S., including Alaska and Hawaii.

Questionnaire development and testing

The questionnaire was developed by Pew Research Center in consultation with Ipsos. The web program was rigorously tested on both PC and mobile devices by the Ipsos project management team and Center researchers. The Ipsos project management team also populated test data that was analyzed in SPSS to ensure the logic and randomizations were working as intended before launching the survey.

Incentives

All respondents were offered a post-paid incentive for their participation. Respondents could choose to receive the post-paid incentive in the form of a check or a gift code to Amazon.com or could choose to decline the incentive. Incentive amounts ranged from $5 to $20 depending on whether the respondent belongs to a part of the population that is harder or easier to reach. Differential incentive amounts were designed to increase panel survey participation among groups that traditionally have low survey response propensities.

Data collection protocol

The data collection field period for this survey was March 21 to March 27, 2022. Postcard notifications were mailed to all ATP panelists with a known residential address on March 21, 2022. 

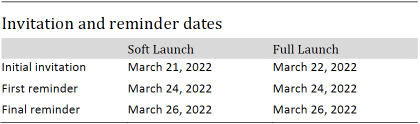
Invitations were sent out in two separate launches: Soft Launch and Full Launch. Sixty panelists were included in the soft launch, which began with an initial invitation sent on March 21, 2022. The ATP panelists chosen for the initial soft launch were known responders who had completed previous ATP surveys within one day of receiving their invitation. All remaining English- and Spanish-speaking panelists were included in the full launch and were sent an invitation on March 22, 2022.

All panelists with an email address received an email invitation and up to two email reminders if they did not respond to the survey. All ATP panelists that consented to SMS messages received an SMS invitation and up to two SMS reminders.

Invitation and reminder dates

Data quality checks

To ensure high-quality data, the Center’s researchers performed data quality checks to identify any respondents showing clear patterns of satisficing. This includes checking for very high rates of leaving questions blank, as well as always selecting the first or last answer presented. As a result of this checking, four ATP respondents were removed from the survey dataset prior to weighting and analysis.

Weighting

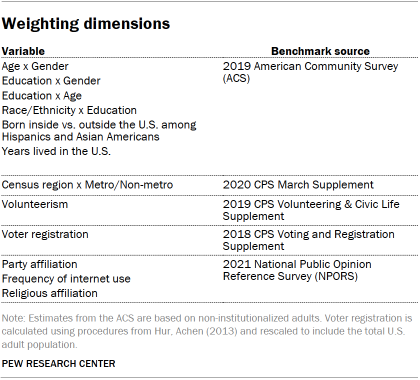
Weighting dimensions

The ATP data is weighted in a multistep process that accounts for multiple stages of sampling and nonresponse that occur at different points in the survey process. First, each panelist begins with a base weight that reflects their probability of selection for their initial recruitment survey. The base weights for panelists recruited in different years are scaled to be proportionate to the effective sample size for all active panelists in their cohort and then calibrated to align with the population benchmarks in the accompanying table to correct for nonresponse to recruitment surveys and panel attrition. If only a subsample of panelists was invited to participate in the wave, this weight is adjusted to account for any differential probabilities of selection.

Among the panelists who completed the survey, this weight is then calibrated again to align with the population benchmarks identified in the accompanying table and trimmed at the 1st and 99th percentiles to reduce the loss in precision stemming from variance in the weights. Sampling errors and tests of statistical significance take into account the effect of weighting.

Some of the population benchmarks used for weighting come from surveys conducted prior to the coronavirus outbreak that began in February 2020. However, the weighting variables for panelists recruited in 2021 were measured at the time they were recruited to the panel. Likewise, the profile variables for existing panelists were updated from panel surveys conducted in July or August 2021.

This does not pose a problem for most of the variables used in the weighting, which are quite stable at both the population and individual levels. However, volunteerism may have changed over the intervening period in ways that made their 2021 measurements incompatible with the available (pre-pandemic) benchmarks. To address this, volunteerism is weighted using the profile variables that were measured in 2020. For all other weighting dimensions, the more recent panelist measurements from 2021 are used.

For panelists recruited in 2021, plausible values were imputed using the 2020 volunteerism values from existing panelists with similar characteristics. This ensures that any patterns of change that were observed in the existing panelists were also reflected in the new recruits when the weighting was performed.

The following table shows the unweighted sample sizes and the error attributable to sampling that would be expected at the 95% level of confidence for different groups in the survey.

Table showing the unweighted sample sizes and error attributable to sampling

Sample sizes and sampling errors for other subgroups are available upon request. In addition to sampling error, one should bear in mind that question wording and practical difficulties in conducting surveys can introduce error or bias into the findings of opinion polls.

Dispositions and response rates

Final dispositions
Cumulative response rate