What Do Americans Know About International Affairs?
Liberal Democrats, conservative Republicans more knowledgeable than others
Pew Research Center conducted this study to explore what Americans know about international affairs, how this varies across groups in society and how international knowledge is related to attitudes about foreign countries, foreign leaders and more. The measure of international knowledge that we developed is based on 12 questions and covers facts about global leaders, international institutions and geography, among other topics. For more on this measure, see Appendix A or “How we designed a scale to measure Americans’ knowledge of international affairs.”
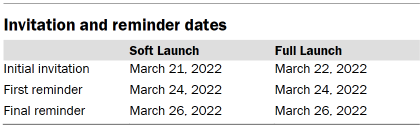
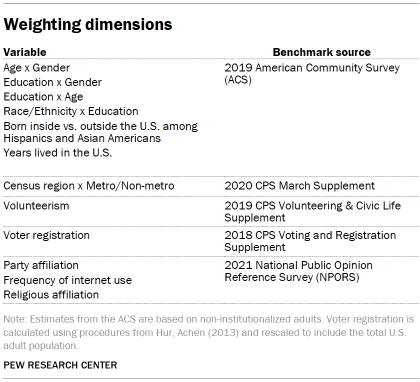
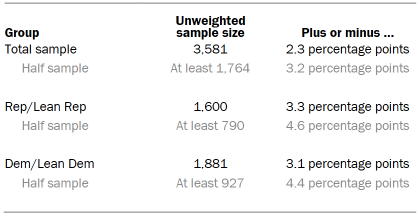
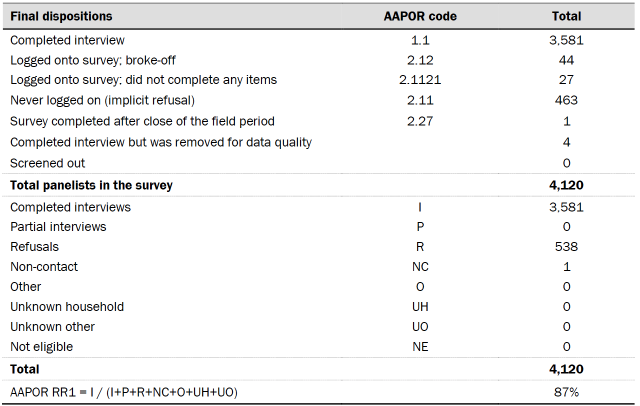
For this analysis, we surveyed 3,581 U.S. adults from March 21 to 27, 2022. Everyone who took part in this survey is a member of the Center’s American Trends Panel (ATP), an online survey panel that is recruited through national, random sampling of residential addresses. This way nearly all U.S. adults have a chance of selection. The survey is weighted to be representative of the U.S. adult population by gender, race, ethnicity, partisan affiliation, education and other categories. Read more about the ATP’s methodology.
Here are the questions used for the report, along with responses and its methodology.
Before you read the report
Test your international knowledge by taking the interactive quiz. The short quiz tests your knowledge of questions recently asked in a national poll. After completing the quiz, you can compare your score with the general public and with people like yourself.
Americans know a great deal about certain global leaders and institutions. For example, nearly eight-in-ten U.S. adults can look at a photo of Kim Jong Un and correctly identify him as the leader of North Korea, and nearly two-thirds know that Boris Johnson is the current prime minister of the United Kingdom. A slim majority also know that Ukraine is not a member of the North Atlantic Treaty Organization (NATO).
However, as a new Pew Research Center survey shows, Americans are less familiar with other topics. Despite the U.S. government labeling the events in Xinjiang, China, as genocide, only around one-in-five Americans are aware that it is the region in China with the most Muslims per capita. And only 41% can identify the flag of the second most populous country in the world, India.


On average, Americans give more correct than incorrect answers to the 12 questions in the study. The mean number of correct answers is 6.3, while the median is 7. But the survey finds that levels of international knowledge vary based on who is answering. Americans with more education tend to score higher, for example, than those with less formal education. Men also tend to get more questions correct than women. Older Americans and those who are more interested in foreign policy also tend to perform better.
Political party groups are roughly similar in their overall levels of international knowledge, although conservative Republicans and liberal Democrats tend to score higher on the scale than do their more moderate counterparts.
International knowledge is also related to people’s general interest in foreign policy: Those who report being very or somewhat interested in the topic answer a mean of 7.4 questions correctly, compared with only 4.6 correct questions for those who are not too or not at all interested in foreign policy. Those who follow international news also tend to have higher international knowledge than those who are less engaged. Those who have visited at least one country outside of the United States also score higher on the international knowledge scale than those who have not traveled abroad, even after accounting for differences in education and income.
Part of the goal of the survey was simply to understand these factors: what Americans know about international affairs and, more specifically, how knowledge varies across demographic subgroups. But another goal of the survey was also to understand how knowledge might affect attitudes.
We find that people who know more about an issue often have different views about that issue. For example, people who are aware that Ukraine is not a member of NATO are more likely to have a favorable view of NATO and more likely to say that the U.S. benefits a great deal from its membership in the organization relative to those who do not know Ukraine is not a member nation. This same group is also more likely to have negative views of Russia, to have no confidence at all in Russian President Vladimir Putin and to describe Russia as an enemy.
Similarly, the survey also finds that those who know the capital of Afghanistan are more critical of the U.S. withdrawal and how it was handled than those who do not know the capital. Those who are aware of where the U.S. Embassy in Israel is located (following the 2018 move) are also more likely to say U.S.-Israel relations are good than those who do not know. But there are few differences between the 17% of Americans who know that Xinjiang is the region of China with the most Muslims per capita and those who do not when it comes to views of China or Chinese President Xi Jinping.
Beyond the issue of how specific knowledge questions are related to attitudes about that topical area – e.g., how knowledge about NATO is related to views about NATO – we can also explore, more generally, whether people who have more international knowledge feel differently about myriad global issues than those with less international knowledge. To do this, we can use the entire 12-question scale, breaking people into groups of high (those who answered 9-12 questions correctly), medium (5-8 questions) and low knowledge (0-4 questions). Around a third of the American public falls into each of these three groups, respectively.

Generally speaking, we see that international knowledge is related to attitudes about a host of issues. People with higher levels of knowledge have more positive views of the European Union (EU), NATO and Israel. They also have more confidence in Ukrainian President Volodymyr Zelenskyy, French President Emmanuel Macron, German Chancellor Olaf Scholz and U.S. President Joe Biden.

When it comes to both Russia and China, though, those with higher levels of knowledge tend to be more critical. They are more likely to see the two countries unfavorably, to describe both countries as enemies of the U.S. and to have little or no confidence in Putin and Xi. And, whereas Americans overall are equally likely to describe China and the U.S. as the world’s top economy, people with high levels of international knowledge are significantly more likely than those with less knowledge to say the U.S. is the world’s leading economic power – mirroring the gross domestic product assessments compiled by the International Monetary Fund.
These are among the key findings of a new survey conducted by Pew Research Center on the Center’s nationally representative American Trends Panel among 3,581 adults from March 21 to 27, 2022. The survey also finds that when it comes to the four questions that we have previously asked, Americans’ level of international knowledge is similar – or higher – than it was in the past.1 In the case of identifying the leader of North Korea or the euro currency symbol, American knowledge has not changed significantly since the questions were last asked in 2015 and 2013, respectively. But when it comes to identifying the U.S. secretary of state, more can identify Secretary Antony Blinken (51%) than could identify Secretary Rex Tillerson (44%) in June 2017.2 More Americans are also able to identify the British prime minister now (65%) than were able to do so in 2017 (56%) – though this most recent survey was conducted following a scandal that kept Johnson in the news.
International knowledge varies markedly across demographic groups
Americans with more education tend to score higher on the international knowledge scale compared with those with less education. College graduates get an average of 8.0 out of 12 international knowledge questions right, including around half (49%) who get at least nine of the 12 correct. Within this group, people who have a postgraduate degree do especially well, averaging 8.2 questions correct, including 55% who get at least nine questions right.
Scores are lower among Americans with less education. Among people who have some college experience, the average number of correct answers is 6.3. Those who have a high school diploma or less education get 5.0 questions right, on average. These large education differences are consistent with past Center surveys on science knowledge and religious knowledge.

Men tend to perform better on the international knowledge scale than women
Overall, men tend to score higher on the knowledge scale than women. On average, men answer 7.3 questions correctly out of 12, compared with an average of 5.4 correct answers for women. In fact, for each of the 12 questions individually, a higher share of men than women answer correctly. This mirrors previous findings for both scientific knowledge and religious knowledge in which men tended to score higher than women.
Multiple studies have found that men are more likely than women to guess on knowledge questions, even if they don’t know the answer. If given the option, women are often more likely than men to say they don’t know. Indeed, on each of the 12 items tested in this survey, women are more likely than men to say they are not sure of the correct answer. On only four questions are women more likely to give an incorrect answer.

While men are more likely than women to answer each item correctly, this gap is larger on some questions than others. The largest gap between men and women is identifying the predecessor of the USMCA trade agreement. Nearly three-in-four men correctly answer NAFTA, compared with 44% of women. About half (52%) of women say they are not sure which trade agreement preceded the USMCA.
Older Americans have higher levels of international knowledge than younger ones
Overall, compared with younger Americans, older Americans – those ages 65 and older – perform best on the international knowledge scale, averaging 6.7 questions correctly relative to 6.2 for those ages 50 to 64, 6.4 for those 30 to 49, and 5.8 for those under 30. Around a third of this oldest age group answers at least nine of the 12 questions correctly, placing them in the “high” knowledge category, while only around a quarter of the youngest age group falls into the same group.
Across nearly all of the 12 questions, older adults are more likely than younger adults to answer them correctly. The gap is largest when it comes to three specific questions: current location of the U.S. embassy in Israel, prime minister of the UK and secretary of state of the U.S. In all three cases, the oldest age group is more than 20 percentage points more likely to answer correctly than the youngest group. But there are also three questions where younger adults noticeably outperform their older counterparts. Two of them are questions that relate to pictures: one identifying the euro symbol and the other identifying the Indian flag. Younger adults are also more likely to correctly identify the region of China with the highest per capita Muslim population.
While younger people are somewhat more likely to say they are not sure when it comes to six of the questions, they are also more likely to give incorrect answers for seven of the 12 questions. For example, when it comes to identifying the current U.S. secretary of state, 51% of those under age 30 said they were not sure, compared with 37% of those 30 to 49 and around three-in-ten or fewer of those ages 50 and older. But this youngest age group is also more likely to be wrong: 19% chose an incorrect multiple-choice answer from the list provided, while only 10% of those ages 65 and older chose an incorrect answer.

International knowledge highest at ends of the political spectrum

Republicans and Democrats have roughly the same levels of international knowledge. On the 12-point scale, Republicans and Republican-leaning independents answer an average of 6.5 questions correctly, while Democrats and Democratic leaners get an average of 6.4 right.
There are, however, a few questions where members of one party perform markedly better than the other. More Republicans and GOP leaners know that the USMCA trade agreement replaced NAFTA and that the U.S. Embassy in Israel moved to Jerusalem in 2018 – both changes made under former U.S. President Donald Trump and pillars of his international policy. Republicans are also more likely to know the capital of Afghanistan. On the other hand, Democrats and Democratic-leaning independents are more likely to correctly identify the flag of India and the euro symbol.

Generally, though, there are greater differences within parties than between them. Those at the ends of the political spectrum – conservative Republicans and liberal Democrats – score more than a point higher, on average, than the more moderate groups. While these groups both tend to be more likely to follow international news and interested in foreign affairs, this difference in knowledge persists even after statistically controlling for these factors. Liberal Democrats answer all but one of the 12 questions correctly at a higher rate than conservative and moderate Democrats. The same is true for conservative Republicans relative to liberal and moderate Republicans on three-quarters of the scale items. These patterns are largely consistent with measures of scientific knowledge conducted by the Center.
International engagement tied to higher international knowledge
Perhaps unsurprisingly, Americans who are more internationally engaged on a variety of fronts are more likely to have higher international knowledge than Americans who are not as engaged. For example, Americans who say they follow international news very or somewhat closely answer an average of 7.3 questions correctly; Americans who follow international news less closely answer only 5.2 questions correctly, on average. Only when it comes to identifying the flag of India are those who follow international news closely and those who do not equally likely to answer correctly. Following international news is a significant factor in international knowledge even after controlling for education and other key demographics including age, race and gender.

Interest in foreign policy also plays a part in international knowledge. Those who say they are very or somewhat interested in foreign policy answer a mean of 7.4 questions correctly, compared with only 4.6 correct questions for those who are not too or not at all interested in foreign policy. In some cases, the difference between those who are interested in foreign policy and those who are not can be quite large. On the question of which trade agreement the USMCA replaced, 72% of those interested in foreign policy correctly answer NAFTA, while only 37% of those not interested in foreign policy are able to identify the correct answer. Once again, interest in foreign policy remains a significant factor in international knowledge even after controlling for education.3
These differences don’t just extend to hypothetical interest. Americans who have visited at least one other country outside of the U.S. answer an average of 7.1 questions correctly, compared with an average score of 4.3 correct for those who have never visited another country. And while international travel is associated with more education and higher incomes, this gap is significant even when controlling for those factors.
International knowledge and attitudes about foreign countries and leaders
Based on the individual performance of the 12 international knowledge questions, we are able to divide people into three roughly equal groups: those who answered at least nine of the 12 questions correctly (31%) are termed “high” knowledge; those who answered five to eight questions correctly (37%) or the “medium” knowledge group; and those who answered fewer than five questions correctly (32%) or the “low” knowledge group.


Performance on the international knowledge scale relates to views of other countries and multinational entities. Those who have a high score on the knowledge scale are more likely than those with a low score to hold favorable views of the EU, NATO and Israel. For example, 73% of those who answer at least nine of 12 questions correctly hold a favorable view of NATO, compared with 58% of those who answer four or fewer questions correctly. However, knowledge is not related to views of the United Nations: Those with high levels of international knowledge are as likely to feel favorable toward the UN as those with low levels of international knowledge.
Americans who score better on the international knowledge scale differ in their assessments of countries’ place in the world. High scorers are 37 percentage points more likely than those who have a low score to say China’s influence in the world in recent years has been increasing. They are also significantly more likely to say India and Germany’s influence has been growing stronger. Conversely, they are 10 points less likely than Americans who answered four or fewer questions correctly to say the United States’ influence in the world has increased.
Evaluations of world leaders similarly differ by performance on the international knowledge scale. Confidence in Ukrainian President Zelenskyy is higher among Americans who answer at least nine questions correctly, compared with those with four or fewer correct responses. The same relationship holds for views of German Chancellor Scholz, French President Macron and U.S. President Biden.
High scores on the knowledge scale relate to more critical evaluations of Russia. While a majority of Americans see Russia very unfavorably, those with a high level of knowledge are 10 points more likely than those with low knowledge to have a very negative view of the country. These unfavorable views are reflected in how Americans see Russia’s relationship with the U.S.: Americans who score highly on the international knowledge scale are more likely than those who have a low score to consider Russia an enemy. They are also more likely to say Russia’s influence in the world has been getting weaker in recent years. While 30% of those with low knowledge say Russia’s international influence is waning, 42% of those with high knowledge hold this opinion. Attitudes toward Russia’s leader show the same pattern. Majorities across all groups say they have no confidence at all in Russian President Putin, but those with higher scores are 15 points more likely than those with four or fewer correct answers to hold this view.

Views of China are also related to international knowledge. Those who have high levels of international knowledge are more likely to describe China as an enemy of the U.S., to say that current U.S.-China relations are bad and to say economic relations between the two countries are bad. And when it comes to seven potential issues in the U.S.-China relationship asked about, the low knowledge group is the least likely to call any one of them a very serious problem. The gap is particularly large when it comes to tensions between China and Taiwan, which those in the high knowledge group are 30 points more likely to describe as a very serious problem than those in the low knowledge group.
Americans, overall, are equally likely to describe China and the U.S. as the world’s leading economy, but people with high international knowledge are significantly more likely than those with lower levels of knowledge to describe the U.S. as the top economic power (55% vs. 37%). Notably, this accords with the actual size of the two country’s GDP’s, according to IMF estimates.