Pew Research Center

FOR RELEASE APRIL 29, 2019

Many Across the Globe Are Dissatisfied With How Democracy Is Working

Discontent is tied to concerns about the economy, individual rights and out-of-touch elites

BY Richard Wike, Laura Silver and Alexandra Castillo

FOR MEDIA OR OTHER INQUIRIES:

Communications Department
202.419.4372
www.pewresearch.org

RECOMMENDED CITATION

Pew Research Center, April 2019, "Many Across the Globe Are Dissatisfied With How Democracy Is Working"

About Pew Research Center

Pew Research Center is a nonpartisan, nonadvocacy fact tank that informs the public about the issues, attitudes and trends shaping the world. It does not take policy positions. The Center conducts public opinion polling, demographic research, computational social science research and other data-driven research. It studies politics and policy; news habits and media; the internet and technology; religion; race and ethnicity; international affairs; social, demographic and economic trends; science; research methodology and data science; and immigration and migration. Pew Research Center is a subsidiary of The Pew Charitable Trusts, its primary funder.

© Pew Research Center 2026

Table of contents

  • About Pew Research Center
  • Many Across the Globe Are Dissatisfied With How Democracy Is Working
  • 1. Dissatisfaction with performance of democracy is common in many nations
  • 2. Publics satisfied with free speech, ability to improve living standards; many are critical of institutions, politicians
  • 3. Why are people dissatisfied with how democracy is working?
  • Acknowledgments
  • Methodology
  • Appendix A: Factors that influence democratic dissatisfaction
  • Appendix B: Classifying European political parties
  • Appendix C: Economic categorization
  • Appendix D: Political categorization

Many Across the Globe Are Dissatisfied With How Democracy Is Working

Discontent is tied to concerns about the economy, individual rights and out-of-touch elites

Chart showing that there are divided views around the world about how key aspects of democracy are working.

Anger at political elites, economic dissatisfaction and anxiety about rapid social changes have fueled political upheaval in regions around the world in recent years. Anti-establishment leaders, parties and movements have emerged on both the right and left of the political spectrum, in some cases challenging fundamental norms and institutions of liberal democracy. Organizations from Freedom House to the Economist Intelligence Unit to V-Dem have documented global declines in the health of democracy.

As previous Pew Research Center surveys have illustrated, ideas at the core of liberal democracy remain popular among global publics, but commitment to democracy can nonetheless be weak. Multiple factors contribute to this lack of commitment, including perceptions about how well democracy is functioning. And as findings from a new Pew Research Center survey show, views about the performance of democratic systems are decidedly negative in many nations. Across 27 countries polled, a median of 51% are dissatisfied with how democracy is working in their country; just 45% are satisfied.

Assessments of how well democracy is working vary considerably across nations. In Europe, for example, more than six-in-ten Swedes and Dutch are satisfied with the current state of democracy, while large majorities in Italy, Spain and Greece are dissatisfied.

To better understand the discontent many feel with democracy, we asked people in the 27 nations studied about a variety of economic, political, social and security issues. The results highlight some key areas of public frustration: Most believe elections bring little change, that politicians are corrupt and out of touch and that courts do not treat people fairly. On the other hand, people are more positive about how well their countries protect free expression, provide economic opportunity and ensure public safety.

We also asked respondents about other topics, such as the state of the economy, immigration and attitudes toward major political parties. And in Europe, we included additional questions about immigrants and refugees, as well as opinions about the European Union.

Bivariate and multilevel regression analyses (see Appendix A for methodological details) show that, among the factors studied, dissatisfaction with democracy is related to economic frustration, the status of individual rights, as well as perceptions that political elites are corrupt and do not care about average citizens. Additionally, in Europe the results suggest that dissatisfaction with the way democracy is working is tied to views about the EU, opinions about whether immigrants are adopting national customs and attitudes toward populist parties.

These are among the findings of a Pew Research Center survey conducted among 30,133 people in 27 countries from May 14 to Aug. 12, 2018.

Measuring satisfaction, dissatisfaction with how democracy is working

We measured satisfaction with the performance of democracy in each country using the following question: How satisfied are you with the way democracy is working in our country – very satisfied, somewhat satisfied, not too satisfied, or not at all satisfied? This question is commonly used by academics and on international surveys, including the Global Barometer Surveys.

Satisfaction with democracy can be thought of as one measure of popular contentment – with the current regime in power or the direction of the nation.1 For example, results of this survey and work by other researchers show that people who support the party or coalition in power (the “winners”) tend to be more satisfied than others.2

The question does not take into account institutional or other features that are sometimes used to characterize a democracy’s health. For example, our findings do not necessarily mirror ratings found in the Democracy Index, developed by the Economist Intelligence Unit, or Freedom House’s Freedom Ratings.

The satisfaction question also does not measure attitudes toward democratic values or belief in the principles of liberal democracy. That said, scholars have explored the link between views of how democracy is working and commitment to democratic principles. For example, one group of researchers found that across 54 countries, satisfaction with democracy was one of the key factors affecting people’s normative commitment to democracy.3 Our data, too, indicates that the more dissatisfied people are with democracy, the less likely they are to say representative democracy, rather than alternative models like technocracy, a strong leader model, or military rule, is a good way to govern their country (for more on this, see Chapter 1).

Some scholars also use the question about democracy’s performance to identify “dissatisfied democrats” – those committed to democratic institutions but dissatisfied with the current state of democracy in their country – a group some argue is important for preventing democracies from “back-sliding” into authoritarian regimes.4

______

1 Linde, Jonas, and Joakim Ekman. 2003. “Satisfaction with democracy: A note on a frequently used indicator in comparative politics.” European Journal of Political Research.

2 Wells, Jason M., and Jonathan Krieckhaus. 2006. “Does National Context Influence Democratic Satisfaction? A Multi-level Analysis.” Political Research Quarterly.

3 Chu, Yu-ham, Michael Bratton, Marta Lagos, Sandeep Shastri and Mark Tessler. 2008. “Public Opinion and Democratic Legitimacy.” Journal of Democracy.

4 Norris, Pippa. Ed. 1999. “Critical Citizens: Global Support for Democratic Government.”

Economic discontent and democratic dissatisfaction

Chart showing that those around the world who say the current economy is bad are more dissatisfied with the way democracy is working.

The link between views of the economy and assessments of democratic performance is strong. In 24 of 27 countries surveyed, people who say the national economy is in bad shape are more likely than those who say it is in good shape to be dissatisfied with the way democracy is working. In the other three countries surveyed, so few people say the economy is good that this relationship cannot be analyzed.

For example, eight-in-ten Hungarians who say the national economic situation is poor are also dissatisfied with the performance of the country’s democracy, compared with just 26% of those who believe the economic situation is good.

Views about economic opportunity also play a role. In 26 of 27 nations, those who believe their country is one in which most people cannot improve their standard of living are more likely to be dissatisfied with the way democracy is working.

However, personal income is not a major factor. And multilevel regression analysis suggests that, in general, demographic variables including gender, age and education are not strongly related to democratic dissatisfaction.

Individual rights and democratic performance

Chart showing that those who think free speech is not protected in their country are more dissatisfied with democracy.

While views about economic conditions have a strong relationship with assessments of democratic performance, non-economic factors also play an important role. Opinions about how well democracy is working in a country are related to whether people believe their most fundamental rights are being respected.

In every nation studied, dissatisfaction with democracy is more common among people who say the statement “the rights of people to express their views in public are protected” does not describe their country well. This pattern is especially apparent in Europe, where in nations such as the Netherlands, Sweden, Germany and Hungary those who believe free expression is not protected are significantly more likely to be unhappy with the state of democracy.

Discontent with the functioning of democracy is also linked to views about how people are treated within a country’s justice system. In 24 nations, dissatisfaction is particularly common among those who think the statement “the court system treats everyone fairly” does not describe their country well. Again, the pattern is especially intense in Europe. For example, among Hungarians who offer a negative assessment of the country’s courts, 68% are dissatisfied with the way democracy is working, while dissatisfaction is just 32% among those who believe the courts treat everyone fairly.
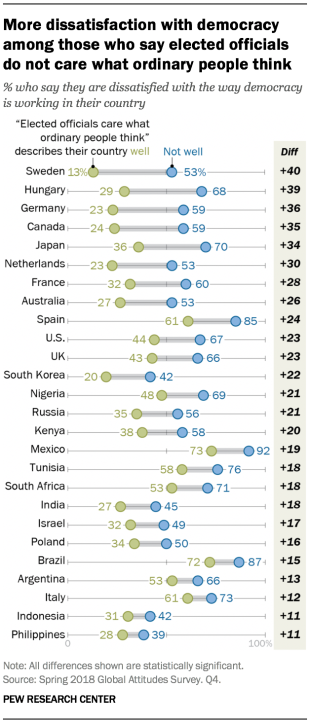
Chart showing that there is more dissatisfaction with democracy among those who say elected officials do not care what ordinary people think.

Frustration with politicians breeds dissatisfaction with democracy

In addition to views about political rights, attitudes toward politicians also influence the degree to which people are satisfied or dissatisfied with the performance of their country’s democracy. For instance, dissatisfaction is pervasive among people who see politicians as uncaring and out of touch.

In 26 nations, unhappiness with the current functioning of democracy is more common among those who believe the statement “elected officials care what ordinary people think” does not describe their country well.

Many also say the politicians in their country are corrupt, and those who hold this view are consistently more dissatisfied with how their democracy is functioning.

Concerns about immigrants, dislike of EU and favorable opinion of populist parties are tied to dissatisfaction in Europe
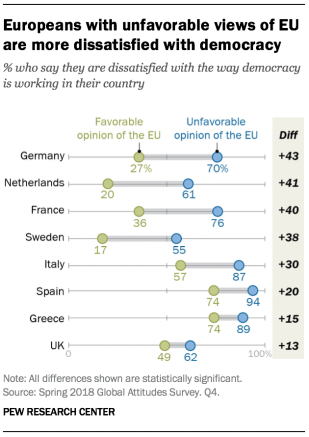
Chart showing that Europeans with unfavorable views of the EU are more dissatisfied with democracy.

The study highlights additional factors related to democratic dissatisfaction in Europe, including attitudes toward the EU. As a recent Pew Research Center report highlighted, Europeans still tend to associate the EU with noble aspirations, such as peace, prosperity and democracy. At the same time, they also say the Brussels-based institution is inefficient, intrusive and out of touch with ordinary citizens.

Europeans who have a negative view of the EU also tend to be more dissatisfied with the way democracy is working in their countries than those who view the EU favorably. The gap is largest in Germany, where those who have an unfavorable opinion of the EU are 43 percentage points more dissatisfied than those with a favorable opinion.
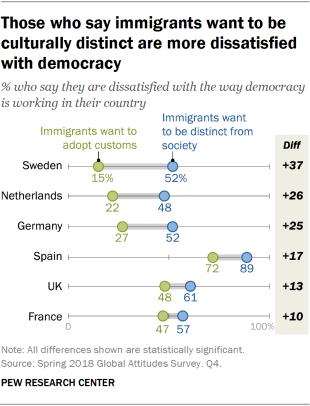
Chart showing that those who say immigrants want to be culturally distinct are more dissatisfied with democracy.

Immigration has been a particularly contentious issue in Europe since 2015, when refugees from the Middle East and elsewhere entered Europe in record numbers. Across the region, concerns about how immigrants fit into society are linked to democratic dissatisfaction.

In six European countries, those who think immigrants want to be distinct from society rather than adopting the country’s customs are more likely to be dissatisfied with democracy. For example, 52% of Swedes who say immigrants want to remain distinct are dissatisfied, compared with just 15% of those who believe immigrants want to adopt Swedish customs.

Anger at the EU and opposition to immigration have been consistent themes in the rhetoric and platforms of many right-wing populist parties that have gained support in the past few years. At the same time, Europe has seen the rise of several left-wing populist parties, such as La France Insoumise, Spain’s Podemos and Greece’s ruling Syriza party.

Overall, populist party sympathizers tend to be unhappy with the way their democracies are working (parties were classified using the Chapel Hill Expert Survey; for more, see Appendix B). Nearly six-in-ten Swedes with a favorable opinion of the Sweden Democrats are dissatisfied with the current state of democracy, compared with only 17% of those who see the right-wing party negatively. Similarly, 69% of Germans with a positive view of the right-wing AfD are dissatisfied, while just 37% hold that view among Germans who rate AfD negatively.
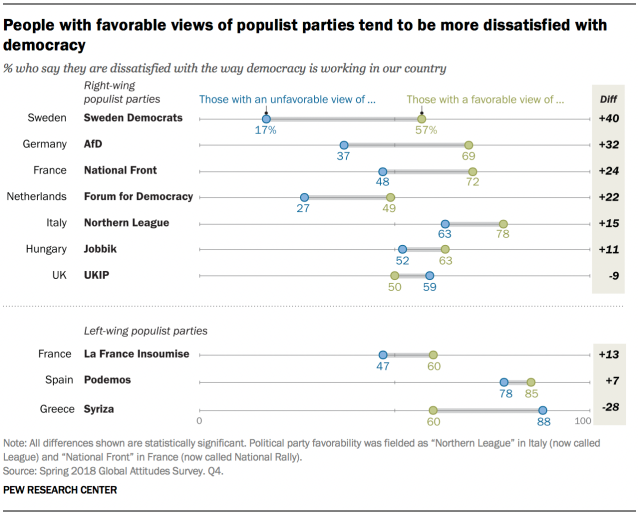
Chart showing that people with favorable views of populist parties tend to be more dissatisfied with democracy.

The same pattern is found among those who sympathize with left-wing populist parties in some nations. For instance, six-in-ten who have a favorable view of La France Insoumise are dissatisfied with how democracy is working, compared with 47% of French people who see the party negatively.

Interestingly, those with favorable opinions of two European populist parties are more satisfied with how democracy is working: the UK’s right-wing, pro-Brexit UKIP and Greece’s left-wing Syriza.
1. Dissatisfaction with performance of democracy is common in many nations

Around the world, more people are unhappy with the state of democracy in their countries than are content. Across 27 countries surveyed, a median of 51% are dissatisfied with the way their democracy is functioning, compared with 45% who are satisfied.

Discontent varies somewhat across regions of the globe. Those in the Asia-Pacific region, for example, tend to be satisfied with how democracy is working in their countries; only in Japan do a majority say they are dissatisfied.

Europeans are, on balance, disaffected; in six of the 10 European countries surveyed, half or more say they are dissatisfied with how democracy is working. Discontent is highest in the southern European countries of Italy, Spain and Greece, where 70% or more say they are dissatisfied. In contrast, roughly a third or fewer hold this view in Sweden and the Netherlands.

Across the sub-Saharan African and Latin American countries surveyed, around half or more in every country say they are dissatisfied with the way democracy is working.

Dissatisfaction with democracy is higher in emerging than advanced economies. A median of 60% express dissatisfaction across the nine emerging economies surveyed, compared with 50% across the 18 developed economies (for more on how advanced and emerging economies were classified, see Appendix C).

In many countries, dissatisfaction with democracy grew between 2017 and 2018

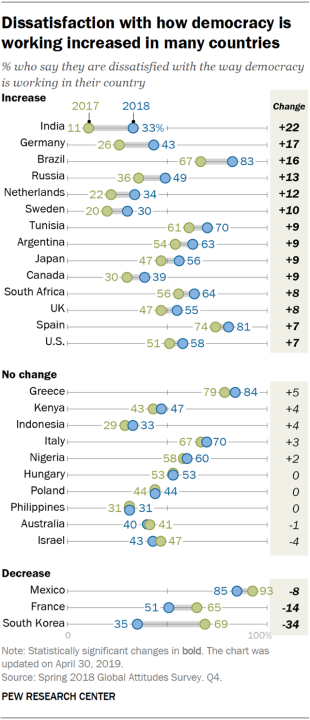
Chart showing that dissatisfaction with how democracy is working increased in many countries across the 27 included.

Between 2017 and 2018, dissatisfaction with the way democracy is working significantly increased in roughly half of the countries polled. This increasing dissatisfaction is evident around the globe, regardless of whether the economies are advanced or emerging.

Ten countries did not experience any significant changes in democratic dissatisfaction, while it decreased in only three countries: South Korea, France and Mexico. South Korean opinion has shifted the most since 2017 of any country surveyed, with the percentage saying they are dissatisfied dropping from 69% to 35%. Over this period, President Park Geun-hye was impeached and sentenced to 24 years in prison.

In the six countries where concerns about the economic situation significantly increased since 2017, democratic dissatisfaction also rose. For example, in India, concerns about the economy increased the most of any surveyed country – 12% thought the economy was in bad shape in 2017, but by 2018 this opinion was held by 30% of adults. This increase in economic discontent is coupled with a 22-point rise in democratic dissatisfaction. In Germany and Brazil, as well, the rising sense that the economy is not in good shape has been accompanied by double-digit shifts in democratic dissatisfaction.

In France and South Korea, the opposite relationship is found. Both countries experienced significant decreases in democratic dissatisfaction alongside improvements in economic outlook. The U.S. stands out as the only country in which dissatisfaction with democracy has increased at the same time that people think the country’s economic situation is improving.

Age, education and views of parties out of power sometimes associated with dissatisfaction

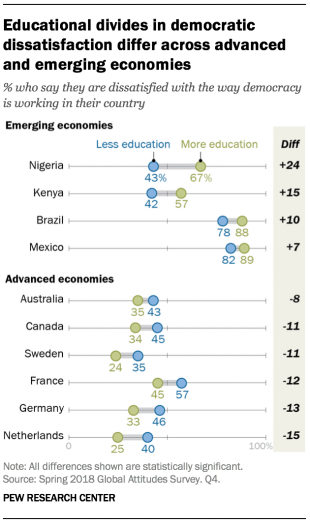
Chart showing that educational divides in democratic dissatisfaction differ across advanced and emerging economies.

There are few consistent age-related patterns when it comes to who is dissatisfied with the performance of democracy in their country. While those ages 50 and older in Australia, the Netherlands, South Korea, the UK and Germany tend to be more dissatisfied with democracy than those ages 18 to 29, in other countries, there is no relationship between age and dissatisfaction.

Education affects people’s satisfaction with democracy somewhat differently across emerging and advanced economies. In four of the nine emerging economies surveyed, those with higher levels of education tend to be more dissatisfied than those with lower levels of education.1 For example, Nigerians with at least a secondary degree are 24 percentage points more dissatisfied than those with less education.

The opposite is true in six of the 18 advanced economies surveyed, where those with lower levels of education are more dissatisfied than those with higher degrees. In the Netherlands, for example, those with less education are 15 points more dissatisfied than those with more education.

Income also impacts democratic dissatisfaction differently in some advanced and emerging economies. In four of the emerging economies surveyed, those with higher income levels are more dissatisfied than those with lower income levels.2 In contrast, in five of the advanced economies polled, those with lower incomes are more dissatisfied with democracy than those with higher incomes.

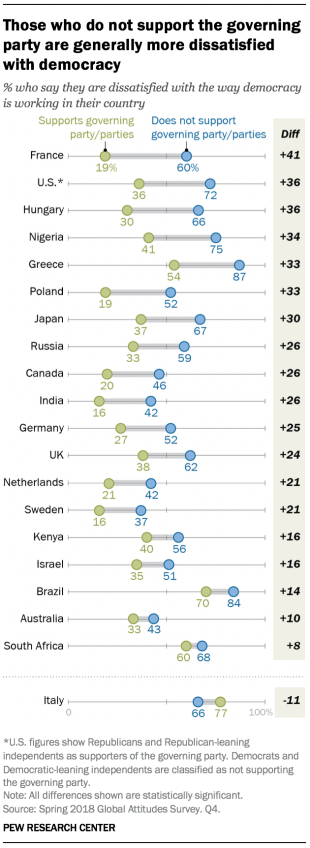
Chart showing that those who do not support the governing party are generally more dissatisfied with democracy in the 27 countries that were included in the survey.

Across most of the countries surveyed, democratic dissatisfaction is higher among people who support parties that are not currently in government (see Appendix D). For example, in France, supporters of En Marche, the governing party, tend to be much less dissatisfied than people who don’t support En Marche. France boasts the largest gap in dissatisfaction between supporters and nonsupporters of the governing party (41 percentage points).

Italy, a country governed by a coalition of two populist parties, is an exception: 77% of those who support Northern League (now called League) or the Five Star Movement are dissatisfied, whereas 66% of those who do not support either party hold this view. (The coalition was created during the fieldwork period, nearly three months after the election.)

Dissatisfied democrats are more open to nondemocratic alternatives

This data, showing rising democratic dissatisfaction in many parts of the world, naturally elicits a question: If people are dissatisfied with democracy, are they more open to nondemocratic alternatives? To answer this question, we rely on data collected in 2017 from which we constructed an index of commitment to representative democracy.

Respondents in 2017 were asked whether each of a number of different systems would be a good or bad way to govern their country: (1) a democratic system where representatives elected by citizens decide on what becomes law (representative democracy); (2) a system in which experts, not elected officials, make decisions according to what they think is best for the country (rule by experts); (3) a system in which a strong leader can make decisions without interference from parliaments or courts (rule by a strong leader); and (4) a system in which the military rules the country (rule by the military).

They were then classified into three groups. “Committed democrats” are those who support a system where elected representatives govern, but do not support rule by experts, a strong leader or the military (i.e., nondemocratic governments). “Less-committed democrats” say a representative democracy is good, but support at least one nondemocratic form of government. “Non-democrats” are defined as those who do not support representative democracy and support at least one nondemocratic form of government. This commitment to democracy index ranges from 1 to 3, with 1 being the most committed to democracy and 3 being no commitment at all.

Respondents were also asked about their satisfaction with democracy, using the same question that we posed to them in 2018. All of the countries surveyed in 2018 were also surveyed in 2017. Across the 27 countries included in this report, people who were more dissatisfied with democracy also tended to be less committed to representative democracy, and so more likely to support governance options such as rule by experts, a strong leader or the military. This suggests that dissatisfaction with democracy is related to willingness to consider other, nondemocratic forms of government.

2. Publics satisfied with free speech, ability to improve living standards; many are critical of institutions, politicians

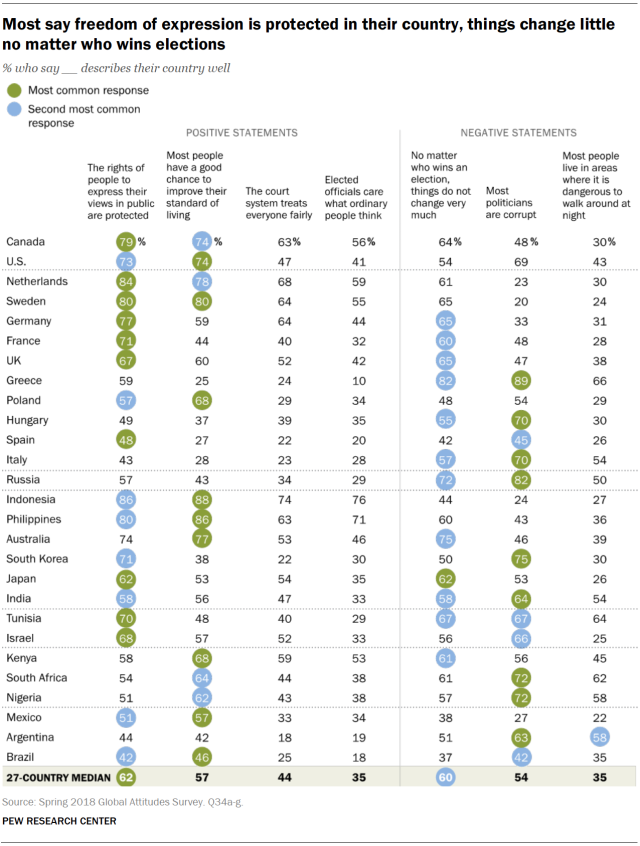
A median of 62% say their country is one where the rights of people to express their views in public are protected. When asked about a number of different statements that describe their country, this ranks as one of the first or second most cited in two-thirds of the countries surveyed.

Publics are also optimistic that most people have a good chance to improve their standard of living: A median of 57% say this is feasible in their countries. Most also feel relatively safe; in a majority of countries, only small shares of the public say most people in their country live in areas where it is dangerous to walk around at night.

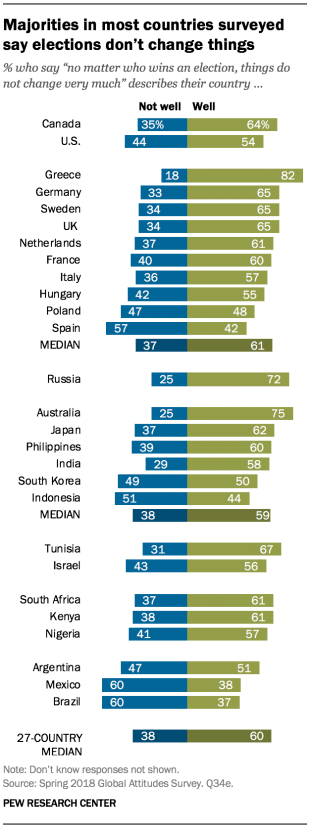
When it comes to political institutions, however, publics are more critical. A median of six-in-ten think no matter who wins an election, things do not change very much. This sentiment is particularly prevalent in Europe; seven of the 10 European countries surveyed say this describes their country more than most other statements presented to them. People are somewhat more critical of their courts: A median of 44% share the opinion that the court system in their country treats everyone fairly, whereas a median of 53% say this does not describe their country well.

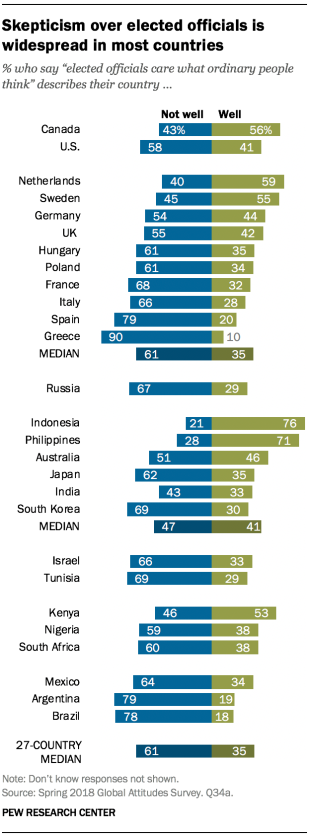
People are also skeptical of their politicians. Across the 27 countries surveyed, 54% think most politicians in their country are corrupt. And only 35% agree that elected officials care what ordinary people think.

By and large, supporters of the governing party or coalition are more inclined to say elected officials care what ordinary people think, freedom of expression is protected, and most people can better their standard of living. Those who support the governing party or coalition are also less likely to describe politicians in their country as corrupt in seven countries.

Chart showing that most say freedom of expression is protected in their country and things change little no matter who wins elections.

Most believe their right to free speech is protected

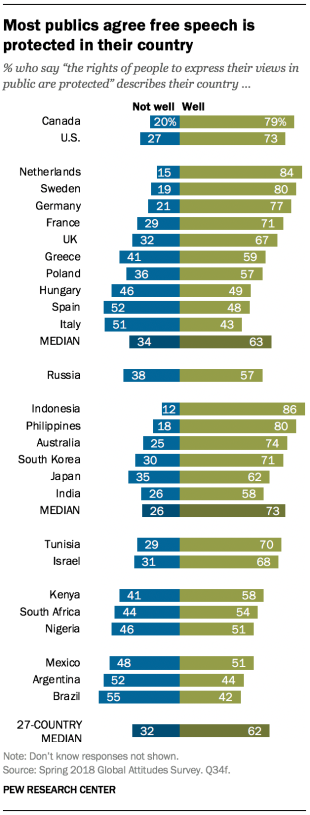
Chart showing that most publics across the 27 included in the survey agree that free speech is protected in their country.

A 27-country median of 62% say their country protects freedom of expression. This sense is somewhat more prevalent in advanced than emerging economies (a median of 68% vs. 58%, respectively).

Across the North American and European nations surveyed, around half or more in most countries say their nation is one in which people can express their views in public. The sense that freedom of speech is protected is also widespread in the two Middle Eastern countries surveyed, as well as across the Asia-Pacific region. But, across the 27 nations, few say this describes their country very well.

Only in Brazil, Spain, Argentina, Italy and Mexico do about half or more say this statement does not describe their country well. In Brazil, roughly four-in-ten (39%) say this does not describe their country well at all.

Across most European countries surveyed, those who have favorable opinions of populist parties are significantly less likely to feel their country is one in which freedom of expression is protected. Take Sweden as an example: Those who have a favorable opinion of the Sweden Democrats are 30 percentage points less likely to think free speech is protected in their country than those who do not favor this party.

Most say they have the ability to improve their standard of living

Chart showing that majorities in most countries, across the 27 included in the survey, see ability to improve their standard of living.

Publics generally say their countries are ones in which there are opportunities to improve living standards. A median of 57% across the 27 nations surveyed agree most people have a good chance to improve their own standard of living, including majorities in 16 of the 27 nations surveyed. This sentiment is slightly more widespread in the nine emerging economies surveyed (median of 62%) than in the 18 advanced economies (55%).

Filipinos, South Africans and Nigerians are especially likely to describe their countries as ones in which people can improve their economic situation; about four-in-ten or more in each country say this describes their country very well.

But in Italy, Spain and Greece, only about one-quarter of people say their country is one in which it is possible to improve their standard of living, with around four-in-ten in Spain (41%) saying this does not describe their country well at all.

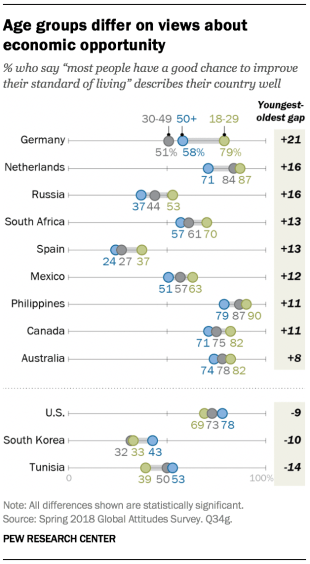
Chart showing that age groups differ on views about economic opportunity.

In all of the nations surveyed, the belief that people can get ahead economically is closely related to views about whether their country’s economy has improved over the past 20 years. Those who think the economic situation has gotten better are more likely to say most people in their country have the opportunity to advance their standard of living. For example, 69% of French people who think the economic situation today is better for the average person than it was in the past also say it is possible to improve their standard of living, compared with 33% among those who say the economic situation today is worse than it was 20 years ago. In most countries polled, people with positive assessments of their country’s current economic situation are also more likely to say that most people have a good chance to advance their standard of living.

In nine of the 27 nations, those ages 18 to 29 are more likely than those ages 50 and older to say people can improve their standard of living. For example, younger Germans are 21 percentage points more likely than older Germans to describe their country as a place where most have opportunities to better their standard of living.

Three countries stand out for the relative pessimism of the younger generation. In the U.S., South Korea and Tunisia, those under 30 are less likely than the oldest cohort to say their country is one in which people can improve their economic situation. In Tunisia, for example, 53% of those ages 50 and older are positive about the potential for people in their country to improve their standard of living compared with 39% of those 18 to 29.

Chart showing that there are mixed views of the judicial system across surveyed countries. Respondents were asked if the statement "the court system treats everyone fairly" describes their country well or not well.

Global publics divided on whether court system treats everyone fairly

A 27-nation median of 44% say the statement “the court system treats everyone fairly” describes their country well, while a median of 53% say it does not. And opinions about a country’s court system vary little across the advanced and emerging economies surveyed.

Indonesians are particularly likely to say their courts are impartial; around three-quarters say the court system treats everyone fairly (74%), including around four-in-ten (38%) who say this describes their country very well. Views on the impartiality of the courts are also shared in the Netherlands, Sweden, Germany, Canada, the Philippines and Kenya, where roughly six-in-ten or more say this describes their country well.

Publics in Italy, Spain, South Korea and Argentina are less confident in the fairness of their court systems: Only around one-in-five in each of these nations say the courts treat everyone fairly. Roughly half or more in Argentina, Brazil, Spain and Mexico say this statement does not describe their country well at all.

Most publics do not feel elected officials care what ordinary people think

Chart showing that skepticism over elected officials is widespread in most countries surveyed. People were asked if the statement "elected officials care what ordinary people think" describes their country well or not well.

In 20 of the 27 countries surveyed, around half or more say that the statement “elected officials care what ordinary people think” does not describe their country well.

Nine-in-ten Greeks agree the statement does not describe their country well, and upwards of around eight-in-ten say the same in Brazil, Spain and Argentina. Publics in these four countries also have high percentages who feel strongly about this: 62% of Brazilians, 57% of Greeks, 54% of Argentines and 48% of Spaniards say the statement does not describe their country well at all.

Among the minority of publics who do agree elected officials in their country care what ordinary people think, Indonesia and the Philippines stand out. In both countries, around seven-in-ten or more describe their country as one in which elected officials care about the people, including three-in-ten or more in each who say this describes their country very well.

Publics in the Netherlands, Canada, Sweden and Kenya are also somewhat sanguine about elected officials caring about the citizens in their country.

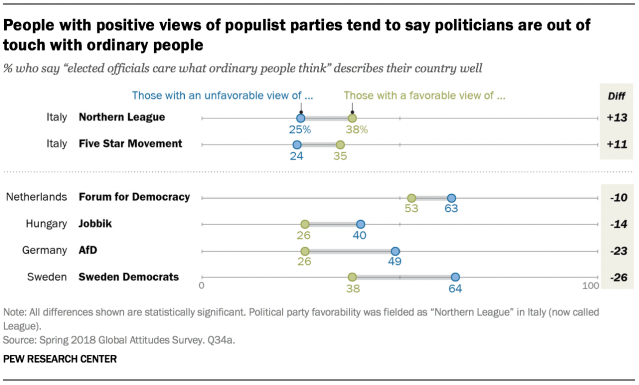
Although populism has myriad definitions, key components of the concept are that “the people” and “the elite” are two antagonistic groups and that the people’s will should provide the main source of government legitimacy. And, in four countries – the Netherlands, Hungary, Germany and Sweden – people with favorable views of populist parties are indeed less likely to say elected officials care what ordinary people think than those who view these parties unfavorably. For example, those with favorable views of the Sweden Democrats are 26 percentage points less likely than Swedes with unfavorable opinions of the party to describe elected officials as caring about ordinary people.

Chart showing that people with positive views of populist parties tend to say politicians are out of touch with ordinary people.

3

Chart showing that more than half of publics surveyed say politicians are corrupt.

Many describe their country’s politicians as corrupt

In 18 of the 27 countries surveyed, around half or more say their country can be described as one in which most politicians are corrupt.

In many European nations, roughly half or more say they live in a country in which the statement “most politicians are corrupt” describes their country well. Majorities also share this opinion in the U.S., as well as the two Middle Eastern and three sub-Saharan African countries surveyed. Opinion is more divided in the Asia-Pacific region and Latin America.

Greeks are the most likely to describe their politicians as corrupt (89%), while around three-quarters or more in Russia, South Korea, Nigeria and South Africa describe their country in a similar manner.

Publics in Sweden, the Netherlands, Indonesia, Mexico and Germany are the least likely to say their country can be described as one in which most politicians are corrupt.

Chart showing the educational divides in views of whether politicians are corrupt.

In many of the 27 countries surveyed, there are educational divides on whether most politicians in the country can be described as corrupt. Particularly in emerging and developing economies, people with higher levels of education are more likely to say most politicians are corrupt. For example, Brazilians with more education are 27 percentage points more likely than those with less education to describe politicians in the country as corrupt.

But, in six countries – all of which are advanced economies – the pattern is reversed; people with less education are more likely to describe politicians as corrupt. Take Germany as an example: Germans with less than a postsecondary degree are 17 points more likely to say most politicians in their country are corrupt than Germans with more education.

Those with favorable opinions of populist parties in five European countries (the PVV in the Netherlands, AfD in Germany, Jobbik in Hungary, Sweden Democrats in Sweden and UKIP in the United Kingdom) are more likely than those with unfavorable opinions of these parties to say most politicians in their country are corrupt.

Few think things in their country change much after an election

One of the core tenets of democracy is that, after an election, parties and policies in the country may change. But many global publics say this doesn’t describe what happens in their countries following an election. A 27-country median of 60% say no matter who wins an election, things don’t change very much.

Chart showing that majorities in most countries surveyed say elections don’t change things. People were asked if the statement, "no matter who wins an election, things do not change very much" describes their country well or not well.

Greeks are the most likely to describe their country as one where things do not change very much no matter who wins an election (82%), followed by Australians (75%), Russians (72%) and Tunisians (67%). And, in Tunisia and Greece, more than half say this statement describes their country very well.

It is worth noting that whether or not things change a lot following an election could be interpreted as either a positive or a negative characteristic of democracy. For some, no change after an election may be a good thing, whereas for others it may be bad.

Chart showing that in many countries, relatively few say it is dangerous to walk around at night.

Most say their countries are generally not dangerous for walking around at night

A median of 35% believe most people live in areas where it’s dangerous to walk around at night. But opinion diverges somewhat across advanced and emerging economies. In advanced economies, a median of only 30% say most people live in areas where it is dangerous to walk around at night, compared with a median of 45% across the nine emerging economies surveyed.

Around six-in-ten or more in Greece, Tunisia, South Africa, Nigeria and Argentina describe their country as one in which most people live in areas where it is dangerous to walk around at night, including roughly half or more in Tunisia and South Africa who say this describes their country very well. But, across most European, Asia-Pacific and North American countries surveyed, people largely agree this statement does not describe their country well.

There are also marked differences in people’s assessments based on income levels. In four emerging economies – India, Brazil, South Africa and Mexico – those with higher incomes are more likely than those with lower incomes to describe their country as one in which most people live in areas where it is dangerous to walk around at night. In India, though, those with lower incomes are also less likely to answer the question.

In most advanced economies, the pattern reverses. Those with lower incomes are more likely to believe it is dangerous to walk around at night. For example, less affluent Australians are 20 percentage points more likely to say most people live in dangerous areas.

Chart showing that in some advanced and emerging economies, views about danger of walking at night are divided by income.
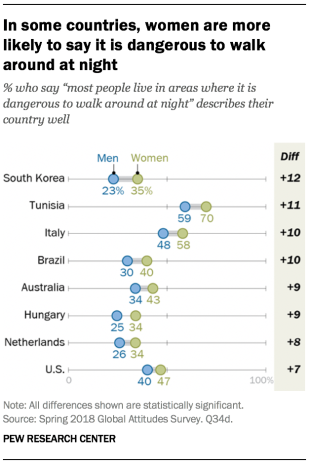
Chart showing that in some countries included in the survey, women are more likely to say it is dangerous to walk around at night.

Educational gaps follow a similar pattern. In many advanced economies, those with lower levels of education are somewhat more likely to describe their country as dangerous to walk around in at night. For example, in Germany, there is a 25-point gap between those with lower levels of education and those with a postsecondary degree or above (39% vs. 14%). But, in three of the emerging economies – Brazil, India and Indonesia – those with higher educational attainment are more likely to say many people live in dangerous areas.4

In eight countries, women are more likely than men to describe their country as one in which it is dangerous to walk around at night. In South Korea, for example, women are 12 percentage points more likely than men to express this opinion.

3. Why are people dissatisfied with how democracy is working?

People are dissatisfied with the functioning of democracy in their countries for a host of reasons. For example, those who think politicians are corrupt or that the economic situation is bad in their country are more likely to be dissatisfied with democracy. Conversely, those who see key political institutions in their countries performing adequately – for example, those who think courts treat everyone fairly or that people can express their views in public – tend to be more satisfied with the way democracy is working.

Partisanship also plays a role. Those who have favorable views of populist parties and those who support parties that are not currently in power are more dissatisfied. In Europe, those who have unfavorable opinions of the EU or who think immigrants are resisting integration into society also tend to be unhappier with the state of democracy.

Other factors, however, have a weaker relationship with democratic satisfaction. By and large, people’s beliefs about whether it is safe to walk at night in their country have no relationship with whether they are satisfied with how democracy is working. Similarly, people’s opinions about whether their country should have more or less immigration are not related.

To further understand what informs satisfaction or dissatisfaction with the way democracy is working, we explored these and other relationships using multilevel regression. In this chapter, all factors discussed as contributing to democratic dissatisfaction are relationships that persist after accounting for other key attitudes and demographic variables (in regression parlance, we have “controlled” for other factors). For more about the methodology and for a more detailed presentation of the regression model informing these results, please see Appendix A.

Negative economic assessments related to dissatisfaction

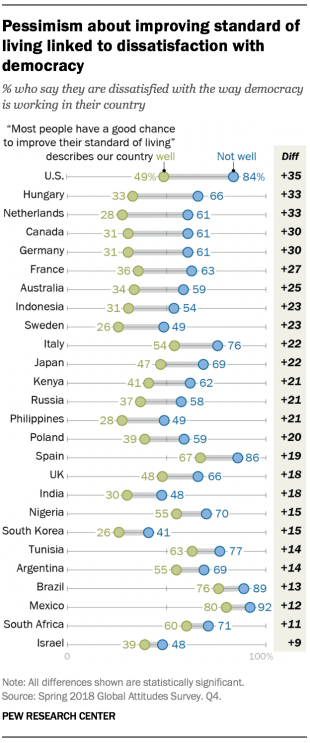
Chart showing that pessimism about improving the standard of living is linked to dissatisfaction with democracy, across the 27 countries included in the survey.

Many recent debates around democratic satisfaction have emphasized economic attitudes. Previous work by Pew Research Center found that those who are critical of the establishment and open to populist alternatives are more likely to have experienced economic hardships, such as unemployment.

This survey also finds that views of the economy are connected to attitudes toward democracy. In nearly all countries surveyed, people who say the economy is doing poorly are more dissatisfied with the way democracy is working. And, in countries where views of the economy turned more negative over the past year, dissatisfaction also increased.

Views of whether most people can improve their standard of living are also related to democratic dissatisfaction. Those who say their country is one in which most people cannot improve their standard of living tend to be more dissatisfied.

In the U.S., one’s ability to improve their standard of living is often associated with the American dream. And Americans who say their country does not provide a good chance for most to advance their standard of living are 35 percentage points more dissatisfied with how democracy is working than those who see economic opportunities.

Views of democratic institutions, core freedoms also contribute to dissatisfaction

Chart showing that across the countries surveyed those who do not see courts as fair are more dissatisfied with the way democracy works.

While our analysis finds that views of the economy help explain who is dissatisfied, other factors matter as well, especially attitudes about key elements of the political system.

Aspects that are often characterized as core tenets of democracy, like rights to freedom of expression and fair courts, are important in understanding people’s dissatisfaction. For example, across the 27 countries surveyed, those who say their country protects freedom of expression tend to be less dissatisfied with democracy. Confidence in the fairness of courts is also strongly related to dissatisfaction with democracy. Those who believe the court system in their country treats everyone fairly are less dissatisfied.

And, while this survey focused more generally on freedom of expression rather than directly on the role of the media, a past Pew Research Center report found a link between attitudes toward the news media and the government. A survey of 38 countries found that people who are less satisfied with the functioning of the news media also tend to express less trust in the government to do what is right for the country.

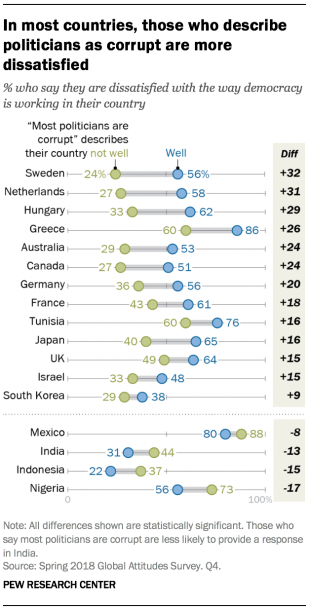
Chart showing that in most countries, those who describe politicians as corrupt are more dissatisfied with the way democracy is working in their country.

Dissatisfaction related to sense of politicians being out of touch and corrupt

Beyond opinions of these core democratic institutions, perceptions of political officials play an important role in shaping people’s views about democratic performance. Those who think elected officials care what ordinary people think are much less likely to be dissatisfied.

While also important, the relationship between corruption and dissatisfaction is not as strong. Nonetheless, in several nations, there is a significant relationship. In Sweden, for instance, those who say most politicians are corrupt are 32 percentage points more dissatisfied than those who do not think this describes their country well.

And, in four of the nine emerging economies surveyed, those who describe most politicians as corrupt are actually less dissatisfied with democracy.

Electoral change, perceptions of safety not linked to democratic dissatisfaction

Even though a 27-country median of six-in-ten say that things do not change very much no matter who wins an election, this opinion is not related to dissatisfaction with democracy in most countries. Nonetheless, support for the party or parties in power in a country does relate to democratic dissatisfaction.

In general, feeling safe when walking around at night is not related to democratic dissatisfaction. Even those who feel as if most people live in areas where it was not safe to walk around at night are not systematically more dissatisfied.

Acknowledgments

This report is a collaborative effort based on the input and analysis of the following individuals.   

Richard Wike, Director, Global Attitudes Research Laura Silver, Senior Researcher Alexandra Castillo, Research Associate

Leila Barzegar, Communications Associate James Bell, Vice President, Global Strategy Stefan Cornibert, Communications Manager     Claudia Deane, Vice President, Research     Kat Devlin, Research Associate  Moira Fagan, Research Assistant Janell Fetterolf, Research Associate Christine Huang, Research Assistant Michael Keegan, Senior Information Graphics Designer David Kent, Copy Editor Clark Letterman, Senior Researcher Martha McRoy, Research Methodologist Patrick Moynihan, Associate Director, International Research Methods Stacy Pancratz, Research Methodologist Jacob Poushter, Associate Director, Global Research Audrey Powers, Senior Operations Associate Ariana Rodriguez-Gitler, Digital Producer Christine Tamir, Research Assistant Kyle Taylor, Research Analyst Bill Webster, Information Graphics Designer

Methodology

About the Pew Research Center’s Spring 2018 Global Attitudes Survey

Results for the survey are based on telephone and face-to-face interviews conducted under the direction of D3 Systems Inc., Kantar Public UK, Kantar Public Korea and Langer Research Associates. The results are based on national samples unless otherwise noted. More details about our international survey methodology and country-specific sample designs are available here.


Appendix A: Factors that influence democratic dissatisfaction

In this report, we explored factors related to people’s perceptions of the way democracy is working in their country. To do this, we performed a multilevel regression analysis predicting democratic dissatisfaction as a function of people’s key attitudes on economic, political, social and security issues in their country, as well as their demographic characteristics. Specifically, we used Stata’s melogit function to estimate a weighted, mixed-effect logistic model with random intercepts by country and robust standard errors. In addition to this pooled model, we evaluated the robustness of the results by estimating the model for each country separately. These country-specific models yielded similar conclusions.

Dissatisfaction with democracy is the dichotomous dependent variable, where 1 denotes someone is dissatisfied with democracy in their country (those who are not too or not at all satisfied) and 0 means someone is satisfied with the way democracy is working in their country (those who say they are very or somewhat satisfied). The independent, or predictor, variables include evaluations of the current economic situation, attitudes about immigration, support for the governing party or parties, age, gender, education and an indicator for the country’s level of economic development (whether it is an advanced or emerging economy – for more, see Appendix C). Additional variables related to respondents’ views of their country were also included as predictors.

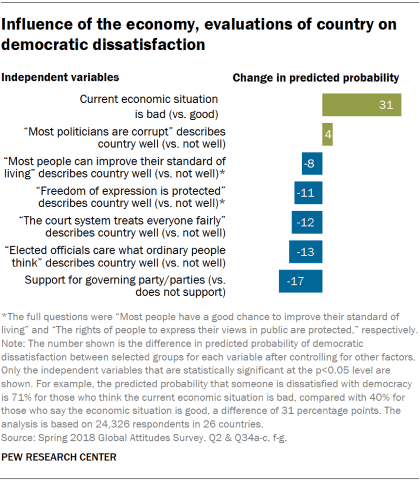
Chart showing the influence of the economy and evaluations of the country on democratic dissatisfaction.

Overall, we find that negative views of the current economic situation have a strong association with individual democratic dissatisfaction. Holding everything else constant, a person who says the current economic situation in their country is bad has a 71% chance of also being dissatisfied with the way democracy is working in their country. In contrast, someone with a positive outlook on their country’s economic situation has a 40% chance – a difference of 31 percentage points. In addition to attitudes about the economic situation, individuals who describe their country as one in which most politicians are corrupt are on average 4 points more likely to express democratic dissatisfaction than those who do not think this describes their country well (58% and 54%, respectively). The relationship between views of corruption and democratic dissatisfaction is relatively small, however.

Respondents’ other opinions about their country also relate to democratic dissatisfaction. People were asked to evaluate their country on a number of dimensions, and in each case, people who said their country was well-described by the following statements were more satisfied: “Most people can improve their standard of living,” “courts treat everyone fairly,” “freedom of expression is protected,” and “officials care what ordinary people think.”

Partisan affiliation is also related to democratic dissatisfaction, controlling for other factors. For example, the chance that someone who supports the governing party (or parties) is dissatisfied is 45%, compared with someone who does not support the party in power who has a predicted probability of dissatisfaction of 62%, a difference of 17 percentage points.

5

After accounting for the above variables, other factors were not predictive of democratic dissatisfaction. Describing their country as one in which most people live in areas where it is dangerous to walk around at night and saying that things do not change very much no matter who wins an election were not significantly related to dissatisfaction with how democracy is performing. Neither were attitudes toward immigration (allow more, the same, or less/none immigrants into the country), the level of economic development (advanced vs. emerging economy) or the respondent’s demographics (age, gender and education).

Factors that influence democratic dissatisfaction in Europe

Alongside the global model, we also evaluated a weighted, mixed-effect logistic regression model for the 10 European countries surveyed. In addition to the factors highlighted above, this analysis allows us to evaluate favorability of the EU, opinions regarding whether immigrants want to adopt their country’s customs and way of life, and favorable views of right- and left-wing populist parties. As with the previous model, we also estimated models for each country separately to verify its robustness; these results yielded similar findings to the pooled regression model.

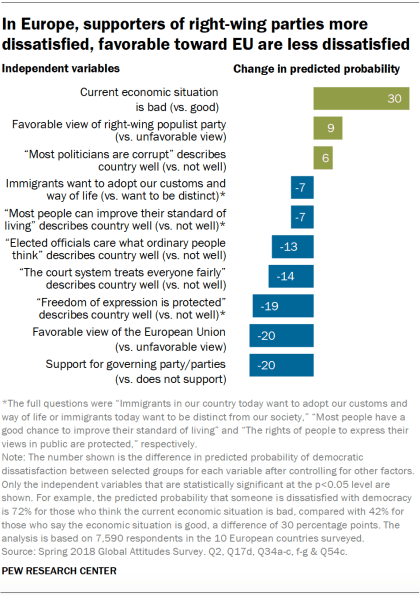
Overall, the European predictors of democratic dissatisfaction are very similar to the pooled model. Again, negative views of the current economic situation and the view that most politicians are corrupt are linked to greater levels of democratic dissatisfaction. Those who have favorable views of right-wing populist parties are also more dissatisfied. For example, a person with a positive view of a right-wing populist party in their country (see Appendix B for how we classified populist parties using the Chapel Hill Expert Survey) has a predicted probability of being dissatisfied with the way democracy is working in their country of 64%. A person who does not sympathize with a right-wing populist party has a 55% chance of being dissatisfied, a 9 percentage point difference.

Chart showing that in Europe, supporters of right-wing parties are more dissatisfied with democracy and those who are favorable toward the EU are less dissatisfied.

A host of other factors are associated with democratic dissatisfaction in Europe as well. Those who say most immigrants want to adopt their country’s culture and way of life are less likely to be dissatisfied with democracy than those who think immigrants today want to remain distinct (53% and 60%, respectively), although the impact of this factor is small. Those who evaluate their country as one in which most can improve their standard of living, elected officials care what ordinary people think, courts treat everyone fairly, and freedom of expression is protected are more satisfied with the way democracy is working in their country.

Favorable views of the EU and support for the governing party or parties in power are also strongly correlated with democratic dissatisfaction. For example, those who have favorable views of the EU have a 49% chance of being dissatisfied with democracy. Those who are unfavorable toward the Brussels-based institution have a 69% chance of being dissatisfied, a 20 percentage point difference.

This complementary analysis of democratic dissatisfaction included the 10 European countries surveyed (n=7,590). Poland is included in the analysis, though it does not have any populist parties according to our classification (see Appendix B for more information on this). Respondents who answered “Don’t know” or “Refused” to any of the questions were excluded.

After controlling for the independent variables, some factors were not significantly related to democratic dissatisfaction. Agreement with the following statements as good descriptors of their country are not statistically significant: “Most people live in areas where it is dangerous to walk around at night” and “no matter who wins an election, things do not change very much.” Opinions about whether countries should have more or less immigration were not related to dissatisfaction, and neither were favorable views of left-wing populist parties. None of the demographic variables (age, gender and education) were significant predictors of dissatisfaction with democracy.

Appendix B: Classifying European political parties

Classifying parties as populist

We define “populist” political parties as those that display high levels of anti-elitism. We do this on the basis of the Chapel Hill Expert Survey (CHES). This survey, which was carried out in January and February 2018, asked 228 regional experts to evaluate the 2017 party positions of 132 European political parties across 14 European Union member states. CHES results are regularly used by academics to classify parties with regard to their left-right ideological leanings, their key party platform positions, and their degree of populism, among other things.

We measure anti-elitism using an average of two variables in the CHES data. First, we used “PEOPLE_VS_ELITE,” which asked the experts to measure the parties with regard to their position on direct vs. representative democracy, where 0 means that the parties support elected officeholders making the most important decisions and 10 means that “the people,” not politicians, should make the most important decisions. Second, we used “ANTIELITE_SALIENCE,” which is a measure of the salience of anti-establishment and anti-elite rhetoric for that particular party, with 0 meaning not at all salient and 10 meaning extremely salient. The average of these two measures is shown in the table below as “anti-elitism.” In all countries, we consider parties that score above a 7.0 as “populist.”

[European Parliament]

Classifying parties as left or right

We can further classify these traditional and populist parties into two groups: left and right. To do so, we relied on the variable “LRGEN” in the CHES dataset, which asked experts to rate the positions of each party in terms of its overall ideological stance, with 0 meaning extreme left, 5 meaning center and 10 meaning extreme right. We define left parties as those that score below 5 and right parties as those above 5.

Table showing European populist party classifications sorted by whether they are on the left or right, country, and an anti-elitism score.

Appendix C: Economic categorization

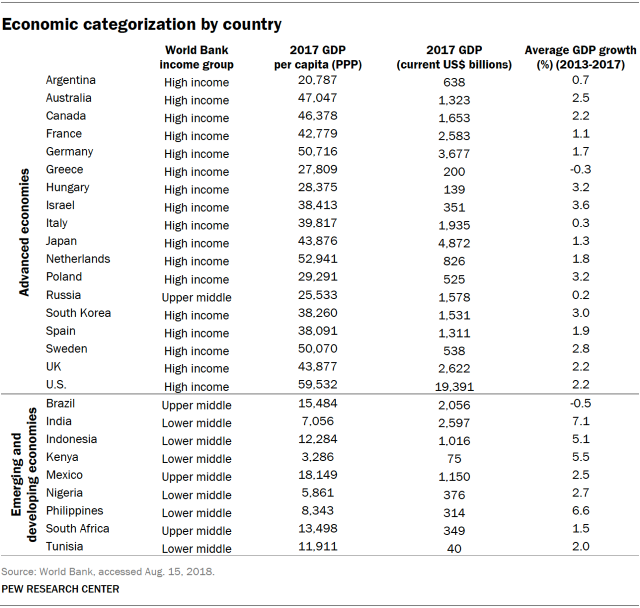
For this report we grouped countries into two economic categories: “advanced” and “emerging and developing.” In the report, this category is referred to as “emerging.” These categories are fairly common in specialized and popular discussions and are helpful for analyzing how public attitudes vary with economic circumstances. However, no single, agreed-upon scheme exists for placing countries into these three categories. For example, even the World Bank and International Monetary Fund do not always agree on how to categorize economies.

In creating our economic classification of the 27 countries in our survey, we relied on multiple sources and criteria. Specifically, we were guided by World Bank income classifications; classifications of emerging markets by other multinational organizations, such as the International Monetary Fund; per capita gross domestic product (GDP); total size of the country’s economy, as measured by GDP; and average GDP growth rate between 2013 and 2017.

Below is a table that outlines the countries that fall into each of the two categories. The table includes for each country the World Bank income classification, the 2017 GDP per capita based on purchasing power parity (PPP) in current prices, the 2017 GDP in current U.S. dollars and the average GDP growth rate between 2013 and 2017.

Table showing economic categorization by country.

Appendix D: Political categorization

6

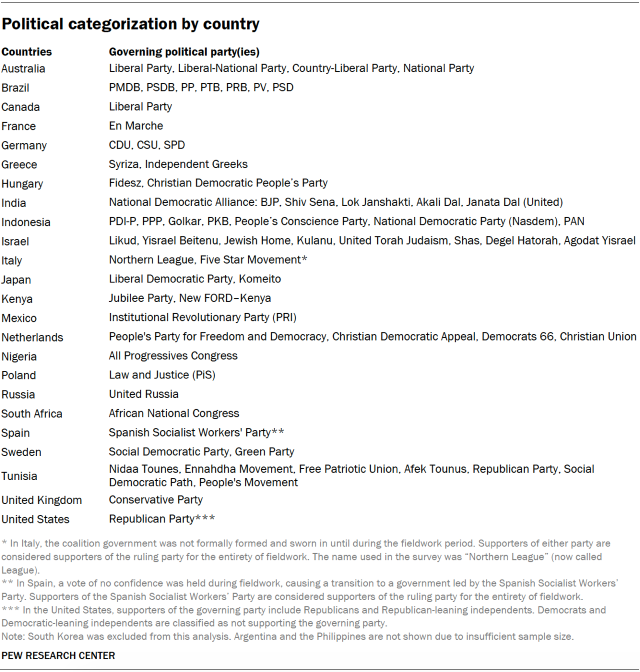
In countries where multiple political parties govern in coalition (as in many European countries), survey respondents who indicated support for any parties in the coalition were grouped together. In Germany, for example, where the center-right CDU/CSU governed with the center-left SPD at the time of the survey, supporters of all three parties were grouped together. In countries where different political parties occupy the executive and legislative branches of government, the party holding the executive branch was considered the governing party.

Survey respondents who did not indicate support for any political party, or who refused to identify with one, were classified as not supporting the government in power.

In some countries, no respondents identified with one or more of the parties currently in a coalition government. For example, the National Democratic Alliance in India officially consists of dozens of political parties, but many of those were not identified by any respondent as the party they felt closest to. Countries where an insufficient number of people identified with any party in government have been excluded from the analysis. Below is a table that outlines the governing political parties in each country; only political parties mentioned by respondents are shown.

Table showing political categorization by country.