Pew Research Center

FOR RELEASE OCTOBER 30, 2014

People in Emerging Markets Catch Up to Advanced Economies in Life Satisfaction

Asians Most Optimistic about Future, Middle Easterners the Least

FOR MEDIA OR OTHER INQUIRIES:

Communications Department
202.419.4372
www.pewresearch.org

RECOMMENDED CITATION

Pew Research Center, October 2014, "People in Emerging Markets Catch Up to Advanced Economies in Life Satisfaction"

About Pew Research Center

Pew Research Center is a nonpartisan, nonadvocacy fact tank that informs the public about the issues, attitudes and trends shaping the world. It does not take policy positions. The Center conducts public opinion polling, demographic research, computational social science research and other data-driven research. It studies politics and policy; news habits and media; the internet and technology; religion; race and ethnicity; international affairs; social, demographic and economic trends; science; research methodology and data science; and immigration and migration. Pew Research Center is a subsidiary of The Pew Charitable Trusts, its primary funder.

© Pew Research Center 2026

Table of contents

  • About Pew Research Center
  • People in Emerging Markets Catch Up to Advanced Economies in Life Satisfaction
  • Methods in Detail
  • Appendix A
  • Appendix B

People in Emerging Markets Catch Up to Advanced Economies in Life Satisfaction

Asians Most Optimistic about Future, Middle Easterners the Least

Measuring Life Satisfaction

To measure respondents’ well-being, we used the Cantril Ladder question that asks where respondents place themselves on the “ladder of life” with a scale from 0 to 10. The exact question wording is:

Here is a ladder representing the “ladder of life.” Let’s suppose the top of the ladder represents the best possible life for you and the bottom, the worst possible life for you. On which step of the ladder do you feel you personally stand at the present time?

GDP per Capita and Life Satisfaction: On Average, Life Satisfaction Higher in Richer Nations, Up to a Point

Asia, Africa Most Optimistic

These are among the key findings of a Pew Research Center survey, conducted in 43 countries among 47,643 respondents from March 17 to June 5, 2014. The question about where people stand on the ladder of life was asked in all 43 countries, and this report generally focuses on the differences and similarities in life satisfaction across economically advanced, emerging and developing nations. All other questions included in the report were only asked in emerging and developing economies, and the analysis on these questions is focused on the significant differences across regions.

Richer Publics More Satisfied with Life

Advanced, Emerging Economies Happier

On average, people in advanced and emerging economies are considerably happier with their life situation than those in developing economies. On a ladder where 10 represents the best possible life and 0 represents the worst possible life, a median of 53% in rich nations say they currently stand somewhere between 7 and 10. Half in emerging markets say the same compared with just about a third in developing economies (34%).

In 12 of the 24 emerging markets, at least half rate their life satisfaction highly. Latin American publics are the most content, with roughly two-thirds or more in Mexico, Venezuela, Brazil and Argentina saying they are doing well. About six-in-ten or more say the same in several Asian countries including Vietnam, China and Indonesia. Middle Eastern publics, such as people in Tunisia, Jordan and Egypt, tend to be the least satisfied among emerging nations. In addition, few Ukrainians are happy with their current life situation, perhaps reflecting the considerable turmoil in their country. In each of these four nations, about two-in-ten or more put themselves at the bottom of the ladder with a rating of three or below, including nearly a third (31%) in Egypt.

People in developing economies are much less satisfied with their lives than those in either advanced or emerging nations. In just two of the nine developing countries surveyed do more than half rate their life situation highly. And in four nations, a quarter or more say they are dissatisfied with their life today, including 30% in Tanzania who give a rating of three or below, 29% in Uganda, and 25% each in Ghana and Kenya.

Life satisfaction is strongly related to national per capita income, though the relationship is not one-to-one. As per capita income rises in a country, individuals are much more likely to be satisfied with their personal situation. However, the increase in life satisfaction due to national income starts to level off among richer countries. So, while South Africans (49%) are richer and considerably happier than Ghanaians (25%), they are nearly as satisfied as the much wealthier French (51%).

Rising Incomes and Increasing Happiness

Emerging Markets Improving Rapidly

Ratings among developing economies surveyed in 2007 and 2014 improved as well, though less dramatically. Ugandans and Palestinians1 are considerably happier today than seven years ago, but the increases in Tanzania and Ghana were smaller.

Meanwhile, attitudes in advanced economies have been relatively steady between 2007 and 2014. Even with the global recession and the decline in growth rates among advanced nations, reported well-being changed by less than five percentage points in Japan, Italy, South Korea, the U.S. and the UK. The one country that experienced a double-digit decline in satisfaction over the course of the recession was Spain. Meanwhile, Germans have become considerably happier over the same time period.

On Average, Richer Individuals More Content

Income and Satisfaction: Higher Income, More Happiness

There is also a strong relationship between wealth and life satisfaction among individuals within a country. Richer people are more likely than poorer people to report being happy with their current life situation. This manifests itself in the survey in two ways. First, higher income individuals rate their well-being more highly than lower income individuals.2 For example, 68% of higher income Germans rate their current situation at seven or higher on the ladder of life, compared with 48% of lower income Germans. The difference between higher and lower income individuals is significant in 28 of the countries surveyed, and the gap is 10 percentage points or higher in most nations.

Household Goods and Satisfaction: More Goods, More Happiness

Second, individuals with more key household goods are happier than those with fewer of these goods. The survey asked respondents whether their household had each of the following nine items: a television, refrigerator, washing machine, microwave oven, computer, car, bicycle, motorcycle/scooter and radio. The more items a person has on this list, the happier they tend to be.3 For example, in South Africa, 62% of people who have more household goods say they are satisfied with their life situation, compared with just 39% of people who have fewer of these possessions. The difference is significant in 37 of the countries surveyed, and again, the magnitude of the gap is 10 percentage points or higher in most countries.

The number of household goods an individual has is clearly related to their income. Nonetheless, multivariate regression analysis shows that the number of goods a person owns has an impact on their reported well-being even when controlling for income levels. So, if two people make the same amount of money, the person who owns more of these key household goods will, on average, be happier. For more details on this analysis, please see Appendix B.

Emerging and Developing Publics Happy with Health, Personal Life

In emerging and developing economies, people are most satisfied with their current health (global median of 70% saying 7,8,9 or 10) and the personal aspects of their life, including their family (69%), religion (68%) and social life (65%). Somewhat lower down the satisfaction scale are neighborhood safety (62%), the quality of schools in their community (57%), their standard of living (54%) and present job (54%). Nonetheless, there are clear regional differences.

In Asia, religion tends to be the area of life where individuals receive the most satisfaction. Roughly eight-in-ten or more in Indonesia (90%), Malaysia (85%), the Philippines (80%), Pakistan (79%) and Thailand (78%) say they are happy with their religious life. In China, health (79%) pops up as the most satisfying, while in Vietnam it is the safety of their neighborhood (77%). In India, the highest rated aspect is their social life (69%) followed closely by their health, family and religion (68% each). In nearly every country surveyed in Asia the lowest ratings go to either their present job (regional median of 60%) or their standard of living (58%).

Health and Personal Aspects of Life Most Satisfying, Job and Standard of Living Least

Middle Easterners also give their standard of living dismal ratings. Just 31% of Tunisians, 27% of Jordanians and 20% of Egyptians say they are happy with their material well-being. Across all 33 emerging and developing countries, Egyptians tend to be among the least satisfied with every aspect of life asked about. The area that publics in the Middle East are most satisfied with varies considerably across countries – Tunisians are happiest with their family (76%), Turks (73%) and Jordanians (57%) with their neighborhood safety, Palestinians with their religion (71%) and Egyptians are split between their religious life and their health (49% each).

In Eastern Europe, Poles (75%) and Ukrainians4 (62%) are most satisfied with the safety of their neighborhood while Russians cite their family life (56%). Again, standard of living is the least satisfying in Poland and Ukraine, with Ukrainians especially unhappy with their material well-being (27%). Russians, meanwhile, are least happy with their religious life (35%).

There are some clear demographic divides in who is happy and who is not with the different aspects of life. In nearly all countries, young people (age 18-29) are considerably more satisfied with their health than people age 50 and older. And in many countries, higher income individuals and those with more education are happier than lower income and less educated people with their standard of living, job, health, social life and family life. Income and education differences do not emerge in most countries when it comes to religion, neighborhood safety or schools.

While, in general, people in developing and emerging nations are happier with the personal aspects of their lives than with the economic ones, it is satisfaction with their standard of living that has the biggest impact on their overall happiness. People who rate their standard of living highly are much more likely than people who rate it poorly to say they are doing well. This relationship holds even when controlling for demographics and satisfaction with other aspects of life. For more details on the results, please see Appendix B.

Evaluating the Past and the Future

Asia Sees Most Progress

Many publics in Africa and Latin America also think they have made progress over the past five years, though considerable percentages rate their current situation as worse. Brazilians, in particular, think life is better today. Ghanaians, on the other hand, are the most likely across all 33 emerging and developing countries to say they are worse off.

Middle East Least Optimistic

In general, the countries where more people perceive they are better off today are the same countries where there has been a bigger increase in life satisfaction between the 2007 and 2014 surveys. For example, 66% of Chinese in 2014 say their life today is better than five years ago. Between the 2007 and 2014 surveys, the percentage of Chinese who rated their present life a seven or higher jumped by 26 percentage points. Egypt has one of the lowest percentages of people who say they have made progress in the past five years (32%). And between the 2007 and 2014 surveys, the percentage of Egyptians who say they are presently high on the ladder of life dropped 14 points.

Just as Asian publics are the most likely to say they have made progress in recent years, they are also the most optimistic about the next few years (regional median of 68% optimistic). In particular, broad majorities of Bangladeshis, Thais, Indonesians, Chinese, Filipinos and Indians expect their life in five years to be higher on the ladder than it is today. Pakistanis are considerably less sanguine about the future, but many say they don’t know where they will stand in five years (32%).

African nations are a very close second when it comes to optimism (regional median of 66%). Broad majorities in six of the seven African countries surveyed say their life will be better in five years. The one exception is South Africa, where half are optimistic for the future. Still, just 18% in South Africa think things will be worse.

Latin Americans are also generally positive about the future, especially Brazilians, Colombians, Peruvians and Nicaraguans. Salvadorans, Venezuelans and Mexicans are somewhat more pessimistic, with roughly two-in-ten saying life will get worse for them personally.

People in Eastern Europe and the Middle East tend to be more pessimistic about the next five years. Egyptians, Jordanians, Palestinians and Poles are the most likely among all 33 countries to say their life will worsen.

People Prioritize Nonmaterial Aspects of Life

The analysis of who is happy – and who is not – reveals that people with higher incomes and more household goods are more satisfied with life in general. But when individuals were asked to rate on a scale of 0 to 10 what is most important to them in life, nonmaterial things, such as good health (global median of 68% saying “10 – very important”), quality education for their children (65%) and safety from crime (64%), top the list. Still, owning a home (62%), a comfortable retirement (53%) and a fulfilling job (53%) are also ranked highly. Less important tends to be helping others (39%), owning a cell phone (39%), having free time for yourself (38%) and owning a car (34%). At the bottom of the list is being able to travel (29%) and having internet access (24%).

Globally, Good Health Most Important

Good health is – or ties for – the most important thing to have in life in 22 of the 33 countries surveyed. Similarly, internet access is – or ties for – the least important thing to have in life in 21 countries. These patterns hold across all regions surveyed.

Nonetheless, a few publics break the mold. Jordanians, Egyptians, Brazilians and Pakistanis tend to say safety from crime is more important than good health. Thais, Colombians, Argentines and Peruvians rank their child’s education as the highest priority, while the Indians and Tanzanians value both education and owning a home equally. Russians say helping others is their lowest priority, while being able to travel is least important to Poles, Tunisians, Thais, Vietnamese, the Chinese, Chileans, Nicaraguans, Tanzanians and South Africans.

Access to the internet ranks low on the priority list for most publics. However, there are stark differences by age and education in the importance of the internet. In most countries, young people and more highly educated individuals assign higher priority to accessing the internet than older people and less educated individuals. For example, in Chile, 54% of 18 to 29 year olds say it is very important to be able to use the internet compared with 17% of those age 50 or older. Large double-digit gaps in attitudes between the young and old on internet access also exist in Ukraine (+32), Poland (+28), Thailand (+28), Brazil (+27), Russia (+25), Tunisia (+25), El Salvador (+24), Turkey (+22) and Malaysia (+23). Similar differences by education exist in Chile (+27), Tunisia (+23), El Salvador (+23) and Senegal (+23).
Methods in Detail

About the 2014 Spring Pew Global Attitudes Survey

Results for the survey are based on telephone and face-to-face interviews conducted under the direction of Princeton Survey Research Associates International. Survey results are based on national samples. For further details on sample designs, see below.

The descriptions below show the margin of sampling error based on all interviews conducted in that country. For results based on the full sample in a given country, one can say with 95% confidence that the error attributable to sampling and other random effects is plus or minus the margin of error. In addition to sampling error, one should bear in mind that question wording and practical difficulties in conducting surveys can introduce error or bias into the findings of opinion polls.

Country: Argentina
Sample design: Multi-stage cluster sample stratified by locality size
Mode: Face-to-face adults 18 plus
Languages: Spanish
Fieldwork dates: April 17 – May 11, 2014
Sample size: 1,000
Margin of error: +/-3.9 percentage points
Representative: Adult population (excluding dispersed rural population, or 6.5% of the population)
Country: Bangladesh
Sample design: Multi-stage cluster sample stratified by administrative division and urbanity
Mode: Face-to-face adults 18 plus
Languages: Bengali
Fieldwork dates: April 14 – May 11, 2014
Sample size: 1,000
Margin of error: +/-3.8 percentage points
Representative: Adult population
Country: Brazil
Sample design: Multi-stage cluster sample stratified by region and size of municipality
Mode: Face-to-face adults 18 plus
Languages: Portuguese
Fieldwork dates: April 10 – April 30, 2014
Sample size: 1,003
Margin of error: +/-3.8 percentage points
Representative: Adult population
Country: Chile
Sample design: Multi-stage cluster sample stratified by region and urbanity
Mode: Face-to-face adults 18 plus
Languages: Spanish
Fieldwork dates: April 25 – May 5, 2014
Sample size: 1,000
Margin of error: +/-3.8 percentage points
Representative: Adult population (excluding Chiloe and other islands, or about 3% of the population)
Country: China
Sample design: Multi-stage cluster sample stratified by region and urbanity
Mode: Face-to-face adults 18 plus
Languages: Chinese (Mandarin, Fuping, Renshou, Suining, Xichuan, Hua, Shanghai, Chenzhou, Anlong, Chengdu, Yingkou, Guang’an, Zibo, Jinxi, Yantai, Feicheng, Leiyang, Yuanjiang, Daye, Beijing, Yangchun, Nanjing, Shucheng, Linxia, Yongxin, Chun’an, Xinyang, Shangyu, Baiyin, Ruichang, Xinghua and Yizhou dialects)
Fieldwork dates: April 11 – May 15, 2014
Sample size: 3,190
Margin of error: +/-3.5 percentage points
Representative: Adult population (excluding Tibet, Xinjiang, Hong Kong and Macau, or about 2% of the population). Disproportionately urban. The data were weighted to reflect the actual urbanity distribution in China.
Note: The results cited are from Horizonkey’s self-sponsored survey.
Country: Colombia
Sample design: Multi-stage cluster sample stratified by region and urbanity
Mode: Face-to-face adults 18 plus
Languages: Spanish
Fieldwork dates: April 12 – May 8, 2014
Sample size: 1,002
Margin of error: +/-3.5 percentage points
Representative: Adult population (excluding region formerly called the National Territories and the islands of San Andres and Providencia, or about 4% of the population)
Country: Egypt
Sample design: Multi-stage cluster sample stratified by governorate and urbanity
Mode: Face-to-face adults 18 plus
Languages: Arabic
Fieldwork dates: April 10 – April 29, 2014
Sample size: 1,000
Margin of error: +/-4.3 percentage points
Representative: Adult population (excluding frontier governorates, or about 2% of the population)
Country: El Salvador
Sample design: Multi-stage cluster sample stratified by department and urbanity
Mode: Face-to-face adults 18 plus
Languages: Spanish
Fieldwork dates: April 28 – May 9, 2014
Sample size: 1,010
Margin of error: +/-4.5 percentage points
Representative: Adult population
Country: France
Sample design: Random Digit Dial (RDD) sample of landline and cell phone households with quotas for gender, age and occupation and stratified by region and urbanity
Mode: Telephone adults 18 plus
Languages: French
Fieldwork dates: March 17 – April 1, 2014
Sample size: 1,003
Margin of error: +/-4.1 percentage points
Representative: Telephone households (roughly 99% of all French households)
Country: Germany
Sample design: Random Digit Dial (RL(2)D) probability sample of landline households, stratified by administrative district and community size, and cell phone households
Mode: Telephone adults 18 plus
Languages: German
Fieldwork dates: March 17 – April 2, 2014
Sample size: 1,000
Margin of error: +/-4.0 percentage points
Representative: Telephone households (roughly 99% of all German households)
Country: Ghana
Sample design: Multi-stage cluster sample stratified by region and settlement size
Mode: Face-to-face adults 18 plus
Languages: Akan (Twi), English, Dagbani, Ewe
Fieldwork dates: May 5 – May 31, 2014
Sample size: 1,000
Margin of error: +/-3.8 percentage points
Representative: Adult population
Country: Greece
Sample design: Multi-stage cluster sample stratified by region and urbanity
Mode: Face-to-face adults 18 plus
Languages: Greek
Fieldwork dates: March 22 – April 9, 2014
Sample size: 1,000
Margin of error: +/-3.7 percentage points
Representative: Adult population (excluding the islands in the Aegean and Ionian Seas, or roughly 6% of the population)
Country: India
Sample design: Multi-stage cluster sample stratified by region and urbanity
Mode: Face-to-face adults 18 plus
Languages: Hindi, Bengali, Tamil, Telugu, Marathi, Kannada, Gujarati, Odia
Fieldwork dates: April 14 – May 1, 2014
Sample size: 2,464
Margin of error: +/-3.1 percentage points
Representative: Adult population in 15 of the 17 most populous states (Kerala and Assam were excluded) and the Union Territory of Delhi (roughly 91% of the population). Disproportionately urban. The data were weighted to reflect the actual urbanity distribution in India.
Country: Indonesia
Sample design: Multi-stage cluster sample stratified by province and urbanity
Mode: Face-to-face adults 18 plus
Languages: Bahasa Indonesian
Fieldwork dates: April 17 – May 23, 2014
Sample size: 1,000
Margin of error: +/-4.0 percentage points
Representative: Adult population (excluding Papua and remote areas or provinces with small populations, or 12% of the population)
Country: Israel
Sample design: Multi-stage cluster sample stratified by district, urbanity and socioeconomic status, with an oversample of Arabs
Mode: Face-to-face adults 18 plus
Languages: Hebrew, Arabic
Fieldwork dates: April 24 – May 11, 2014
Sample size: 1,000 (597 Jews, 388 Arabs, 15 others)
Margin of error: +/-4.3 percentage points
Representative: Adult population (The data were weighted to reflect the actual distribution of Jews, Arabs and others in Israel.)
Country: Italy
Sample design: Multi-stage cluster sample stratified by region and urbanity
Mode: Face-to-face adults 18 plus
Languages: Italian
Fieldwork dates: March 18 – April 7, 2014
Sample size: 1,000
Margin of error: +/-4.3 percentage points
Representative: Adult population
Country: Japan
Sample design: Random Digit Dial (RDD) probability sample of landline households stratified by region and population size
Mode: Telephone adults 18 plus
Languages: Japanese
Fieldwork dates: April 10 – April 27, 2014
Sample size: 1,000
Margin of error: +/-3.2 percentage points
Representative: Landline households (roughly 86% of all Japanese households)
Country: Jordan
Sample design: Multi-stage cluster sample stratified by governorate and urbanity
Mode: Face-to-face adults 18 plus
Languages: Arabic
Fieldwork dates: April 11 – April 29, 2014
Sample size: 1,000
Margin of error: +/-4.5 percentage points
Representative: Adult population
Country: Kenya
Sample design: Multi-stage cluster sample stratified by province and settlement size
Mode: Face-to-face adults 18 plus
Languages: Kiswahili, English
Fieldwork dates: April 18 – April 28, 2014
Sample size: 1,015
Margin of error: +/-4.0 percentage points
Representative: Adult population
Country: Malaysia
Sample design: Multi-stage cluster sample stratified by state and urbanity
Mode: Face-to-face adults 18 plus
Languages: Bahasa Malaysia, Mandarin Chinese, English
Fieldwork dates: April 10 – May 23, 2014
Sample size: 1,010
Margin of error: +/-3.8 percentage points
Representative: Adult population (excluding difficult to access areas in Sabah and Sarawak, or about 7% of the population)
Country: Mexico
Sample design: Multi-stage cluster sample stratified by region and urbanity
Mode: Face-to-face adults 18 plus
Languages: Spanish
Fieldwork dates: April 21 – May 2, 2014
Sample size: 1,000
Margin of error: +/-4.0 percentage points
Representative: Adult population
Country: Nicaragua
Sample design: Multi-stage cluster sample stratified by department and urbanity
Mode: Face-to-face adults 18 plus
Languages: Spanish
Fieldwork dates: April 23 – May 11, 2014
Sample size: 1,008
Margin of error: +/-4.0 percentage points
Representative: Adult population (excluding residents of gated communities and multi-story residential buildings, or less than 1% of the population)
Country: Nigeria
Sample design: Multi-stage cluster sample stratified by region and urbanity
Mode: Face-to-face adults 18 plus
Languages: English, Hausa, Yoruba, Igbo
Fieldwork dates: April 11 – May 25, 2014
Sample size: 1,014
Margin of error: +/-4.3 percentage points
Representative: Adult population (excluding Adamawa, Borno, Cross River, Jigawa, Yobe, and some areas in Taraba, or roughly 12% of the population)
Country: Pakistan
Sample design: Multi-stage cluster sample stratified by province and urbanity
Mode: Face-to-face adults 18 plus
Languages: Urdu, Pashto, Punjabi, Saraiki, Sindhi
Fieldwork dates: April 15 – May 7, 2014
Sample size: 1,203
Margin of error: +/-4.2 percentage points
Representative: Adult population (excluding the Federally Administered Tribal Areas, Gilgit-Baltistan, Azad Jammu and Kashmir for security reasons, areas of instability in Khyber Pakhtunkhwa [formerly the North-West Frontier Province] and Baluchistan, military restricted areas and villages with less than 100 inhabitants – together, roughly 18% of the population). Disproportionately urban. The data were weighted to reflect the actual urbanity distribution in Pakistan.
Country: Palestinian territories
Sample design: Multi-stage cluster sample stratified by region and urban/rural/refugee camp population
Mode: Face-to-face adults 18 plus
Languages: Arabic
Fieldwork dates: April 15 – April 22, 2014
Sample size: 1,000
Margin of error: +/-4.4 percentage points
Representative: Adult population (excluding Bedouins who regularly change residence and some communities near Israeli settlements where military restrictions make access difficult, or roughly 5% of the population)
Country: Peru
Sample design: Multi-stage cluster sample stratified by region and urbanity
Mode: Face-to-face adults 18 plus
Languages: Spanish
Fieldwork dates: April 11 – May 2, 2014
Sample size: 1,000
Margin of error: +/-4.0 percentage points
Representative: Adult population
Country: Philippines
Sample design: Multi-stage cluster sample stratified by region and urbanity
Mode: Face-to-face adults 18 plus
Languages: Tagalog, Cebuano, Ilonggo, Ilocano, Bicolano
Fieldwork dates: May 1 – May 21, 2014
Sample size: 1,008
Margin of error: +/-4.0 percentage points
Representative: Adult population
Country: Poland
Sample design: Multi-stage cluster sample stratified by province and urbanity
Mode: Face-to-face adults 18 plus
Languages: Polish
Fieldwork dates: March 17 – April 8, 2014
Sample size: 1,010
Margin of error: +/-3.6 percentage points
Representative: Adult population
Country: Russia
Sample design: Multi-stage cluster sample stratified by Russia’s eight geographic regions, plus the cities of Moscow and St. Petersburg, and by urban-rural status
Mode: Face-to-face adults 18 plus
Languages: Russian
Fieldwork dates: April 4 – April 20, 2014
Sample size: 1,000
Margin of error: +/-3.6 percentage points
Representative: Adult population (excludes Chechen Republic, Ingush Republic and remote territories in the Far North – together, roughly 3% of the population)
Country: Senegal
Sample design: Multi-stage cluster sample stratified by region and urbanity
Mode: Face-to-face adults 18 plus
Languages: Wolof, French
Fieldwork dates: April 17 – May 2, 2014
Sample size: 1,000
Margin of error: +/-3.7 percentage points
Representative: Adult population
Country: South Africa
Sample design: Multi-stage cluster sample stratified by metropolitan area, province and urbanity
Mode: Face-to-face adults 18 plus
Languages: English, Zulu, Xhosa, South Sotho, Afrikaans, North Sotho
Fieldwork dates: May 18 – June 5, 2014
Sample size: 1,000
Margin of error: +/-3.5 percentage points
Representative: Adult population
Country: South Korea
Sample design: Random Digit Dial (RDD) probability sample of adults who own a cell phone
Mode: Telephone adults 18 plus
Languages: Korean
Fieldwork dates: April 17 – April 30, 2014
Sample size: 1,009
Margin of error: +/-3.2 percentage points
Representative: Adults who own a cell phone (roughly 96% of adults age 18 and older)
Country: Spain
Sample design: Random Digit Dial (RDD) probability sample of landline and cell phone-only households stratified by region
Mode: Telephone adults 18 plus
Languages: Spanish/Castilian
Fieldwork dates: March 17 – March 31, 2014
Sample size: 1,009
Margin of error: +/-3.2 percentage points
Representative: Telephone households (roughly 97% of Spanish households)
Country: Tanzania
Sample design: Multi-stage cluster sample stratified by region and urbanity
Mode: Face-to-face adults 18 plus
Languages: Kiswahili
Fieldwork dates: April 18 – May 7, 2014
Sample size: 1,016
Margin of error: +/-4.0 percentage points
Representative: Adult population (excluding Zanzibar, or about 3% of the population)
Country: Thailand
Sample design: Multi-stage cluster sample stratified by region and urbanity
Mode: Face-to-face adults 18 plus
Languages: Thai
Fieldwork dates: April 23 – May 24, 2014
Sample size: 1,000
Margin of error: +/-3.9 percentage points
Representative: Adult population (excluding the provinces of Narathiwat, Pattani, and Yala, or about 3% of the population)
Country: Tunisia
Sample design: Multi-stage cluster sample stratified by governorate and urbanity
Mode: Face-to-face adults 18 plus
Languages: Tunisian Arabic
Fieldwork dates: April 19 – May 9, 2014
Sample size: 1,000
Margin of error: +/-4.0 percentage points
Representative: Adult population
Country: Turkey
Sample design: Multi-stage cluster sample stratified by region, urbanity and settlement size
Mode: Face-to-face adults 18 plus
Languages: Turkish
Fieldwork dates: April 11 – May 16, 2014
Sample size: 1,001
Margin of error: +/-4.5 percentage points
Representative: Adult population
Country: Uganda
Sample design: Multi-stage cluster sample stratified by region and urbanity
Mode: Face-to-face adults 18 plus
Languages: Luganda, English, Runyankole/Rukiga, Luo, Runyoro/Rutoro, Ateso, Lugbara
Fieldwork dates: April 25 – May 9, 2014
Sample size: 1,007
Margin of error: +/-3.9 percentage points
Representative: Adult population
Country: Ukraine
Sample design: Multi-stage cluster sample stratified by Ukraine’s six regions plus ten of the largest cities – Kyiv (Kiev), Kharkiv, Dnipropetrovsk, Odessa, Donetsk, Zaporizhia, Lviv, Kryvyi Rih, Lugansk, and Mikolayev – as well as three cities on the Crimean peninsula – Simferopol, Sevastopol, and Kerch
Mode: Face-to-face adults 18 plus
Languages: Russian, Ukrainian
Fieldwork dates: April 5 – April 23, 2014
Sample size: 1,659
Margin of error: +/-3.3 percentage points
Representative: Adult population (Survey includes oversamples of Crimea and of the South, East and Southeast regions. The data were weighted to reflect the actual regional distribution in Ukraine.)
Country: United Kingdom
Sample design: Random Digit Dial (RDD) probability sample of landline households, stratified by government office region, and cell phone-only households
Mode: Telephone adults 18 plus
Languages: English
Fieldwork dates: March 17 – April 8, 2014
Sample size: 1,000
Margin of error: +/-3.4 percentage points
Representative: Telephone households (roughly 98% of all households in the United Kingdom)
Country: United States
Sample design: Random Digit Dial (RDD) probability sample of landline and cell phone households
Mode: Telephone adults 18 plus
Languages: English, Spanish
Fieldwork dates: April 22 – May 11, 2014
Sample size: 1,002
Margin of error: +/-3.5 percentage points
Representative: Telephone households with English or Spanish speakers (roughly 96% of U.S. households)
Country: Venezuela
Sample design: Multi-stage cluster sample stratified by region and parish size
Mode: Face-to-face adults 18 plus
Languages: Spanish
Fieldwork dates: April 11 – May 10, 2014
Sample size: 1,000
Margin of error: +/-3.5 percentage points
Representative: Adult population (excluding remote areas, or about 4% of population)
Country: Vietnam
Sample design: Multi-stage cluster sample stratified by region and urbanity
Mode: Face-to-face adults 18 plus
Languages: Vietnamese
Fieldwork dates: April 16 – May 8, 2014
Sample size: 1,000
Margin of error: +/-4.5 percentage points
Representative: Adult population

Appendix A

Economic categorization:

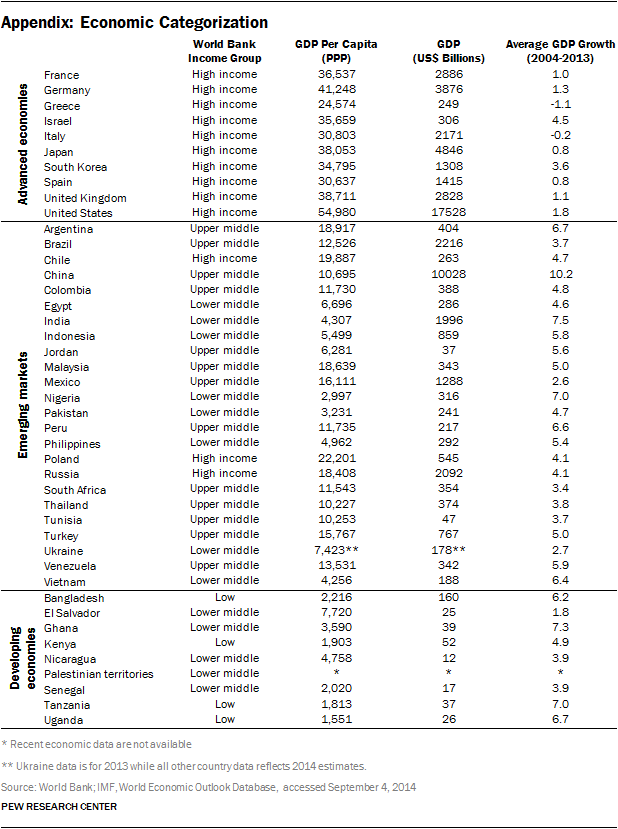
For this report we grouped countries into three economic categories: “advanced,” “emerging” and “developing.” These categories are fairly common in specialized and popular discussions and are helpful for analyzing how public attitudes vary with economic circumstances. However, no single, agreed upon scheme exists for placing countries into these three categories. For example, even the World Bank and International Monetary Fund do not always agree on how to categorize economies.

In creating our economic classification of the 43 countries in our survey, we relied on multiple sources and criteria. Specifically, we were guided by: World Bank income classifications; classifications of emerging markets by other multi-national organizations, such as the International Monetary Fund; per capita Gross Domestic Product (GDP); total size of the country’s economy, as measured by GDP; and average GDP growth rate over the past 10 years.

Below is a table that outlines the countries that fall into each of the three categories. The table includes for each country the World Bank income classification, the GDP per capita based on purchasing power parity (PPP), the GDP in current prices and average GDP growth rate over the past 10 years.

Satisfaction 31

Appendix B

Factors that Influence Life Satisfaction

To explore the relationship between demographics, satisfaction with specific aspects of life and overall life satisfaction, we used a statistical technique called multivariate regression, which allowed us to test the individual impact of a number of factors on life satisfaction while holding other variables constant. We ran a multilevel, mixed effects, multivariate regression on all countries pooled (see here for full results), but found similar results when estimating the regression in each country separately. We analyzed two models: one that includes demographics only and one that includes satisfaction with various aspects of life and demographics.

Overall, we find that economic factors, including income, number of key household goods and satisfaction with standard of living, have the biggest impact on individual happiness. Education, gender, marital status and employment as well as satisfaction with family, friends and health also matter, though to a lesser degree.

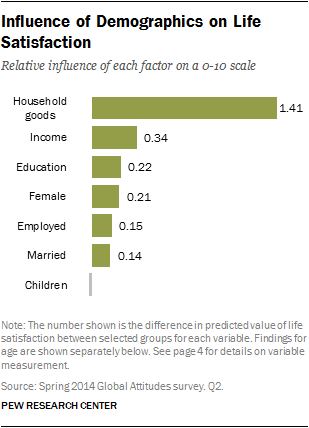
Influence of Demographics on Life Satisfaction

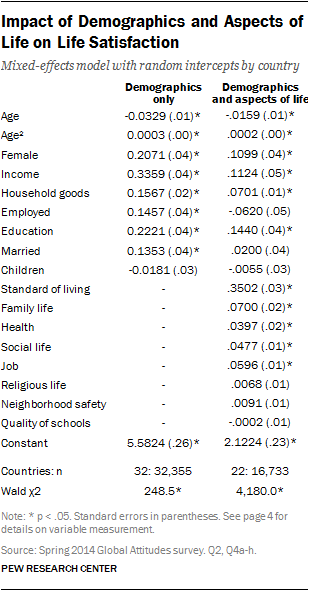
In our first model with just demographics, we find that the number of key household goods a person owns from a list of nine items has the greatest influence on individual life satisfaction. The survey asked respondents whether their household had in working order each of the following nine items – television, refrigerator, washing machine, microwave oven, computer, car, bicycle, motorcycle/scooter and radio. A person who owns none of the nine household items has a predicted overall life satisfaction of 5.55 points on a 0-10 scale. A person who reports owning all nine items has a predicted satisfaction of 6.96, a difference of 1.41 points. In addition to possessions, income (+0.34 points), education (+0.22), and being a woman (+0.21), employed (+0.15) or married (+0.14) all have a significant, positive impact on happiness (see page 4 for details on variable measurement). Having children under the age of eighteen living at home does not significantly impact life satisfaction.

Age and Life Satisfaction

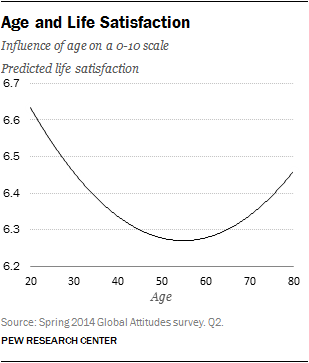
Age also has a significant influence on happiness, controlling for other demographics. As people approach middle age, they are less content with their lives than younger individuals, hitting their lowest point in their 50s, with a predicted level of satisfaction of 6.28 for a decrease of 0.36 relative to a 20 year old. As they reach 75, predicted happiness increases 0.11 points to 6.39.

Influence of Aspects of Life on Satisfaction

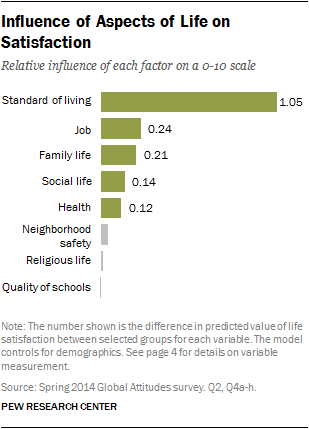
Our second model demonstrates that, alongside demographics, happiness with specific aspects of individuals’ lives influences their overall satisfaction. Economic, rather than personal, factors have the greatest influence on happiness, even when controlling for individual finances. A person who rates their standard of living low on a 0-10 scale (at the global 25th percentile) has a predicted overall life satisfaction of 5.79. An individual who is highly satisfied with their standard of living (at the global 75th percentile) has a predicted life satisfaction of 6.84 – a difference of 1.05 points. Satisfaction with their job (+0.24), family life (+0.21), social life (+0.14) and health (+0.12) also has a positive – though smaller – impact on overall well-being.

Happiness with neighborhood safety, religious life and local schools does not have a statistically significant effect on individual happiness. When accounting for satisfaction with aspects of life, most demographic characteristics remain significant, including income and possessions. Marital and employment status, however, are no longer key predictors of satisfaction.

Details of Analysis

Impact of Demographics and Aspects of Life on Life Satisfaction

The results reported are based on a weighted, linear mixed-effects model with random intercepts by country and standard errors clustered by country. In addition to the mixed-effects model, we also estimated an ordinary least squares (OLS) regression with country dummy variables, survey weights and clustered standard errors, and an OLS regression with country dummy variables that accounted for the complex survey design of the data. All models provided similar coefficients and significance tests, though the standard errors in the approach we ultimately used were generally the most conservative. Alongside these pooled models, we evaluated the robustness of the results by estimating the models for each country separately. These country-specific models yielded similar conclusions.

The demographic analysis on life satisfaction comprises a sub-sample (countries=32, n=32,355) of the 43 nations in the survey, excluding 11 countries in which 20% or more of the sample answered “Don’t know” or “Refused” when asked their household income.1 The demographic and life aspects analysis also comprises a sub-sample (countries =22, n=16,733) of the 43 nations, excluding countries without results for all items of the question about satisfaction with specific aspects of life and countries with low response rates on the income variable.2

The dependent variable is life satisfaction, measured on an 11-point scale. Respondents are asked to place themselves on a ladder, where the top of the ladder (10) represents the best possible life for them and the bottom represents the worst possible life (0). For this analysis, the ladder variable is treated as continuous and people who responded “Don’t know” or “Refused” are excluded.

We use two sets of independent or predictor variables: demographics and satisfaction with various areas of life. We include basic demographic variables known to impact life satisfaction and happiness – age and gender (Argyle 2003; Graham 2009), financial resources (Dolan et al 2008; Easterlin 1974, 2003), education (Graham 2009) and marriage and children (Glenn and Weaver 1979; Nomaguchi and Milkie 2003). All variables are self-reported with the exception of gender and are coded as follows:

  • Female: A dummy variable where 1 indicates female and 0 indicates male
  • Age: A continuous variable measured in years, which runs from 18 to 97; tested for a quadratic relationship with age squared
  • Household goods: An additive scale, ranging from 0 to 9, of the number of items in working order in a respondent’s household, including television, refrigerator, washing machine, microwave oven, computer, car, bicycle, motorcycle/scooter and radio
  • Income: A dummy variable where 1 indicates a reported income at the approximate median income cutoff for the country or higher and 0 indicates a reported income below the median
  • Education: A dummy variable where 1 indicates more highly educated and 0 indicates less educated; in advanced economies, the lower category is secondary education or below and the higher category is post-secondary education; in developing and emerging economies, the lower category is below secondary education and the higher category is secondary or above
  • Married: A dummy variable where 1 indicates a respondent is married and 0 indicates unmarried (single, divorced, widowed, etc.)
  • Employed: A dummy variable where 1 indicates the respondent is in paid work and 0 indicates the respondent is not in paid work (student, retired, unemployed, etc.)
  • Children: A dummy variable where 1 indicates the respondent has children under age 18 living at home and 0 indicates no children under 18 at home

Satisfaction with areas of life: Respondents were asked to rate their level of satisfaction, where 0 means very dissatisfied and 10 means very satisfied, with each of the following areas of their lives: standard of living, family life, health, social life, present job, religious life, neighborhood safety and quality of local schools.

Bibliography

Argyle, Michael. “Causes and Correlates of Happiness.” Well-being: The foundations of hedonic psychology. Eds. Daniel Kahneman, Ed Diener, and Norbert Schwarz. New York: Russell Sage Foundation, 2003. 353-373.

Blanchflower, David G. and Andrew J. Oswald. “Is well-being U-shaped over the life cycle?” Social Science & Medicine 66.8 (2008): 1733-1749.

Cantril, Hadley. The Pattern of Human Concerns. New Jersey: Rutgers University Press, 1965.

Diener, Ed, et al. “The relationship between income and subjective well-being: Relative or absolute?” Social Indicators Research 28.3 (1993): 195-223.

Dolan, Paul, Tessa Peasgood and Mathew White. “Do we really know what makes us happy? A review of the economic literature on the factors associated with subjective well-being.” Journal of Economic Psychology 29.1 (2008): 94-122.

Easterlin, Richard A. “Does economic growth improve the human lot? Some empirical evidence.” Nations and Households in Economic Growth 89 (1974): 89-125.

Easterlin, Richard A. “Explaining happiness.” Proceedings of the National Academy of Sciences 100.19 (2003): 11176-11183.

Glenn, Norval D. and Charles N. Weaver. “A note on family situation and global happiness.” Social Forces 57.3 (1979): 960-967.

Graham, Carol. “The economics of happiness: Insights on globalization from a novel approach.” World Economics 6.3 (2005): 41-55.

Graham, Carol. Happiness around the world: The paradox of happy peasants and miserable millionaires. New York: Oxford University Press, 2009.

Nomaguchi, Kei M. and Melissa A. Milkie. “Costs and rewards of children: The effects of becoming a parent on adults’ lives.” Journal of Marriage and Family 65.2 (2003): 356-374.

Stevenson, Betsey and Justin Wolfers. “Economic growth and subjective well-being: Reassessing the Easterlin paradox.” No. w14282. National Bureau of Economic Research, 2008.