
Pew Research Center

FOR RELEASE SEPTEMBER 16, 2014

Faith and Skepticism about Trade, Foreign Investment

Developing countries provide the strongest support for international trade and foreign investment, while people in many advanced economies are skeptical. Americans are among the least likely to hold a positive view of the impact of trade on jobs and wages.

FOR MEDIA OR OTHER INQUIRIES:

Communications Department
202.419.4372
www.pewresearch.org

RECOMMENDED CITATION

Pew Research Center, September 2014, "Faith and Skepticism about Trade, Foreign Investment"

About Pew Research Center

Pew Research Center is a nonpartisan, nonadvocacy fact tank that informs the public about the issues, attitudes and trends shaping the world. It does not take policy positions. The Center conducts public opinion polling, demographic research, computational social science research and other data-driven research. It studies politics and policy; news habits and media; the internet and technology; religion; race and ethnicity; international affairs; social, demographic and economic trends; science; research methodology and data science; and immigration and migration. Pew Research Center is a subsidiary of The Pew Charitable Trusts, its primary funder.

© Pew Research Center 2026

Table of contents

  • About Pew Research Center
  • Faith and Skepticism about Trade, Foreign Investment
  • Methods in Detail
  • Appendix

Faith and Skepticism about Trade, Foreign Investment

Developing countries provide the strongest support for international trade and foreign investment, while people in many advanced economies are skeptical. Americans are among the least likely to hold a positive view of the impact of trade on jobs and wages.

Trade and foreign investment engender both faith and skepticism around the world, according to a new Pew Research Center survey of 44 nations.

Global publics generally agree that international commercial activity is a good thing, particularly people in developing and emerging economies.

Developing Nations Are Generally More Positive about Certain Trade Benefits

Developing countries provide the strongest support across the board for foreign investment, trade and the benefits to be derived from globalization. A median of 87% of those surveyed in the developing world say trade is good for the economy, including 47% who say it is very good. Fully 85% see foreign companies building plants in their country as beneficial. In addition, 66% say growing international business ties create jobs and 57% say foreign companies buying domestic companies is good. And 55% voice the view that trade increases wages.

A median of 78% in emerging markets see trade as beneficial, including 25% who say it is very good. And 52% say trade creates jobs, while a plurality believes it leads to higher wages (45%). Such emerging market sentiment may reflect the experience in China and elsewhere, where growing international business ties have been associated with more employment opportunities and higher incomes.

However, overall support for trade in emerging markets has waned slightly in recent years. Among the 13 emerging market countries surveyed in both 2010 and 2014, the median view that international trade and business ties are good has dipped from 84% four years ago to 77% today. This may, in part, be due to the fact that the annual rate of export growth by the emerging markets surveyed slowed from an average of 14% in 2010 to 3% in 2013, according to the World Bank.

Views of the impact of trade on prices are among the most striking findings from this new survey. Most economists contend that trade lowers prices for consumers. But half of those in developing countries (a median of 50%) and a plurality (42%) in emerging markets say trade actually increases the prices of products sold. Publics in advanced economies are divided on the topic.

These are the results of a Pew Research Center survey conducted among 48,643 respondents from March 17 to June 5, 2014.

The Champions of Trade

Most Likely to Say Trade Creates Jobs

The benefits of trade are strongly appreciated in developing and emerging markets.

Among all countries surveyed, Tunisians (87%), Ugandans (82%) and Vietnamese (78%) are the most likely to say trade creates new employment. Just 5% of Tunisians and Vietnamese fear that trade destroys jobs.

Ugandans (79%), Bangladeshis (78%) and Lebanese (77%) have the greatest faith that trade leads to higher wages. Only 12% of Ugandans, 14% of Bangladeshis and 7% of Lebanese voice the view that growing international business ties undermine domestic incomes.

Most Likely to Say Trade Boosts Wages

Roughly six-in-ten Chinese (61%) also see growing international business ties as a way to improve local incomes. Such sentiment may be rooted in China’s recent experience. Wages have grown by an average of more than 10% annually for more than a decade at a time when the country’s merchandise exports were rising an average of 15% per year.

People in emerging and developing countries such as Bangladesh (69%), Tanzania (68%), the Philippines (66%) and Kenya (66%) are also the most open to foreigners buying their local companies. Roughly a third or less in those nations see such foreign investment as a bad thing.

The Trade Doubters

Americans Less Convinced Trade Is Good

Some of the greatest public skepticism about trade and foreign investment is found in the United States. In 2002, 78% of Americans held the view that growing trade and business ties with other countries was a good thing. This sentiment was roughly comparable to that voiced at the time in the other 14 nations surveyed every year between 2002 and 2014.

But then Americans’ mood began to change. By 2007, before the Great Recession hit, the U.S. public’s belief in the benefit of growing international business ties had fallen 19 percentage points to 59% and would tumble further to 53%, in 2008. Faith in the value of trade remained fairly steady worldwide during this time period. By 2010, global belief in the efficacy of trade was at 84%, while the U.S. number recovered to only 66%. Since then, the global median has slid to 76%, pulled down by eroding confidence in trade in some emerging markets, while views in the U.S. have remained relatively stable at 68% in 2014.

Americans Unsure of Trade Benefits
Key Advanced Economies Quite Wary of Global Economic Engagement

But Americans are not alone in voicing doubts about trade and foreign investment. Publics in a number of other advanced economies – in particular France, Italy and Japan – stand out for their skepticism. These nations matter because the four account for nearly a quarter (24%) of world merchandise imports and around a fifth (21%) of world services imports. Protectionist sentiments in any of these societies, if acted upon, can reverberate around the world.

A global median, excluding those four countries, of just 19% hold the view that trade destroys jobs. But 59% of Italians, 50% of Americans, 49% of French and 38% of Japanese see trade as destructive of employment. Just 21% of the global public in the survey hold the view that trade lowers wages. But 52% of Italians, 47% of the French, 45% of Americans and 37% of Japanese say trade undermines domestic incomes. And 46% of the world public voices the view that foreign companies buying domestic firms is bad for their country. Fully 76% of Japanese, 73% of Italians, 68% of French and 67% of Americans judge foreign-led M&A harshly.

Notably, the French and Americans manifest some of the only demographic differences on trade and investment-related concerns. Women more than men express the opinion that trade hurts employment in the U.S. (55% to 46%) and in France (54% to 45%). In both countries, older people, those ages 50 and above, are less enthusiastic about trade in general than younger people, those ages 18 to 29. Older people in the U.S. and France are also more likely than younger people to say trade destroys jobs. Similarly, lower income Americans and French are more fearful trade will decrease employment than are their fellow countrymen with upper incomes.

Implications for Major Trade Deals

France, Japan, U.S. Out of Step

The U.S., Japan and France are the first, third and fifth largest economies in the world. Japan and the United States are the two principal protagonists in efforts to negotiate the Trans-Pacific Partnership (TPP) among a dozen countries from Asia, North America and South America that border on the Pacific Ocean. France and the United States are negotiating the Transatlantic Trade and Investment Partnership (TTIP) along with 27 other European Union members. Governments’ objective in doing these deals is to spur economic growth and job creation and to boost incomes.

American, French, Italian and Japanese views are out of step with those of their TPP and TTIP counterparts on a number of trade and investment issues. Americans and Japanese are far less likely than publics in other TPP countries (a median of 55%) to hold the view that growing international business ties will create new employment, a politically sensitive issue in each country. And French (24%), Americans (20%) and Italians (13%) are less likely than their TTIP negotiating partners (a median of 50%) to agree that trade leads to more jobs. Americans, French, Italians and Japanese are also more skeptical than others in the two sets of trade talks about the impact of trade on wages and the value of foreigners buying local companies.

1. Trade Broadly Viewed as Beneficial

There is a widely shared public consensus around the world that growing trade and business ties between one’s own country and other nations are a good thing. This view is held by men and women, by rich and poor, by young and old, by those who are well educated and by less educated people and by people across the political spectrum. A majority in each of the 44 countries surveyed — in most cases an overwhelming majority — voice the view that such globalization is good for their nation.

Growing Trade Seen Positively

Among those African economies surveyed, a median of 87% say trade is good, including 47% who voice the view that it is very good for their country. The African countries most enamored of trade are Uganda (70% very good), Tanzania (54%) and Nigeria (53%).

In Asia, a median of 86% express the opinion that such business ties are beneficial, including 24% who say it is very good. The Vietnamese (53% very good) are particularly taken by trade.

In Latin America, 80% see trade as a good thing. In the region, Nicaraguans (64% very good) are the most enthusiastic about the benefit of international commerce. In the Middle East, 77% view trade as good, including Tunisians (77% very good) and Lebanese (50%) who voice the strongest backing.

The weakest overall support for trade is in Turkey (57% good), but even there over half the public accepts the proposition that international commerce is good for the society. Notably, enthusiasm for trade has eroded significantly in Italy. In 2002, 80% of Italians said trade was good for the country. That backing fell to 68% in 2007 and to 59% by 2014.

2. Trade Creates Jobs

Country Views of Trade & Job Growth

One reason global publics may believe that trade is good for their country is that, by medians of nearly three-to-one, they hold the view that trade with other nations leads to job creation in their country rather than job loss.

Education plays a role in such views. In 17 nations better educated people are significantly more likely than less educated ones to think trade creates employment opportunities. This is particularly the case in Peru, the UK, Mexico, Pakistan and Spain. But in only five societies – including France, Spain and the UK – are less educated people more likely to say trade destroys jobs.1

3. Trade Raises Wages

National Views of Trade & Wages

Publics in developing countries are most likely to voice this view. A median of more than half (55%) say such commerce raises incomes, while just 20% hold that it decreases wages. Emerging market opinion is similar: 45% say trade boosts take home pay, 20% contend that it undermines wages.

Ugandans (79%), Bangladeshis (78%), Lebanese (77%), Tunisians (73%) and Vietnamese (72%) are the most likely to associate trade with rising wages.

Those who are most likely to hold the view that trade hurts wages are Italians (52%), Greeks (49%), French (47%), Americans (45%) and Colombians (43%).

There is a strong relationship between the recent performance of the economy and views on the impact of trade on wages. The faster an economy grew on average between 2008 and 2013, the greater likelihood that the public holds the view that trade boosts wages.
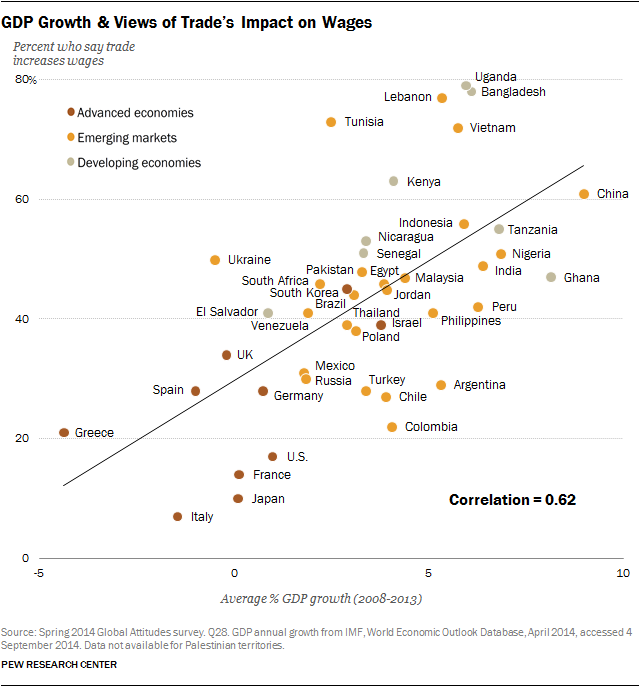
GDP Growth & Views of Trade's Impact on Wages

4. Trade and Prices

Emerging & Developing Economies See Trade Fueling Inflation

It is a fundamental principle of modern free market economics that trade enhances competition and thus enables consumers to enjoy lower prices than they would otherwise have to pay if they depended solely on domestic production of the goods and services that they consume.

In only one country, Israel (58%), does a majority accept economists’ proposition that trade leads to price cuts. In 13 nations – including major economies such as China (58%), Indonesia (58%) and Brazil (55%) – at least half the public voices the view that trade contributes to price rises.

Publics in Africa (median of 50%) and Asia (48%) are the most likely to say trade raises price levels. Europeans (35%), people in the Middle East (33%) and Americans (32%) are among the least likely to blame trade.

It would appear that economic literacy has little to do with public views on the relationship between trade and prices, at least to the extent that an understanding of economic theory is related to educational attainment. In just 10 nations do better educated people buy the argument that trade lowers prices. Notably, in a number of emerging and developing countries – Pakistan, Peru, the Palestinian territories, India, Vietnam, Indonesia, El Salvador, Malaysia and Mexico – it is better educated people who are of the opinion that trade leads to higher prices.

5. Build Here, Don’t Buy Here

Contrasting Views of Foreign Investment

Foreign investment has long been considered by many economists to be more important economically than trade. Foreign direct investment, either through the construction of new plants or through the acquisition of existing companies (as opposed to the purchase of stocks and bonds abroad), is fairly long lasting, while trade volumes can change from year to year. Much trade is between divisions of the same company, so foreign investment often drives international trade as firms exchange components and services between their affiliates. And foreign investment leads to the broad dissemination of technologies and production practices, benefiting the recipients of such investment in intangible ways.

Publics are of two minds about foreign direct investment. A global median of 74% approve of foreign firms building new factories in their country, sometimes referred to as greenfield investments, because these can mean new jobs and greater economic activity. But they are divided (45% good, 47% bad) about foreign companies buying local enterprises, which can mean new management, a new business culture and possible company consolidation with attendant job losses.

The differences in preferences are quite striking. A median of more than eight-in-ten in developing economies (85%) see greenfield investment as positive, but only 57% give a thumbs up to foreign-led mergers and acquisitions (M&A), a 28 percentage point difference.

Among developing nations, African countries are the most supportive of foreigners investing in their economies. Overwhelming majorities in all five African developing economies say foreign greenfield investment is good. And roughly half or more hold the view that foreign acquisitions of domestic firms is beneficial. Among these African publics, Kenyans (66% foreign M&A is good, 88% foreign greenfield is good) and Tanzanians (68%, 84%) are particularly supportive of both types of foreign capital inflows.

Publics Divided on Foreigners Buying Local Companies

In emerging markets, a median of 70% backs foreigners building new plants in their country, but just 44% say foreigners buying local firms is a good thing, a 26 point difference. The emerging market BRICS economies –Brazil, Russia, India, China and South Africa– are generally supportive of foreign investment with two exceptions: only 38% of Russians and 39% of Chinese say foreign acquisitions are good for their country. Notably, Indians back both forms of foreign investment (68% greenfield, 56% foreign M&A), despite the fact that their government has long limited foreign investors’ access to the Indian economy.

American sentiment toward foreign investment is mixed: 75% say foreign investment in new plants in the United States is a good thing for the U.S. economy, but just 28% believe that foreign acquisition of firms in the U.S. is beneficial.

6. Implications for TPP and TTIP

Major trading nations are currently involved in negotiating two mega-regional trade agreements: The Trans-Pacific Partnership (TPP) and the Transatlantic Trade and Investment Partnership (TTIP).

Vietnam Most Enthusiastic Among TPP Countries

TPP involves the United States, Japan and ten other nations on both sides of the Pacific Ocean, which account for nearly two-fifths of world GDP and one-third of world trade.

TTIP involves the United States and the 28 nations of the European Union. Together they account for about half of the global economy and nearly a third of world trade flows.

The Vietnamese are the most enthusiastic backers of both trade and investment among the TPP nations surveyed, followed by Malaysians.

Notably, some of the weakest support for both trade and foreign investment, and some of the greatest skepticism about its impact, exists in Japan and the United States, the two pivotal TPP nations that together account for the lion’s share of both the economic activity and trade between the dozen countries involved. Just 10% of Japanese and 17% of Americans say trade increases wages. Only 15% of Japanese and 20% of Americans say it grows jobs. And just 17% of Japanese and 28% of Americans favor foreign acquisition of domestic firms. In each of these cases, Japanese and American support is the lowest among the TPP nations surveyed.

The “I” in TTIP stands for investment. The U.S. and Europe are each other’s primary source and destination for foreign direct investment. And boosting that trans-Atlantic investment further is one of the main objectives of the negotiation. Publics on both sides of the Atlantic are of two minds about such a goal, however. A median of 75% say foreign investment is a good thing if it leads to construction of new plants in their country. But just 32% voice the view that foreigners buying companies in their country is good.

Italy Most Wary Among TTIP Nations

Among the TTIP countries, the Italians are the most wary of the benefits of both international commerce and foreign investment. Only 13% say trade creates jobs, just 7% see it increasing wages and 23% voice the view that foreign firms buying Italian companies is a good thing.

Notably, 79% of Germans say foreign-led M&A is bad for the country and 33% even view foreigners building plants in Germany in a negative light. Such opposition to foreign investment is the highest among the TTIP countries surveyed.

Such doubts about the specific benefits of trade and foreign investment do not, necessarily, translate into public opposition to TPP and TTIP. An April 2014 Pew Research survey found that 75% of Germans said increasing trade with the United States would be a good thing and 72% of Americans believed that growing commerce with the European Union would be good. Over half of Germans (55%) and Americans (53%) thought TTIP would be good for their country. With regard to TPP, 74% of Americans said boosting trade with Japan, the principal other economy in the TPP negotiation, would be beneficial. And 55% of Americans favored TPP.

Methods in Detail

About the 2014 Spring Pew Global Attitudes Survey

Results for the survey are based on telephone and face-to-face interviews conducted under the direction of Princeton Survey Research Associates International. Survey results are based on national samples. For further details on sample designs, see below.

The descriptions below show the margin of sampling error based on all interviews conducted in that country. For results based on the full sample in a given country, one can say with 95% confidence that the error attributable to sampling and other random effects is plus or minus the margin of error. In addition to sampling error, one should bear in mind that question wording and practical difficulties in conducting surveys can introduce error or bias into the findings of opinion polls.

Country: Argentina
Sample design: Multi-stage cluster sample stratified by locality size
Mode: Face-to-face adults 18 plus
Languages: Spanish
Fieldwork dates: April 17 – May 11, 2014
Sample size: 1,000
Margin of error: +/-3.9 percentage points
Representative: Adult population (excluding dispersed rural population, or 6.5% of the population)
Country: Bangladesh
Sample design: Multi-stage cluster sample stratified by administrative division and urbanity
Mode: Face-to-face adults 18 plus
Languages: Bengali
Fieldwork dates: April 14 – May 11, 2014
Sample size: 1,000
Margin of error: +/-3.8 percentage points
Representative: Adult population
Country: Brazil
Sample design: Multi-stage cluster sample stratified by region and size of municipality
Mode: Face-to-face adults 18 plus
Languages: Portuguese
Fieldwork dates: April 10 – April 30, 2014
Sample size: 1,003
Margin of error: +/-3.8 percentage points
Representative: Adult population
Country: Chile
Sample design: Multi-stage cluster sample stratified by region and urbanity
Mode: Face-to-face adults 18 plus
Languages: Spanish
Fieldwork dates: April 25 – May 5, 2014
Sample size: 1,000
Margin of error: +/-3.8 percentage points
Representative: Adult population (excluding Chiloe and other islands, or about 3% of the population)
Country: China
Sample design: Multi-stage cluster sample stratified by region and urbanity
Mode: Face-to-face adults 18 plus
Languages: Chinese (Mandarin, Fuping, Renshou, Suining, Xichuan, Hua, Shanghai, Chenzhou, Anlong, Chengdu, Yingkou, Guang’an, Zibo, Jinxi, Yantai, Feicheng, Leiyang, Yuanjiang, Daye, Beijing, Yangchun, Nanjing, Shucheng, Linxia, Yongxin, Chun’an, Xinyang, Shangyu, Baiyin, Ruichang, Xinghua and Yizhou dialects)
Fieldwork dates: April 11 – May 15, 2014
Sample size: 3,190
Margin of error: +/-3.5 percentage points
Representative: Adult population (excluding Tibet, Xinjiang, Hong Kong and Macau, or about 2% of the population). Disproportionately urban. The data were weighted to reflect the actual urbanity distribution in China.
Note: The results cited are from Horizonkey’s self-sponsored survey.
Country: Colombia
Sample design: Multi-stage cluster sample stratified by region and urbanity
Mode: Face-to-face adults 18 plus
Languages: Spanish
Fieldwork dates: April 12 – May 8, 2014
Sample size: 1,002
Margin of error: +/-3.5 percentage points
Representative: Adult population (excluding region formerly called the National Territories and the islands of San Andres and Providencia, or about 4% of the population)
Country: Egypt
Sample design: Multi-stage cluster sample stratified by governorate and urbanity
Mode: Face-to-face adults 18 plus
Languages: Arabic
Fieldwork dates: April 10 – April 29, 2014
Sample size: 1,000
Margin of error: +/-4.3 percentage points
Representative: Adult population (excluding frontier governorates, or about 2% of the population)
Country: El Salvador
Sample design: Multi-stage cluster sample stratified by department and urbanity
Mode: Face-to-face adults 18 plus
Languages: Spanish
Fieldwork dates: April 28 – May 9, 2014
Sample size: 1,010
Margin of error: +/-4.5 percentage points
Representative: Adult population
Country: France
Sample design: Random Digit Dial (RDD) sample of landline and cell phone households with quotas for gender, age and occupation and stratified by region and urbanity
Mode: Telephone adults 18 plus
Languages: French
Fieldwork dates: March 17 – April 1, 2014
Sample size: 1,003
Margin of error: +/-4.1 percentage points
Representative: Telephone households (roughly 99% of all French households)
Country: Germany
Sample design: Random Digit Dial (RL(2)D) probability sample of landline households, stratified by administrative district and community size, and cell phone households
Mode: Telephone adults 18 plus
Languages: German
Fieldwork dates: March 17 – April 2, 2014
Sample size: 1,000
Margin of error: +/-4.0 percentage points
Representative: Telephone households (roughly 99% of all German households)
Country: Ghana
Sample design: Multi-stage cluster sample stratified by region and settlement size
Mode: Face-to-face adults 18 plus
Languages: Akan (Twi), English, Dagbani, Ewe
Fieldwork dates: May 5 – May 31, 2014
Sample size: 1,000
Margin of error: +/-3.8 percentage points
Representative: Adult population
Country: Greece
Sample design: Multi-stage cluster sample stratified by region and urbanity
Mode: Face-to-face adults 18 plus
Languages: Greek
Fieldwork dates: March 22 – April 9, 2014
Sample size: 1,000
Margin of error: +/-3.7 percentage points
Representative: Adult population (excluding the islands in the Aegean and Ionian Seas, or roughly 6% of the population)
Country: India
Sample design: Multi-stage cluster sample stratified by region and urbanity
Mode: Face-to-face adults 18 plus
Languages: Hindi, Bengali, Tamil, Telugu, Marathi, Kannada, Gujarati, Odia
Fieldwork dates: April 14 – May 1, 2014
Sample size: 2,464
Margin of error: +/-3.1 percentage points
Representative: Adult population in 15 of the 17 most populous states (Kerala and Assam were excluded) and the Union Territory of Delhi (roughly 91% of the population). Disproportionately urban. The data were weighted to reflect the actual urbanity distribution in India.
Country: Indonesia
Sample design: Multi-stage cluster sample stratified by province and urbanity
Mode: Face-to-face adults 18 plus
Languages: Bahasa Indonesian
Fieldwork dates: April 17 – May 23, 2014
Sample size: 1,000
Margin of error: +/-4.0 percentage points
Representative: Adult population (excluding Papua and remote areas or provinces with small populations, or 12% of the population)
Country: Israel
Sample design: Multi-stage cluster sample stratified by district, urbanity and socioeconomic status, with an oversample of Arabs
Mode: Face-to-face adults 18 plus
Languages: Hebrew, Arabic
Fieldwork dates: April 24 – May 11, 2014
Sample size: 1,000 (597 Jews, 388 Arabs, 15 others)
Margin of error: +/-4.3 percentage points
Representative: Adult population (The data were weighted to reflect the actual distribution of Jews, Arabs and others in Israel.)
Country: Italy
Sample design: Multi-stage cluster sample stratified by region and urbanity
Mode: Face-to-face adults 18 plus
Languages: Italian
Fieldwork dates: March 18 – April 7, 2014
Sample size: 1,000
Margin of error: +/-4.3 percentage points
Representative: Adult population
Country: Japan
Sample design: Random Digit Dial (RDD) probability sample of landline households stratified by region and population size
Mode: Telephone adults 18 plus
Languages: Japanese
Fieldwork dates: April 10 – April 27, 2014
Sample size: 1,000
Margin of error: +/-3.2 percentage points
Representative: Landline households (roughly 86% of all Japanese households)
Country: Jordan
Sample design: Multi-stage cluster sample stratified by governorate and urbanity
Mode: Face-to-face adults 18 plus
Languages: Arabic
Fieldwork dates: April 11 – April 29, 2014
Sample size: 1,000
Margin of error: +/-4.5 percentage points
Representative: Adult population
Country: Kenya
Sample design: Multi-stage cluster sample stratified by province and settlement size
Mode: Face-to-face adults 18 plus
Languages: Kiswahili, English
Fieldwork dates: April 18 – April 28, 2014
Sample size: 1,015
Margin of error: +/-4.0 percentage points
Representative: Adult population
Country: Lebanon
Sample design: Multi-stage cluster sample stratified by region and urbanity
Mode: Face-to-face adults 18 plus
Languages: Arabic
Fieldwork dates: April 11 – May 2, 2014
Sample size: 1,000
Margin of error: +/-4.1 percentage points
Representative: Adult population (excluding a small area in Beirut controlled by a militia group and a few villages in the south of Lebanon, which border Israel and are inaccessible to outsiders, or about 2% of the population)
Country: Malaysia
Sample design: Multi-stage cluster sample stratified by state and urbanity
Mode: Face-to-face adults 18 plus
Languages: Bahasa Malaysia, Mandarin Chinese, English
Fieldwork dates: April 10 – May 23, 2014
Sample size: 1,010
Margin of error: +/-3.8 percentage points
Representative: Adult population (excluding difficult to access areas in Sabah and Sarawak, or about 7% of the population)
Country: Mexico
Sample design: Multi-stage cluster sample stratified by region and urbanity
Mode: Face-to-face adults 18 plus
Languages: Spanish
Fieldwork dates: April 21 – May 2, 2014
Sample size: 1,000
Margin of error: +/-4.0 percentage points
Representative: Adult population
Country: Nicaragua
Sample design: Multi-stage cluster sample stratified by department and urbanity
Mode: Face-to-face adults 18 plus
Languages: Spanish
Fieldwork dates: April 23 – May 11, 2014
Sample size: 1,008
Margin of error: +/-4.0 percentage points
Representative: Adult population (excluding residents of gated communities and multi-story residential buildings, or less than 1% of the population)
Country: Nigeria
Sample design: Multi-stage cluster sample stratified by region and urbanity
Mode: Face-to-face adults 18 plus
Languages: English, Hausa, Yoruba, Igbo
Fieldwork dates: April 11 – May 25, 2014
Sample size: 1,014
Margin of error: +/-4.3 percentage points
Representative: Adult population (excluding Adamawa, Borno, Cross River, Jigawa, Yobe, and some areas in Taraba, or roughly 12% of the population)
Country: Pakistan
Sample design: Multi-stage cluster sample stratified by province and urbanity
Mode: Face-to-face adults 18 plus
Languages: Urdu, Pashto, Punjabi, Saraiki, Sindhi
Fieldwork dates: April 15 – May 7, 2014
Sample size: 1,203
Margin of error: +/-4.2 percentage points
Representative: Adult population (excluding the Federally Administered Tribal Areas, Gilgit-Baltistan, Azad Jammu and Kashmir for security reasons, areas of instability in Khyber Pakhtunkhwa [formerly the North-West Frontier Province] and Baluchistan, military restricted areas and villages with less than 100 inhabitants – together, roughly 18% of the population). Disproportionately urban. The data were weighted to reflect the actual urbanity distribution in Pakistan.
Country: Palestinian territories
Sample design: Multi-stage cluster sample stratified by region and urban/rural/refugee camp population
Mode: Face-to-face adults 18 plus
Languages: Arabic
Fieldwork dates: April 15 – April 22, 2014
Sample size: 1,000
Margin of error: +/-4.4 percentage points
Representative: Adult population (excluding Bedouins who regularly change residence and some communities near Israeli settlements where military restrictions make access difficult, or roughly 5% of the population)
Country: Peru
Sample design: Multi-stage cluster sample stratified by region and urbanity
Mode: Face-to-face adults 18 plus
Languages: Spanish
Fieldwork dates: April 11 – May 2, 2014
Sample size: 1,000
Margin of error: +/-4.0 percentage points
Representative: Adult population
Country: Philippines
Sample design: Multi-stage cluster sample stratified by region and urbanity
Mode: Face-to-face adults 18 plus
Languages: Tagalog, Cebuano, Ilonggo, Ilocano, Bicolano
Fieldwork dates: May 1 – May 21, 2014
Sample size: 1,008
Margin of error: +/-4.0 percentage points
Representative: Adult population
Country: Poland
Sample design: Multi-stage cluster sample stratified by province and urbanity
Mode: Face-to-face adults 18 plus
Languages: Polish
Fieldwork dates: March 17 – April 8, 2014
Sample size: 1,010
Margin of error: +/-3.6 percentage points
Representative: Adult population
Country: Russia
Sample design: Multi-stage cluster sample stratified by Russia’s eight geographic regions, plus the cities of Moscow and St. Petersburg, and by urban-rural status
Mode: Face-to-face adults 18 plus
Languages: Russian
Fieldwork dates: April 4 – April 20, 2014
Sample size: 1,000
Margin of error: +/-3.6 percentage points
Representative: Adult population (excludes Chechen Republic, Ingush Republic and remote territories in the Far North – together, roughly 3% of the population)
Country: Senegal
Sample design: Multi-stage cluster sample stratified by region and urbanity
Mode: Face-to-face adults 18 plus
Languages: Wolof, French
Fieldwork dates: April 17 – May 2, 2014
Sample size: 1,000
Margin of error: +/-3.7 percentage points
Representative: Adult population
Country: South Africa
Sample design: Multi-stage cluster sample stratified by metropolitan area, province and urbanity
Mode: Face-to-face adults 18 plus
Languages: English, Zulu, Xhosa, South Sotho, Afrikaans, North Sotho
Fieldwork dates: May 18 – June 5, 2014
Sample size: 1,000
Margin of error: +/-3.5 percentage points
Representative: Adult population
Country: South Korea
Sample design: Random Digit Dial (RDD) probability sample of adults who own a cell phone
Mode: Telephone adults 18 plus
Languages: Korean
Fieldwork dates: April 17 – April 30, 2014
Sample size: 1,009
Margin of error: +/-3.2 percentage points
Representative: Adults who own a cell phone (roughly 96% of adults age 18 and older)
Country: Spain
Sample design: Random Digit Dial (RDD) probability sample of landline and cell phone-only households stratified by region
Mode: Telephone adults 18 plus
Languages: Spanish/Castilian
Fieldwork dates: March 17 – March 31, 2014
Sample size: 1,009
Margin of error: +/-3.2 percentage points
Representative: Telephone households (roughly 97% of Spanish households)
Country: Tanzania
Sample design: Multi-stage cluster sample stratified by region and urbanity
Mode: Face-to-face adults 18 plus
Languages: Kiswahili
Fieldwork dates: April 18 – May 7, 2014
Sample size: 1,016
Margin of error: +/-4.0 percentage points
Representative: Adult population (excluding Zanzibar, or about 3% of the population)
Country: Thailand
Sample design: Multi-stage cluster sample stratified by region and urbanity
Mode: Face-to-face adults 18 plus
Languages: Thai
Fieldwork dates: April 23 – May 24, 2014
Sample size: 1,000
Margin of error: +/-3.9 percentage points
Representative: Adult population (excluding the provinces of Narathiwat, Pattani, and Yala, or about 3% of the population)
Country: Tunisia
Sample design: Multi-stage cluster sample stratified by governorate and urbanity
Mode: Face-to-face adults 18 plus
Languages: Tunisian Arabic
Fieldwork dates: April 19 – May 9, 2014
Sample size: 1,000
Margin of error: +/-4.0 percentage points
Representative: Adult population
Country: Turkey
Sample design: Multi-stage cluster sample stratified by region, urbanity and settlement size
Mode: Face-to-face adults 18 plus
Languages: Turkish
Fieldwork dates: April 11 – May 16, 2014
Sample size: 1,001
Margin of error: +/-4.5 percentage points
Representative: Adult population
Country: Uganda
Sample design: Multi-stage cluster sample stratified by region and urbanity
Mode: Face-to-face adults 18 plus
Languages: Luganda, English, Runyankole/Rukiga, Luo, Runyoro/Rutoro, Ateso, Lugbara
Fieldwork dates: April 25 – May 9, 2014
Sample size: 1,007
Margin of error: +/-3.9 percentage points
Representative: Adult population
Country: Ukraine
Sample design: Multi-stage cluster sample stratified by Ukraine’s six regions plus ten of the largest cities – Kyiv (Kiev), Kharkiv, Dnipropetrovsk, Odessa, Donetsk, Zaporizhia, Lviv, Kryvyi Rih, Lugansk, and Mikolayev – as well as three cities on the Crimean peninsula – Simferopol, Sevastopol, and Kerch
Mode: Face-to-face adults 18 plus
Languages: Russian, Ukrainian
Fieldwork dates: April 5 – April 23, 2014
Sample size: 1,659
Margin of error: +/-3.3 percentage points
Representative: Adult population (Survey includes oversamples of Crimea and of the South, East and Southeast regions. The data were weighted to reflect the actual regional distribution in Ukraine.)
Country: United Kingdom
Sample design: Random Digit Dial (RDD) probability sample of landline households, stratified by government office region, and cell phone-only households
Mode: Telephone adults 18 plus
Languages: English
Fieldwork dates: March 17 – April 8, 2014
Sample size: 1,000
Margin of error: +/-3.4 percentage points
Representative: Telephone households (roughly 98% of all households in the United Kingdom)
Country: United States
Sample design: Random Digit Dial (RDD) probability sample of landline and cell phone households
Mode: Telephone adults 18 plus
Languages: English, Spanish
Fieldwork dates: April 22 – May 11, 2014
Sample size: 1,002
Margin of error: +/-3.5 percentage points
Representative: Telephone households with English or Spanish speakers (roughly 96% of U.S. households)
Country: Venezuela
Sample design: Multi-stage cluster sample stratified by region and parish size
Mode: Face-to-face adults 18 plus
Languages: Spanish
Fieldwork dates: April 11 – May 10, 2014
Sample size: 1,000
Margin of error: +/-3.5 percentage points
Representative: Adult population (excluding remote areas, or about 4% of population)
Country: Vietnam
Sample design: Multi-stage cluster sample stratified by region and urbanity
Mode: Face-to-face adults 18 plus
Languages: Vietnamese
Fieldwork dates: April 16 – May 8, 2014
Sample size: 1,000
Margin of error: +/-4.5 percentage points
Representative: Adult population

Appendix

Economic categorization:

For this report we grouped countries into three economic categories: “advanced,” “emerging” and “developing.” These categories are fairly common in specialized and popular discussions and are helpful for analyzing how public attitudes vary with economic circumstances. However, no single, agreed upon scheme exists for placing countries into these three categories. For example, even the World Bank and International Monetary Fund do not always agree on how to categorize economies.

In creating our economic classification of the 44 countries in our survey, we relied on multiple sources and criteria. Specifically, we were guided by: World Bank income classifications; classifications of emerging markets by other multi-national organizations, such as the International Monetary Fund; per capita Gross Domestic Product (GDP); total size of the country’s economy, as measured by GDP; and average GDP growth rate over the past 10 years.

Below is a table that outlines the countries that fall into each of the three categories. The table includes for each country the World Bank income classification, the GDP per capita based on purchasing power parity (PPP), the GDP in current prices and average GDP growth rate over the past 10 years.

Appendix: Economic Categorization