A Rising Share of the U.S. Black Population Is Foreign Born
9 Percent Are Immigrants; and While Most Are from the Caribbean, Africans Drive Recent Growth
BYMonica Anderson
About Pew Research Center
Pew Research Center is a nonpartisan, nonadvocacy fact tank that informs the public about the issues, attitudes and trends shaping the world. It does not take policy positions. The Center conducts public opinion polling, demographic research, computational social science research and other data-driven research. It studies politics and policy; news habits and media; the internet and technology; religion; race and ethnicity; international affairs; social, demographic and economic trends; science; research methodology and data science; and immigration and migration. Pew Research Center is a subsidiary of The Pew Charitable Trusts, its primary funder.
A Rising Share of the U.S. Black Population Is Foreign Born
9 Percent Are Immigrants; and While Most Are from the Caribbean, Africans Drive Recent Growth
Overview
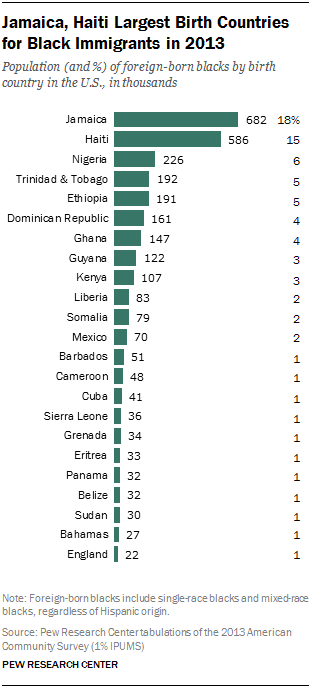
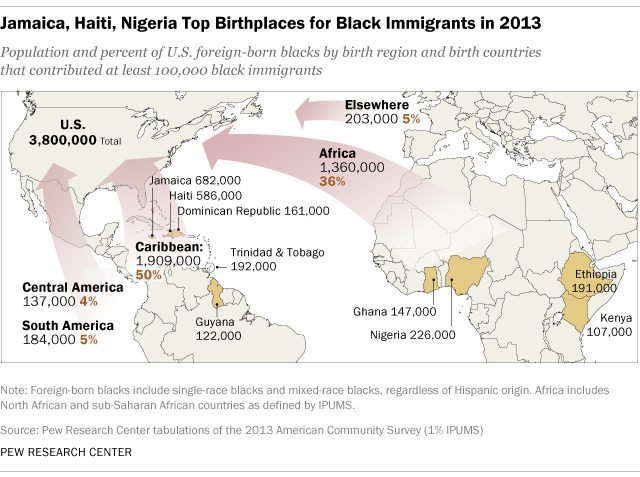
Black immigrants are from many parts of the world, but half are from the Caribbean alone.1 Jamaica is the largest source country with about 682,000 black immigrants born there, accounting for 18% of the national total. Haiti follows with 586,000 black immigrants, making up 15% of the U.S. black immigrant population.
Many black immigrants are from Spanish-speaking countries. Among these, the Dominican Republic is the largest country of birth, accounting for 161,000 black immigrants. Mexico is also a source of black immigration with roughly 70,000 black immigrants. Some 41,000 are from Cuba, and 32,000 are Panamanian. Moreover, 11% of the foreign-born black population identifies as Hispanic.
The History of Black Migration to the U.S.
The United States has long had a significant black population.2 In the nation’s earliest censuses (at the end of the 18th century), blacks accounted for nearly one-fifth of the U.S. population, with nearly all brought to the U.S. as slaves from Africa. Today, most of the nation’s 40 million U.S.-born blacks trace their roots to this population.
However, due to the outlawing of the slave trade in 1808 as well as restrictions on non-European immigration, the flow of blacks arriving in the U.S. dropped to a trickle for more than a century and a half. Among the black immigrants who voluntarily migrated during this time, most were from the Caribbean.
The modern wave of black immigration to the U.S. began when U.S. immigration policy changed in the 1960s, becoming more open to a wider variety of migrants. Just like other immigrants, foreign-born blacks benefited from the Immigration and Nationality Act of 1965 that emphasized family reunification and skilled immigrant labor.3 In addition, the Refugee Act of 1980 loosened immigration restrictions by allowing more immigrants from conflict areas such as Ethiopia and Somalia to seek asylum in the U.S.4 Finally, the U.S. Immigration Act of 1990 sought to increase the number of immigrants from underrepresented nations, and although the act was initially intended to increase the flow of European immigrants, Africans have benefited from the program, as well.5
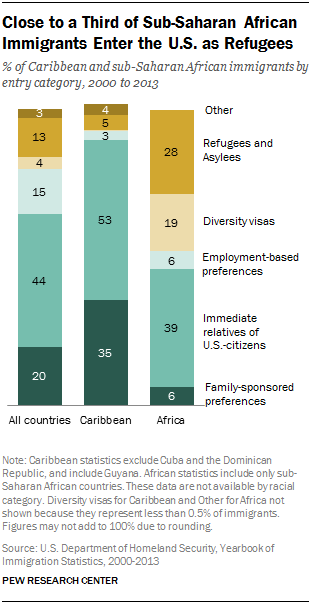
This act, also known as the diversity visa program, has been an important way for African immigrants to gain entry into the U.S. About one-in-five sub-Saharan African immigrants (19%) who gained legal permanent residence between 2000 and 2013 entered through this program.
During the same period, about three-in-ten (28%) sub-Saharan African immigrants arrived in the U.S. as refugees or asylees. That share was only 5% for Caribbean immigrants and 13% for the overall immigrant population. Caribbean immigrants are much more likely to enter the U.S. through family-sponsored
Caribbean and sub-Saharan African immigrants are less likely to have been granted admittance via employment-based visa programs than immigrants overall.6
A Statistical Portrait of Black Immigrants
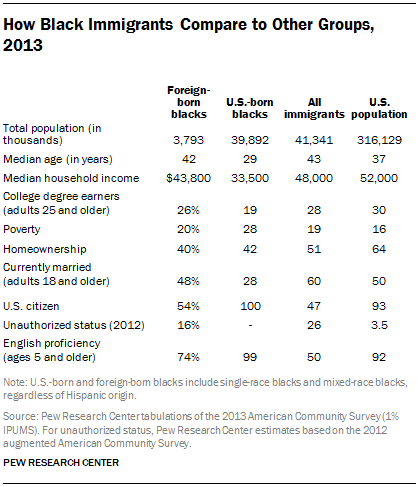
Compared with the U.S. population overall, black immigrants have a slightly higher median age (42 years versus 37 years) and among those that are ages 25 and up, are slightly less likely to have a college degree (26% versus 30%). In addition, black immigrants are less likely than all Americans to own their homes (40% versus 64%), and overall they have lower household incomes.
These findings are based on a Pew Research Center analysis of data from the 2013 American Community Survey in addition to analyses of the 1980, 1990 and 2000 U.S. decennial censuses. The report explores the characteristics of the nation’s black immigrant population in 2013 and how it has changed since 2000. It also compares the characteristics of black immigrants with those of U.S.-born blacks, all U.S. immigrants and the U.S. population.
CORRECTION (Jan. 17, 2018): In the report text, the total number of black immigrants from the Dominican Republic was changed to 161,000 (it incorrectly said 166,000).
About This Report
This report explores the demographic, economic and geographic characteristics, as well as population trends, of the black foreign-born population in the United States. Black immigrants are defined as those current U.S. residents born outside the U.S. who indicate that their race is black or is mixed-race black, regardless of Hispanic origin. The report also compares the characteristics of black immigrants to U.S.-born blacks, foreign-born U.S. residents and the general U.S. population. Immigrant population estimates include all immigrants regardless of citizenship or legal status.
The data for this report are from four main sources. The first is the U.S. Census Bureau’s 2013 American Community Survey, which provides the most recent detailed geographic, demographic and economic characteristics for foreign-born blacks, U.S.-born blacks, foreign-born U.S. residents and the general U.S. population. The other data sources are the 1980, 1990 and 2000 decennial censuses (5% IPUMS).
The report was written by Monica Anderson, research analyst. Editorial guidance was provided by Mark Hugo Lopez, director of Hispanic research; Kim Parker, director of social trends research; D’Vera Cohn, senior writer; Claudia Deane, vice president of research; and Juliana Menasce Horowitz, associate director for research. Eileen Patten, research analyst; Ana Gonzalez-Barrera, research associate; and Anna Brown, research assistant, provided research assistance. Anna Brown number checked the report. Marcia Kramer was the copy editor. Related reports are online at www.pewresearch.org/pewresearch-org/hispanic and at www.pewresearch.org/pewresearch-org/social-trends.
A Note on Terminology
The terms “black immigrants” and “foreign-born blacks” are used interchangeably throughout the report and refer to persons who were both born outside the United States, Puerto Rico or other U.S. territories and whose race is black or is mixed-race black, regardless of Hispanic origin, in 2000 and later U.S. Census Bureau surveys. For previous census years (1980 and 1990), “black immigrants” or “foreign-born blacks” refer to persons born outside the U.S., Puerto Rico or other U.S. territories whose race is black, regardless of Hispanic origin. Prior to 2000, respondents to Census Bureau surveys and its decennial census could make only one selection in the race question. In 2000 and later, respondents were able to indicate they were of more than once race. Immigrant population estimates include all immigrants regardless of citizenship or legal status.
“U.S. born” refers to those who are U.S. citizens at birth, namely people born in the U.S., Puerto Rico or other U.S. territories and those born abroad to at least one parent who was a U.S. citizen.
“Foreign born” refers to people born outside the U.S., Puerto Rico or other U.S. territories to parents neither of whom was a U.S. citizen.
The terms “foreign born” and “immigrant” are used interchangeably.
Chapter 1: Statistical Portrait of the U.S. Black Immigrant Population
Black immigrants are a diverse group with notable differences in demographic, economic and geographic characteristics, often tied to the regions of their birth countries. Black immigrants are also notably different from other Americans. For example, immigrant blacks are more likely than U.S.-born blacks to have a college degree or to be married. Compared with all U.S. immigrants, immigrant blacks are more likely to hold U.S. citizenship and to speak English proficiently.
Year of Immigration
Close to half (45%) of black immigrants arrived in the U.S. in 2000 or later, with 24% saying they arrived sometime in 2006 or later, according to the Pew Research Center analysis of the 2013 American Community Survey. About a third (31%) say they began living in the U.S. prior to 1990 and 24% arrived in the 1990s.
However, year of arrival varies among black immigrants by region of birth. For example, 63% of black African immigrants are recent arrivals, having arrived in the U.S. in 2000 or later. More than one-third (36%) arrived the most recently—in 2006 or later. These are the largest recent arrival shares of any major black immigrant subgroup.
By contrast, black immigrants from the Caribbean generally have lived in the U.S. longer. Some 42% arrived in the U.S. before 1990, while just 18% arrived in 2006 or later. Black immigrants from Jamaica, Haiti and the Dominican Republic increasingly began moving to the U.S. in the 1960s.9
Among black immigrants from Central America, half arrived before 1990, the largest share of any regional group. For example, nearly half (47%) of all black Central American immigrants are Panamanian or Belizean. Panama, in particular, saw large waves in the 1980s due to the Panama Canal Act, which granted admission to Panamanians who worked on the canal, while others fled because of the Manuel Noriega regime.10
Compared with other U.S. immigrants, black immigrants are a more recently arrived immigrant population. Fully 45% of black immigrants say they first arrived in the U.S. in 2000 or later, while 39% of the overall immigrant population did so. Black immigrants are somewhat more likely to say they arrived in 2000 or later than Hispanic and Asian immigrants whose shares are 38% and 42%, respectively.11
Citizenship Status
A majority of black immigrants—54%—hold U.S. citizenship, a higher share than among all U.S. immigrants (47%). Among black immigrants, citizenship rates are highest among black immigrants from South America and the Caribbean—62% and 59%, respectively. By contrast, less than half (47%) of the black African immigrant population are U.S. citizens. One possible reason for lower citizenship rates among black immigrants from Africa is that they generally have arrived more recently than other black immigrants.
According to Pew Research Center estimates, about 575,000 black immigrants are living in the U.S. without authorization, making up 16% of all black immigrants. Among black immigrants from the Caribbean 16% are unauthorized immigrants as are 13% of black immigrants from Africa. By comparison, among the nation’s 42.5 million immigrants, more than 11 million are unauthorized immigrants,12 accounting for about one-quarter of the total immigrant population, a higher share than that among black immigrants.
English-language Ability
A greater share of foreign-born blacks is proficient in English than the overall U.S. immigrant population, according to the Pew Research analysis of the 2013 American Community Survey. Nearly three-quarters (74%) of black immigrants, ages 5 and over, are proficient English speakers. Some 43% speak only English at home, while an additional 31% say they speak a language other than English at home but report that they speak English “very well.”
By contrast, among all immigrants ages 5 and up, 50% say they either speak only English at home (16%) or speak a language other than English at home but also speak English “very well” (34%). And among the two largest groups of immigrants, the shares that are English proficient are lower than among blacks. Some 55% of Asian immigrants 5 and older say they speak only English at home (13%) or speak English “very well” (42%). And about one-third (34%) of Hispanic immigrants 5 and older say only English is spoken in their home (5%) or indicate they speak English “very well” but speak Spanish at home (29%).
Given that half of black immigrants are from the Caribbean, where English is widely spoken, English-language proficiency rates are high among those from the region. Black immigrants ages 5 and older from the Caribbean (76%) and South America (82%) are the most likely to be English-language proficient, compared with 72% of Africans and 60% of black immigrants from Central America.
Among black immigrants ages 5 and older, other languages spoken include French/Haitian Creole (14%), Spanish (11%), Kru (7%) and French (6%).13
Age
The U.S. black immigrant population is overwhelmingly made up of adults, reflecting the adult age of migration for most immigrants. About nine-in-ten (93%) black immigrants are 18 or older. Foreign-born blacks are also older than Americans overall. Their median age is 42 years, compared with 37 for the overall U.S. population. But the median age of black immigrants is similar to that for all U.S. immigrants (43 years).
There is an even larger age discrepancy between U.S.-born blacks and foreign-born blacks. The median age among U.S.-born blacks is 29 years, a full 13 years younger than what it is among blacks who are foreign born.
Median age also varies some among black immigrants. For example, the median age for black immigrants from the Caribbean is 47 years, similar to that of black immigrants from Central America (46 years) and those from South America (45 years). With a median age of 37 years, Africans are the youngest black immigrant population.
Marital Status
Nearly half (48%) of black immigrants ages 18 and older are married. This is comparable to the share for all U.S. adults (50%) but is below that for all U.S. immigrants (60%).
Compared to U.S.-born black adults, a significantly higher share of black immigrant adults are currently married (28% among U.S. born versus 48% among foreign born). Looked at another way, just one-third (31%) of black immigrants adults have never been married, while half (49%) of U.S.-born blacks have never been married.
There are only small differences in marriage rates within the foreign-born black adult population. Overall, 52% of African black immigrant adults are married which is the highest share among black immigrant origin groups.
Household Type
Fully 83% of black immigrants live in a family household.14 This group is made up of 50% who live in married couple households, 24% in female-headed households and 10% in male-headed family household.15
By comparison, a greater share (60%) of all Americans live in married couple households. Among U.S. immigrants, an even greater share (64%) lives in a married couple household.
However, the Pew Research analysis shows that U.S.-born blacks are less likely to live in a married couple household—just 36% do so—than black immigrants. They are also more likely than foreign-born blacks to live in a female-headed household (41% versus 24%).
Among foreign-born blacks, 53% of Africans and 53% of South Americans live in married couple households. Among Central American black immigrants, that share is 49%, while it is 46% of black immigrants from the Caribbean.
Educational Attainment
About a quarter (26%) of black immigrants ages 25 and older have a bachelor’s degree or higher. This share is below that of the overall U.S. population, in which 30% of U.S. adults 25 and older have at least a bachelor’s degree. However, the share with an advanced degree, such as a master’s degree, Ph.D. or a professional degree, is similar among all Americans (11%) and black immigrants (10%).
Black immigrants hold degrees at a similar rate as the U.S. foreign-born population—26% of the foreign-born black population ages 25 and older has at least a bachelor’s degree, comparable to 28% of all U.S. immigrants. But there are striking differences when comparing black immigrants with Asian immigrants and with Hispanic immigrants. Among those 25 and older, 50% of all Asian immigrants have completed at least a four-year degree; but only 11% of Hispanic immigrants have done so.
By comparison, U.S.-born blacks ages 25 and older are less likely to have at least a bachelor’s degree than black immigrants—19% compared with 26%.
Educational attainment varies greatly among black immigrants by birth region. Some 35% of black African immigrants ages 25 and older have at least a bachelor’s degree, including 15% who have an advanced degree. These shares are higher than any other major black immigrant subgroup. Black South American immigrants have the second highest share (25%) of college degree holders, followed by those from the Caribbean (20%). Some 17% of black Central Americans immigrants have a college degree.
Household Income
Although black immigrants have similar levels of educational attainment as Americans overall, their household incomes are lower than the median U.S. household. The median annual household income for foreign-born blacks in 2013 was $43,800. That’s roughly $8,000 less than the $52,000 median for American households.
Black immigrants’ median annual household income is below that of all U.S. immigrants ($43,800 vs. $48,000). Among immigrants, there are differences. While the median household income for black immigrants is higher than it is for Hispanic immigrants ($43,800 vs. $38,000), both groups have median household incomes substantially below that of Asian immigrants, whose median household income is $70,600.
But foreign-born blacks have a higher median income than U.S.-born blacks. U.S.-born blacks have a median household income of $33,500, a full $10,000 less than that among foreign-born black households.
Among black immigrants, the group with the highest median annual household income is South Americans, at $55,000. For African and Caribbean immigrants, both groups have a median household income of $43,000, while Central Americans have a median household income of $41,400.
Homeownership
Black immigrants are less likely to be homeowners than Americans overall—40% of household heads versus 64%. And when compared with all U.S. immigrants, foreign-born blacks are less likely to own their homes—51% and 40%, respectively. Among U.S. immigrant subgroups, fully 57% of Asian immigrants are homeowners, compared with 43% of Hispanic immigrants. Both homeownership rates are higher than that for black immigrants.
Just as with other immigrants, homeownership rates vary across black immigrant subgroups. For example, 46% of black immigrants from the Caribbean and South America are homeowners, while 37% of black Central Americans are homeowners. Some 31% of black African immigrants owned their own home in 2013. But across all black immigrant subgroups, homeownership rates are below those of all Americans.
Homeownership rates vary little between U.S.-born and foreign-born blacks. Some 42% of U.S.-born blacks are homeowners compared with 40% of black immigrants.
Poverty Status
One-in-five (20%) black immigrants live below the poverty line, according to the Pew Research Center analysis of Census Bureau data. That share is below that of U.S.-born blacks, who have a poverty rate of 28%. But the poverty rate among black immigrants is higher than it is among all Americans (16%).
Among all U.S. immigrants, at 19%, the share living in poverty is similar to that for black immigrants. Overall, the poverty rate among black immigrants falls between that of Asian immigrants, at 13%, and Hispanic immigrants, at 24%.
Among black immigrants, poverty rates vary some. Some 22% of those from Africa live in poverty, as do 19% of those from Central America, 18% of those from the Caribbean and 14% of those from South America.
Geographic Dispersion of Black Immigrants
The nation’s black immigrant population is highly concentrated. More than eight-in-ten (82%) of them live in just two regions—41% live in the Northeast and 41% live in the South. Meanwhile, the Midwest and West are home to just 9% each of the black immigrant population.
Black immigrants from the Caribbean are more concentrated in the Northeast and the South—95% live there—than the overall black immigrant population.
By contrast, the black African immigrant population is more dispersed, with 40% in the South, 25% in the Northeast, 19% in the Midwest and 16% in the West. Among black immigrants from South America, 64% reside in the Northeast. And among Central American black immigrants, 47% live in the Northeast and 19% live in the West, the highest share living there among major black immigrant groups.
Looking at the top states of residence for the nation’s black immigrants, one-in-four (24%), or 910,000, live in New York state alone. Florida has the second-largest foreign-born black population with 661,000, followed by New Jersey, Maryland and Massachusetts.
Among metropolitan areas, the New York-Newark-Jersey City metropolitan area has by far the largest black immigrant population, containing 27% of the foreign-born black population overall. The Miami-Fort Lauderdale-West Palm Beach metro area in Florida is the second largest with 12%, followed by Washington, D.C.-Arlington-Alexandria, Virginia at 6%. The Boston and Atlanta areas each account for 4% of the total black immigrant population.
Some black immigrant country of origin communities are clustered around particular metropolitan areas. For example, the New York metro area is home to roughly 250,000 black Jamaican immigrants, or nearly 40% of all foreign-born black Jamaicans in the U.S. And the Miami metropolitan area has the nation’s largest black Haitian immigrant community—more than 211,000 black Haitian immigrants, equal to 36% of its population in the U.S.
The Washington, D.C., metro area is home to the biggest black Ethiopian immigrant community in the country with 46,000 black Ethiopian immigrants living there, equivalent to 24% of that group’s U.S. population, while 25,000, or 31%, of the black Somalian immigrant population lives in the Minneapolis-St. Paul-Bloomington metro area of Minnesota and Wisconsin.
In the nation’s 10 metropolitan areas with the largest black populations, the share of these populations that are foreign born varies widely. In only three are black immigrants a double-digit share of the overall black population. About one-in-three (34%) blacks living in the Miami-Fort Lauderdale-West Palm Beach metro area in Florida are immigrants. In the New York-Newark-Jersey City metro area, foreign-born blacks make up 28% of the black population. And in the Washington, D.C., metropolitan area, 15% of the area’s blacks are foreign born. In the other seven largest black metropolitan areas, black immigrants make up a much smaller proportion of the overall black population. For example, 8% of black residents in the Atlanta metro area are foreign born. Black immigrants’ share of the overall Chicago black population is just 4%, and only 1% of blacks living in Detroit are foreign born.
Chapter 2: Changes in the Black Immigration Population Since 2000
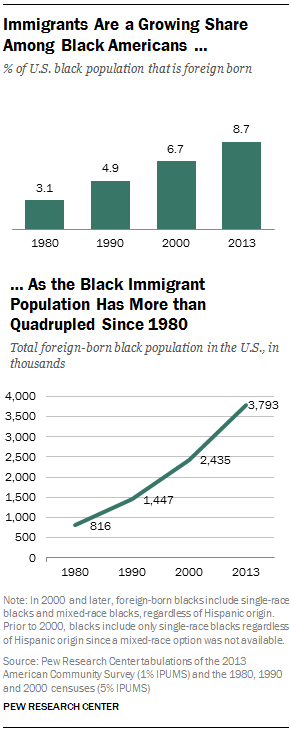
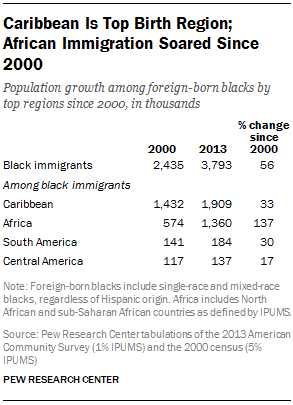
Since 2000, the foreign-born black population has grown from 2.4 million to 3.8 million, an increase of 56%. Among this population, the number of black African immigrants grew most—by 137% between 2000 and 2013. By comparison, the black Caribbean immigrant population rose by a third during this period, while the number of black South American and black Central American immigrants increased by 30% and 17%, respectively.
Moreover, the share of black immigrants from Africa now stands at 36%, up from 24% in 2000; by comparison, the percentage of black immigrants from the Caribbean dropped from 59% to 50%.
Besides population size, some characteristics of the black immigrant population have changed since 2000.
Citizenship rates for foreign-born blacks have increased by 10 percentage points since 2000, rising from 44% with citizenship to 54% over the period. The share of black African immigrants who are U.S. citizens rose dramatically; in 2000, only 29% were U.S. citizens, by 2013, that figure had risen to 47%. The lower shares of black African immigrants who were U.S. citizens in 2000 may be due to the fact that legal permanent residents are generally required to wait five years before taking the U.S. citizenship test. And in the late 2000’s, the share of African immigrants who were legal permanent residents was estimated at 26%.16 Among other black immigrants, citizenship rates rose 10 percentage points for those from the Caribbean and seven points for South Americans, while it dropped two points among Central Americans.
Foreign-born blacks also are a somewhat older population today than in 2000 when the median age was 37; today it is 42. Among the foreign-born black population, South Americans and those from the Caribbean had the biggest changes in median ages; their population aged six and eight years, respectively. The populations of black African immigrants and black Central American immigrants are only slightly older than their counterparts in 2000.
The share of black immigrants ages 5 and older who were proficient English-language speakers was 74% in 2013; in 2000, that share was 77%. Also, in 2000, nearly half (49%) of black immigrants 5 and older lived in English-only households; that share dropped to 43% in 2013. The major black immigrant group with the largest drop was South Americans; 75% of those ages 5 and older lived in English-only homes in 2000, compared with 66% in 2013.
Compared with 2000, black immigrants ages 25 and older today are more likely to have a bachelor’s or advanced degree; the share has grown from 21% then to 26% in 2013. The share with a bachelor’s degree or more grew 5 percentage points for black immigrants from South America, from 20% in 2000 to 25% in 2013. The share of black Caribbean immigrants with a college degree also increased over the period, from 16% to 20%. Black African immigrants were the only group whose educational attainment declined, falling slightly from 38% to 35%, in the share with a college degree during this time.
The median annual household income for black immigrants in 2000 was $49,320 (in constant 2013 dollars) compared to $43,800 today. This overall decline is on a par with the U.S. population overall.
But there were some areas with little change. Half of foreign-born black adults in 2000 were married; today that share is only 2 percentage points lower, 48%. Additionally, the percentage of foreign-born blacks who are homeowners (42%) is about the same as it was in 2000. The share of black immigrants living below the poverty line has risen slightly since 2000, from 18% in 2000 to 20% in 2013. These changes varied little by region of birth.
Appendix A: Additional Tables
Appendix B: Methodology
Data Sources
The data in this report mainly come from the U.S. Census Bureau’s 2013 American Community Survey (ACS). The survey collects detailed information on a broad range of topics, including race, country of birth, year of immigration and citizenship. The ACS has a continuous collection design with monthly samples of about 250,000; the nominal sample size in 2013 was about 3.6 million households, with about 2.2 million included in the final sample. (http://www.census.gov/acs/www/methodology/sample_size_data/index.php). U.S. Census Bureau data for 1980, 1990 and 2000 were used to analyze trend data. These sources were accessed via the Integrated Public Use Microdata Series (IPUMS).
Additional analysis of the unauthorized immigrant population was derived from Pew Research Center estimates of augmented American Community Survey data (2009-2012). For more on unauthorized immigration population estimates and methods, see “As Growth Stalls, Unauthorized Immigrant Population Becomes More Settled,” by Jeffrey S. Passel, D’Vera Cohn, Jens Manuel Krogstad and Ana Gonzalez-Barrera (2014).
Identifying Black Immigrants
Analyzing U.S. census data to calculate the number of black immigrants is subject to how individuals self-identify as well as how definitions of racial categories vary throughout the world. For the purposes of this report, “black immigrants” include anyone who responded “black” in either a single category or a combination of race categories, regardless of Hispanic origin, in 2000 or later. The 1980 and 1990 Census did not allow for respondents to choose multiple race answers, so in those years, numbers refer to black-only (single-race) respondents.
The report also includes comparisons to Asians and Hispanic immigrants; these groups also contain people who identify as black.
Immigrant population estimates include all immigrants regardless of citizenship or legal status.
Region Definitions
Following IPUMS characterization of birth places, Pew Research determined four distinct regions of birth for black immigrants: Africa, the Caribbean, Central America and South America. The countries in each of these regions are shown below.
Africa: North Africa (Algeria, Egypt, Libya, Morocco, Sudan) and sub-Saharan African nations (Cameroon, Cape Verde, Congo, Ethiopia, Eritrea, Gambia, Ghana, Guinea, Kenya, Liberia, Nigeria, Senegal, Sierra Leone, Somalia, South Africa, Tanzania, Togo, Uganda, Zaire, Zambia, Zimbabwe). While the U.S. Census generally records country of birth, in some instances when a country’s sample size is not large enough, nations within the same region are folded into non-specific country variables. For Africa, those included: other Africa, other Western Africa, and other Eastern Africa.
Caribbean: Antigua and Barbuda, Bahamas, Barbados, Cuba, Dominica, Dominican Republic, Grenada, Haiti, Jamaica, St. Kitts, St. Lucia, St. Vincent and The Grenadines, Trinidad and Tobago, other West Indies, and other Caribbean.
Central America: Belize, Costa Rica, El Salvador, Guatemala, Honduras, Nicaragua, Panama.
South America: Argentina, Bolivia, Brazil, Chile, Colombia, Ecuador, Guyana, Paraguay, Peru, Uruguay, Venezuela.
(Few black immigrants are from South and East Asia, Europe or the Middle East.)