Pew Research Center

FOR RELEASE MAY 23, 2024

Electric Vehicle Charging Infrastructure in the U.S.

64% of Americans live within 2 miles of a public charging station, and those who live closest to chargers view EVs more positively

BY Samuel Bestvater and Sono Shah

FOR MEDIA OR OTHER INQUIRIES:

Communications Department
202.419.4372
www.pewresearch.org

RECOMMENDED CITATION

Pew Research Center, May 2024, "Electric Vehicle Charging Infrastructure in the U.S."

About Pew Research Center

Pew Research Center is a nonpartisan, nonadvocacy fact tank that informs the public about the issues, attitudes and trends shaping the world. It does not take policy positions. The Center conducts public opinion polling, demographic research, computational social science research and other data-driven research. It studies politics and policy; news habits and media; the internet and technology; religion; race and ethnicity; international affairs; social, demographic and economic trends; science; research methodology and data science; and immigration and migration. Pew Research Center is a subsidiary of The Pew Charitable Trusts, its primary funder.

© Pew Research Center 2026

Table of contents

  • About Pew Research Center
  • Electric Vehicle Charging Infrastructure in the U.S.
  • Acknowledgments
  • Appendix A: Regression analyses
  • Appendix B: Vehicle-to-charger ratios for each state
  • Methodology

Electric Vehicle Charging Infrastructure in the U.S.

64% of Americans live within 2 miles of a public charging station, and those who live closest to chargers view EVs more positively

How we did this

Pew Research Center conducted this study to understand Americans’ views on electric vehicles. We surveyed 10,329 U.S. adults from May 30 to June 4, 2023.

Everyone who took part in the survey is a member of the Center’s American Trends Panel (ATP), an online survey panel that is recruited through national, random sampling of residential addresses. This way, nearly all U.S. adults have a chance of selection. The survey is weighted to be representative of the U.S. adult population by gender, race, ethnicity, partisan affiliation, education and other categories. Read more about the ATP’s methodology.

We supplemented the data from the survey with data on EVs and charging stations from the U.S. Energy Department, specifically the Office of Energy Efficiency & Renewable Energy and its Alternative Fuels Data Center. This dataset is updated frequently; we accessed it for this study on Feb. 27, 2024.

The analysis in this report relies on two different measures of community type, one based on what ATP panelists self-reported when asked “How would you describe the community where you currently live?” This measure is used when discussing differences in public opinion towards EV charging infrastructure or related issues and distinguishes between urban, suburban and rural areas. The other measure is based on the U.S. Census Bureau’s urban-rural classification, which identifies urban and rural areas based on minimum housing unit density and/or population density thresholds.

Here are the questions used for this analysis, along with responses, and the survey methodology.

Several recent laws, including the 2021 Infrastructure Investment and Jobs Act and the 2022 Inflation Reduction Act, have sought to encourage the development of electric vehicle infrastructure and increase the adoption of electric vehicles (EVs). And a Pew Research Center survey paired with an analysis of U.S. Department of Energy data finds that roughly six-in-ten Americans now live within 2 miles of a public charger. There were over 61,000 publicly accessible electric vehicle charging stations in the United States as of February 2024.  

A chart showing that About 6 in 10 Americans live within 2 miles of a public EV charger

The vast majority of EV charging occurs at home, but access to public infrastructure is tightly linked with Americans’ opinions of electric vehicles themselves. Our analysis finds that Americans who live close to public chargers view EVs more positively than those who are farther away.

Even when accounting for factors like partisan identification and community type, Americans who live close to EV chargers are more likely to say they:

  • Already own an electric or hybrid vehicle
  • Would consider buying an EV for their next vehicle
  • Favor phasing out production of new gasoline cars and trucks by 2035
  • Are confident that the U.S. will build the necessary infrastructure to support large numbers of EVs on the roads

Here are some other key takeaways from our geographic analysis of EV chargers:

The number of EV charging stations has more than doubled since 2020. In December 2020, the Department of Energy reported that there were nearly 29,000 public charging stations nationwide. By February 2024, that number had increased to more than 61,000 stations. Over 95% of the American public now lives in a county that has at least one public EV charging station.

EV charging stations are most accessible to residents of urban areas: 60% of urban residents live less than a mile from the nearest public EV charger, compared with 41% of those in the suburbs and just 17% of rural Americans.

Related:

  • How Americans view electric vehicles
  • Today’s electric vehicle market: Slow growth in U.S., faster in China, Europe

Distribution of EV charging stations in the U.S.

As of Feb. 27, 2024, there are more than 61,000 publicly accessible electric vehicle charging stations with Level 2 or DC Fast chargers in the U.S.1 That is a more than twofold increase from roughly 29,000 stations in 2020. For reference, there are an estimated 145,000 gasoline fueling stations in the country.

EV charging stations can be found in two-thirds of all U.S. counties, which collectively include 95% of the country’s population.

A map showing that Electric vehicle charging stations exist across the country, but most are concentrated in and around urban areas

Distribution by state

As has been the case in the past, California has the most EV charging infrastructure of any state. The state is home to a quarter of all public EV charging stations in the U.S., though this represents a slight decrease from the last time we analyzed this data source in May 2021. At that time, California contained 31% of all public EV charging stations in the U.S.

Californians with an EV might also have a harder time than residents of many states when it comes to the actual experience of finding and using a charger. Despite having the most charging stations of any state, California’s 43,780 individual public charging ports must provide service for the more than 1.2 million electric vehicles registered to its residents. That works out to one public port for every 29 EVs, a ratio that ranks California 49th across all 50 states and the District of Columbia.

At the other end of the spectrum, Wyoming (one-to-six), North Dakota (one-to-six) and West Virginia (one-to-eight) have the most ports relative to the much smaller number of EVs registered in their respective states.

Infrastructure growth in rural areas

Historically, rural parts of the country have had substantially less access to EV charging stations. Addressing that issue has been a focus of recent legislation passed into law. For instance, the 2022 Inflation Reduction Act (IRA) contains tax credits designed to incentivize the installation of EV charging stations outside urban areas.

Since the IRA’s tax credits became active, the number of EV charging stations nationwide has increased 29%. But rural parts of the U.S. have a slightly faster growth rate in their total number of charging stations when compared with urban areas (34% vs. 29%).2 Even so, access to public EV charging remains heavily concentrated in urban areas, which account for nearly 90% of all stations in the U.S. as of Feb. 27, 2024.

Who lives closest to EV charging stations?

The vast majority of Americans now live in a county with at least one public EV charging station, but some live closer to this infrastructure than others: 39% of Americans live within a mile of a public charging station, and 64% have a charging station within 2 miles of home.
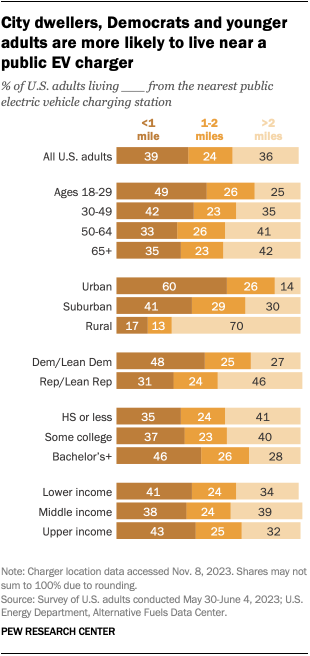
A bar chart showing that City dwellers, Democrats and younger adults are more likely to live near a public EV charger

Americans who live in cities are especially likely to have a public charging station very close to their home. Six-in-ten urban residents live within a mile of a public charger, compared with 41% of suburbanites and just 17% of rural Americans.

Because of this distribution, those who live closest to EV charging infrastructure tend to share the demographic characteristics of urban residents more broadly. For instance, they tend to be relatively young and are more likely to have a college degree than those in other community types.

Looking at political affiliation, 48% of Democrats and Democratic-leaning independents live within a mile of a public charger, compared with 31% of Republicans and Republican leaners.

However, there are no substantial differences in distance to the nearest charger by income. Similar shares of Americans with lower, middle and upper incomes live within a mile of public charging stations.

Attitudes toward EVs vary based on proximity to chargers

On the whole, the American public is fairly skeptical that the U.S. will be able to build the infrastructure necessary to support large numbers of EVs on the roads.
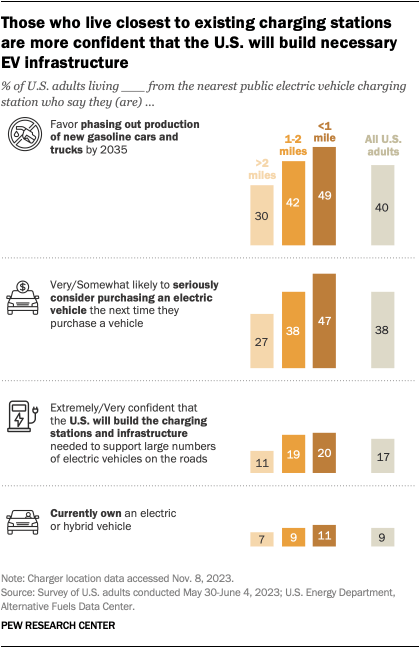
A chart showing that Those who live closest to existing charging stations are more confident that the U.S. will build necessary EV infrastructure

Just 17% of U.S. adults say they are extremely or very confident in the country’s ability to develop this infrastructure. But 20% of those who live within a mile of a public charger say they’re extremely or very confident that the U.S. will build the infrastructure necessary to support EVs, almost twice the share (11%) among those who live more than 2 miles from a charging station.

Likewise, those who live closer to public chargers are more likely to favor phasing out production of new gasoline cars and trucks by 2035. This view is held by 49% of those who live within a mile of a public charger, but just 30% of those who live more than 2 miles from one.

Owning – or considering – an electric vehicle

Americans who live near a public charger are a bit more likely to say they currently own an electric vehicle or hybrid. As of June 2023, 11% of those who live within a mile of a public charger said they owned an EV or hybrid; that figure is 7% for those who live more than 2 miles from a charging station.

Those who live close to public charging infrastructure are also much more likely to consider purchasing an EV in the future. Around half of those within a mile of a public charger say they are very or somewhat likely to consider purchasing an EV, compared with just 27% of those for whom the nearest charger is more than 2 miles away.

A dot plot showing that Those who live closest to charging infrastructure are more likely to consider purchasing an EV

These trends persist if we look at urban, suburban and rural areas separately.3 For instance, just 17% of rural Americans live within a mile of an EV charger, but those who do live close to one are substantially more likely to consider buying an EV in the future (33%) when compared with those who live more than 2 miles from the nearest charging station (21%).

Likewise, Democrats are much more likely than Republicans to say they’d consider buying an EV, but members of both parties are more willing to consider an EV when they live near charging infrastructure.

Just 15% of Republicans who live more than 2 miles from a charger say they are very or somewhat likely to consider an EV for their next vehicle purchase. But among Republicans who live within a mile of a charger, that share is 26%. And although 60% of Democrats living in close proximity to chargers say they’d consider buying an EV, that share drops to 50% among those whose nearest public charger is over 2 miles away.

Does road tripping experience affect attitudes toward EVs?

A dot plot showing that Those who frequently take long road trips and those who don’t have similar attitudes toward EVs

Some transportation experts have suggested that “range anxiety” associated with the need to charge EVs partway through longer road trips is a stumbling block to widespread EV adoption. But our data finds that attitudes toward EVs don’t differ that much based on how often people take long car trips.

In fact, those who regularly drive more than 100 miles are slightly more likely to say they currently own an electric vehicle or hybrid – and also to say they’d consider purchasing an EV in the future – when compared with those who make these trips less often.
Acknowledgments

This report is a collaborative effort based on the input and analysis of the following individuals:

Primary Researchers

Samuel Bestvater, Computational Social Scientist
Sono Shah, Associate Director, Data Labs

Research Team

Aaron Smith, Director, Data Labs
Eileen Yam, Director, Science and Society Research
Alec Tyson, Associate Director, Science and Society Research
Brian Kennedy, Senior Researcher
Athena Chapekis, Data Science Analyst
Emma Kikuchi, Research Assistant

Editorial and Graphic Design

Alissa Scheller, Senior Information Graphics Designer
Anna Jackson, Editorial Assistant

Communications and Web Publishing

Sogand Afkari, Communications Manager
Andrew Grant, Communications Associate
Janakee Chavda, Assistant Digital Producer

In addition, the project benefited greatly from the guidance of Pew Research Center’s survey methods team: Courtney Kennedy, Andrew Mercer, Dorene Asare-Marfo, Ashley Amaya, Arnold Lau and Dana Popky.

Appendix A: Regression analyses

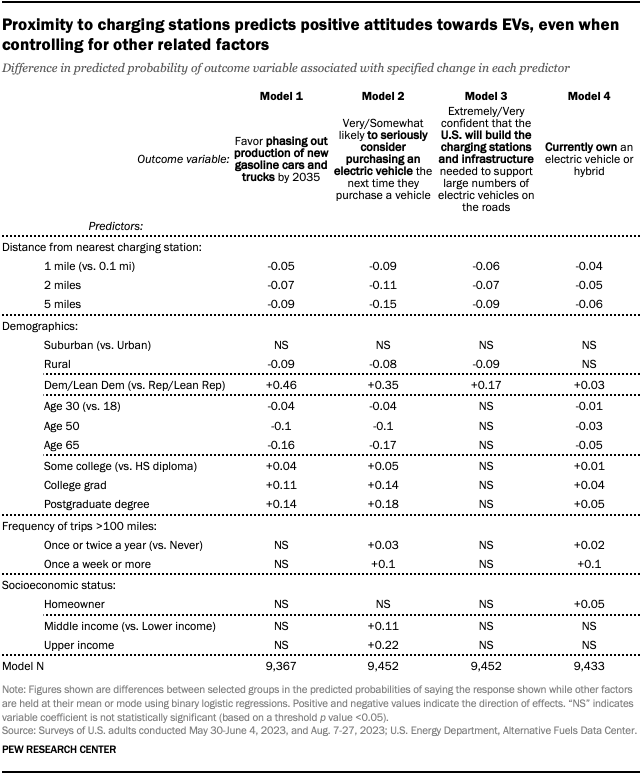
The following table details the results of a series of statistical models predicting various measures related to people’s attitudes toward electric vehicles from a set of explanatory variables, or predictors. These models can be interpreted as estimating the effect of proximity to charging infrastructure on these outcomes of interest, while controlling for other factors related to attitudes towards EVs such as urbanicity, political ideology and socioeconomic status.

The models used are binary logistic regression models based on the full sample of U.S. adults surveyed for this study. The analyses are based on the weighted sample, thus adjusting for differences in the probability of selection and nonresponse differences across groups. Results are reported as statistically significant based on a p value threshold of 0.05. Each model omits respondents who gave no response to one or more of the survey questions included in the models.

Four binary outcome variables are considered. Model 1 predicts whether respondents favor phasing out production of new gasoline cars and trucks by 2035; Model 2 predicts whether respondents say they are very or somewhat likely to seriously consider purchasing an EV; Model 3 predicts whether respondents say they are extremely or very confident that the U.S. will build the required infrastructure to support large numbers of EVs on the road; and Model 4 predicts whether respondents already own an electric vehicle or hybrid.

The explanatory variables included in each of these models are as follows:

  • Distance from nearest charging station: Included in the model as the natural logarithm of the distance from each respondent’s home address to the nearest publicly accessible charging station in miles.4 In the table of results, distances of 1 mile, 2 miles, and 5 miles are compared against a baseline distance of 0.1 miles.
  • Urbanicity: Included in the model as a categorical variable, with suburban and rural against a baseline category of urban.
  • Partisan identification: Included in the model as a categorical variable, with Dem/Lean Dem and No lean against a baseline category of Rep/Lean Rep. In the table of results, Dem/Lean Dem is compared against Rep/Lean Rep.
  • Age: Included in the model as each respondent’s age in years. In the table of results, ages of 30, 50 and 65 years are compared against a baseline age of 18 years.
  • Educational attainment: Included in the model as a numeric scale, ranging from 1 (equivalent to less than a high school diploma) to 6 (equivalent to a postgraduate degree). In the table of results, some college, college degree and postgraduate degree are compared against a baseline of high school graduate.
  • Frequency of car trips longer than 100 miles: Included in the model as a numeric scale, ranging from 1 (equivalent to never) to 5 (equivalent to once a week or more). In the table of results, Once or twice a year and once a week or more are compared against a baseline of never.
  • Home ownership: Included in the model as a binary variable.
  • Income class: Included in the model as a numeric scale, ranging from 1 (equivalent to lower income) to 5 (equivalent to upper income). In the table of results, middle income and upper income are compared against a baseline of lower income.

Each figure in the table shows the difference in predicted probability between two categories or values of an explanatory variable if that variable is a statistically significant predictor of the outcome variable of interest in a given model. For example, in the first column of the table (Model 1), an individual who identifies with or leans toward the Democratic party is 46% more likely than a Republican to favor phasing out production of new gasoline cars and trucks by 2035, holding the other variables at their central tendency (mean or mode, as appropriate). And in the same column (Model 1), someone who lives in a rural area is predicted to be 9% less likely than an urban resident to favor phasing out gas-powered vehicles, again holding the other variables at their respective mean or mode.

The total number of respondents in each analysis ranges between 9,367 and a possible maximum of 10,329 (the total number of respondents who took part in the survey), depending on the number of missing responses to the questions included in the models.

A table showing that Proximity to charging stations predicts positive attitudes towards EVs, even when controlling for other related factors

Based on these analyses, proximity to charging infrastructure is a statistically significant predictor of more positive attitudes toward EVs, even when controlling for other factors:

  • Those who live closer to charging stations are more in favor of phasing out production of gas-powered vehicles (Model 1). When compared with an individual who lives 0.1 miles from the nearest charger, someone who is 1 mile away is 5% less likely to say they favor phasing out production of new gasoline cars and trucks by 2035; someone 2 miles away is 7% less likely and someone 5 miles away is 9% less likely to say this.
  • Those who live closer to charging stations are more likely to consider buying an EV (Model 2). When compared with an individual who lives 0.1 miles from the nearest charger, someone who is 1 mile away is 9% less likely to say they are very or somewhat likely to seriously consider purchasing an electric vehicle the next time they purchase a vehicle; someone 2 miles away is 11% less likely and someone 5 miles away is 15% less likely to say this.
  • Those who live closer to charging stations are more confident that the U.S. will build the required infrastructure (Model 3). When compared with an individual who lives 0.1 miles from the nearest charger, someone who is 1 mile away is 6% less likely to say they are extremely or very confident that the U.S. will build the charging stations and infrastructure needed to support large numbers of electric vehicles on the roads; someone 2 miles away is 7% less likely and someone 5 miles away is 9% less likely to say this.
  • Those who live closer to charging stations are more likely to already own an electric vehicle or hybrid (Model 4). When compared with an individual who lives 0.1 miles from the nearest charger, someone who is 1 mile away is 4% less likely to already own an electric vehicle or hybrid; someone 2 miles away is 5% less likely and someone 5 miles away is 6% less likely to own one.

Appendix B: Vehicle-to-charger ratios for each state

Methodology

American Trends Panel survey methodology

The American Trends Panel (ATP), created by Pew Research Center, is a nationally representative panel of randomly selected U.S. adults. Panelists participate via self-administered web surveys. Panelists who do not have internet access at home are provided with a tablet and wireless internet connection. Interviews are conducted in both English and Spanish. The panel is being managed by Ipsos.

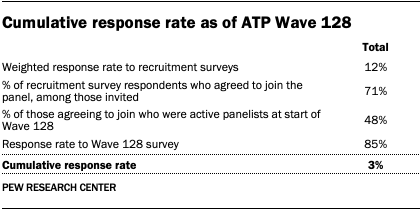
Data in this report is drawn from ATP Wave 128, conducted from May 30 to June 4, 2023, and includes an oversample of Hispanic adults, non-Hispanic Asian adults, non-Hispanic Black adults and 18- to 29-year-olds in order to provide more precise estimates of the opinions and experiences of these smaller demographic subgroups. These oversampled groups are weighted back to reflect their correct proportions in the population. A total of 10,329 panelists responded out of 12,178 who were sampled, for a response rate of 85%. The cumulative response rate accounting for nonresponse to the recruitment surveys and attrition is 3%. The break-off rate among panelists who logged on to the survey and completed at least one item is 2%. The margin of sampling error for the full sample of 10,329 respondents is plus or minus 1.5 percentage points.

Panel recruitment

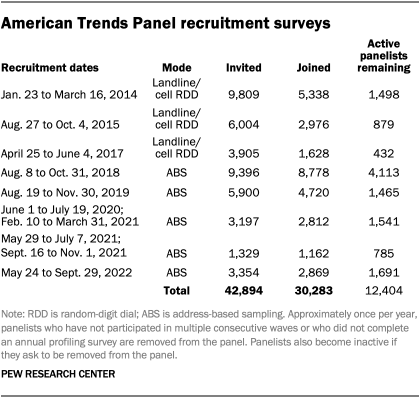
A table showing that American Trends Panel recruitment surveys

The ATP was created in 2014, with the first cohort of panelists invited to join the panel at the end of a large, national, landline and cellphone random-digit dial survey that was conducted in both English and Spanish. Two additional recruitments were conducted using the same method in 2015 and 2017, respectively. Across these three surveys, a total of 19,718 adults were invited to join the ATP, of whom 9,942 (50%) agreed to participate.

In August 2018, the ATP switched from telephone to address-based recruitment. Invitations were sent to a stratified, random sample of households selected from the U.S. Postal Service’s Delivery Sequence File. Sampled households receive mailings asking a randomly selected adult to complete a survey online. A question at the end of the survey asks if the respondent is willing to join the ATP. In 2020 and 2021 another stage was added to the recruitment. Households that did not respond to the online survey were sent a paper version of the questionnaire, $5 and a postage-paid return envelope. A subset of the adults who returned the paper version of the survey were invited to join the ATP. This subset of adults received a follow-up mailing with a $10 pre-incentive and invitation to join the ATP.

Across the five address-based recruitments, a total of 23,176 adults were invited to join the ATP, of whom 20,341 agreed to join the panel and completed an initial profile survey. In each household, one adult was selected and asked to go online to complete a survey, at the end of which they were invited to join the panel. Of the 30,283 individuals who have ever joined the ATP, 12,404 remained active panelists and continued to receive survey invitations at the time this survey was conducted.

The U.S. Postal Service’s Delivery Sequence File has been estimated to cover as much as 98% of the population, although some studies suggest that the coverage could be in the low 90% range.5 The American Trends Panel never uses breakout routers or chains that direct respondents to additional surveys.

Sample design

The overall target population for this survey was noninstitutionalized persons ages 18 and older living in the U.S., including Alaska and Hawaii. It featured a stratified random sample from the ATP in which Hispanic adults, non-Hispanic Asian adults, non-Hispanic Black adults and 18- to 29-year-olds were selected with certainty. The remaining panelists were sampled at rates designed to ensure that the share of respondents in each stratum is proportional to its share of the U.S. adult population to the greatest extent possible. Respondent weights are adjusted to account for differential probabilities of selection as described in the Weighting section below.

Questionnaire development and testing

The questionnaire was developed by Pew Research Center in consultation with Ipsos. The web program was rigorously tested on both PC and mobile devices by the Ipsos project management team and Pew Research Center researchers. The Ipsos project management team also populated test data that was analyzed in SPSS to ensure the logic and randomizations were working as intended before launching the survey.

Incentives

All respondents were offered a post-paid incentive for their participation. Respondents could choose to receive the post-paid incentive in the form of a check or a gift code to Amazon.com or could choose to decline the incentive. Incentive amounts ranged from $5 to $20 depending on whether the respondent belongs to a part of the population that is harder or easier to reach. Differential incentive amounts were designed to increase panel survey participation among groups that traditionally have low survey response propensities.

Data collection protocol

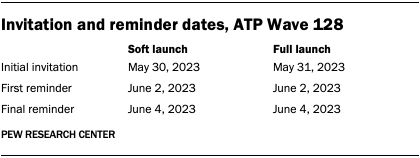
The data collection field period for this survey was May 30 to June 4, 2023. Postcard notifications were mailed to all ATP panelists with a known residential address on May 30. 

Invitations were sent out in two separate launches: soft launch and full launch. Sixty panelists were included in the soft launch, which began with an initial invitation sent on May 30. The ATP panelists chosen for the initial soft launch were known responders who had completed previous ATP surveys within one day of receiving their invitation. All remaining English- and Spanish-speaking sampled panelists were included in the full launch and were sent an invitation on May 31.

All panelists with an email address received an email invitation and up to two email reminders if they did not respond to the survey. All ATP panelists who consented to SMS messages received an SMS invitation and up to two SMS reminders.

A table showing Invitation and reminder dates, ATP Wave 128

Data quality checks

To ensure high-quality data, the Center’s researchers performed data quality checks to identify any respondents showing clear patterns of satisficing. This includes checking for very high rates of leaving questions blank, as well as always selecting the first or last answer presented. As a result of this checking, 19 respondents were removed from the survey dataset. An additional 70 respondents were removed from the survey due to a sample loading error which occurred during survey launch. All 89 ATP respondents were excluded from the data prior to weighting and analysis.

Weighting

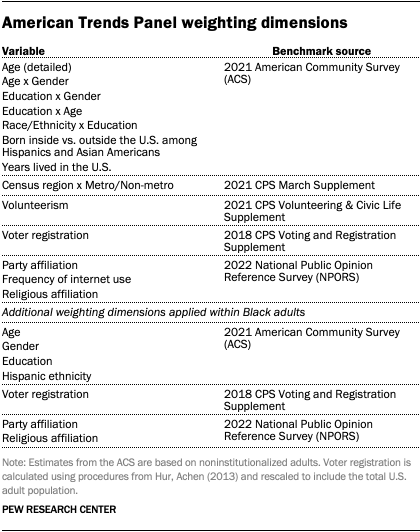
A table showing American Trends Panel weighting dimensions

The ATP data is weighted in a multistep process that accounts for multiple stages of sampling and nonresponse that occur at different points in the survey process. First, each panelist begins with a base weight that reflects their probability of selection for their initial recruitment survey. These weights are then rescaled and adjusted to account for changes in the design of ATP recruitment surveys from year to year. Finally, the weights are calibrated to align with the population benchmarks in the accompanying table to correct for nonresponse to recruitment surveys and panel attrition. If only a subsample of panelists was invited to participate in the wave, this weight is adjusted to account for any differential probabilities of selection.

Among the panelists who completed the survey, this weight is then calibrated again to align with the population benchmarks identified in the accompanying table and trimmed at the 1st and 99th percentiles to reduce the loss in precision stemming from variance in the weights. Sampling errors and tests of statistical significance take into account the effect of weighting.

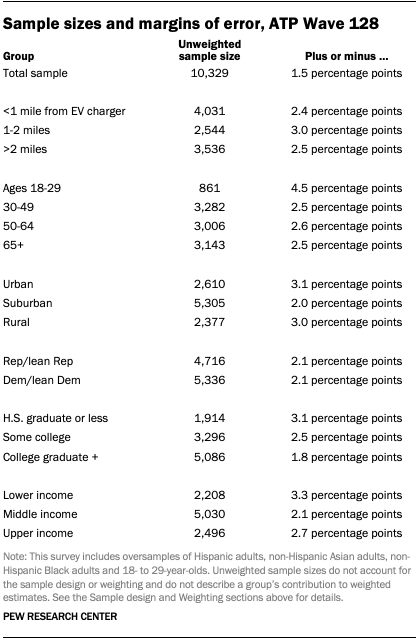
The following table shows the unweighted sample sizes and the error attributable to sampling that would be expected at the 95% level of confidence for different groups in the survey.

A table showing Sample sizes and margins of error, ATP Wave 128

Sample sizes and sampling errors for other subgroups are available upon request. In addition to sampling error, one should bear in mind that question wording and practical difficulties in conducting surveys can introduce error or bias into the findings of opinion polls.

Dispositions and response rates

A table showing Final dispositions, ATP Wave 128
A table showing Cumulative response rate as of ATP Wave 128

Adjusting income and defining income tiers

To create upper-, middle- and lower-income tiers, respondents’ 2021 family incomes were adjusted for differences in purchasing power by geographic region and household size. “Middle-income” adults live in families with annual incomes that are two-thirds to double the median family income in the panel (after incomes have been adjusted for the local cost of living and household size). The middle-income range for the American Trends Panel is about $43,800 to $131,500 annually for an average family of three. Lower-income families have incomes less than roughly $43,800, and upper-income families have incomes greater than roughly $131,500 (all figures are expressed in 2021 dollars).

Based on these adjustments, 29% of respondents in Wave 128 are lower income, 47% are middle income and 18% fall into the upper-income tier. An additional 6% either didn’t offer a response to the income question or the household size question.

Here is more information about how the income tiers were determined.

Additional survey questions

Additional questions used for this analysis were asked on ATP Wave 133. Read more about the methodology for Wave 133.

Sources for geographic data

EV charger locations

Data on the locations of EV chargers in the United States comes from the U.S. Energy Department’s Office of Energy Efficiency & Renewable Energy and its Alternative Fuels Data Center, which maintains a database of alternative fueling stations that includes EV chargers.

EV registrations

Data on the number of electric vehicles registered in each state comes from the U.S. Energy Department’s Office of Energy Efficiency & Renewable Energy and its Alternative Fuels Data Center, which maintains a database of vehicle registration counts and associated fuel types by state.

Urban and rural census blocks

Data on whether a census block is considered an urban or rural area is based on the Census Bureau’s updated urban-rural classification scheme.

© Pew Research Center 2024