
Pew Research Center

FOR RELEASE DECEMBER 16, 2019

The Digital Pulpit: A Nationwide Analysis of Online Sermons

Computational analysis of nearly 50,000 sermons reveals differences in length and content across major Christian traditions
FOR MEDIA OR OTHER INQUIRIES:

Communications Department
202.419.4372
www.pewresearch.org

RECOMMENDED CITATION

Pew Research Center, December 2019, "The Digital Pulpit: A Nationwide Analysis of Online Sermons"

About Pew Research Center

Pew Research Center is a nonpartisan, nonadvocacy fact tank that informs the public about the issues, attitudes and trends shaping the world. It does not take policy positions. The Center conducts public opinion polling, demographic research, computational social science research and other data-driven research. It studies politics and policy; news habits and media; the internet and technology; religion; race and ethnicity; international affairs; social, demographic and economic trends; science; research methodology and data science; and immigration and migration. Pew Research Center is a subsidiary of The Pew Charitable Trusts, its primary funder.

© Pew Research Center 2026

Table of contents

  • About Pew Research Center
  • The Digital Pulpit: A Nationwide Analysis of Online Sermons
  • Acknowledgments
  • Methodology

The Digital Pulpit: A Nationwide Analysis of Online Sermons

Computational analysis of nearly 50,000 sermons reveals differences in length and content across major Christian traditions

Many surveys have asked Americans about their religious affiliations, beliefs and practices, including what religious group they belong to – if any – and how often they attend services at a church or other house of worship. But less is known about what churchgoing Americans hear during religious services. Frequent churchgoers may have a good sense of what kind of sermons to expect from their own clergy: how long they usually last, how much they dwell on biblical texts, whether the messages lean toward fire and brimstone or toward love and self-acceptance. But what are other Americans hearing from the pulpits in their congregations?

A new Pew Research Center analysis begins to explore this question by harnessing computational techniques to identify, collect and analyze the sermons that U.S. churches livestream or share on their websites each week. To gather the data used in this report, the Center built computational tools that identified every institution labeled as a church in the Google Places application programming interface (API), collected and transcribed all the sermons publicly posted on a representative sample of their websites during an eight-week period, and analyzed the content of the sermons in a few relatively simple ways. For practical reasons, this exploration is limited to Christian churches and does not describe sermons delivered in synagogues, mosques or other non-Christian congregations.1

How this report defines a sermon

The word “sermon” typically refers to the portion of a religious service in which a preacher offers commentary or guidance through a theological or religious lens. However, U.S. churches vary widely in the structure of their services and how much of those services they post online. Some post just the sermon. Others post the sermon and part of the service. Still others post the entire service. In many cases, the beginning and end of a sermon are not clearly labeled in the text, audio or video files on a congregation’s website. As a result, the automated tools used for this analysis cannot always isolate sermons from other elements of religious services with precision.

In this report, an “online sermon” refers to a portion of a religious service posted to a church website that contains a commentary from the pulpit but sometimes may include other parts of the service as well.

This process produced a database containing the transcribed texts of 49,719 sermons shared online by 6,431 churches and delivered between April 7 and June 1, 2019, a period that included Easter.2 These churches are not representative of all houses of worship or even of all Christian churches in the U.S.; they make up just a small percentage of the estimated 350,000-plus religious congregations nationwide. Compared with U.S. congregations as a whole, the churches with sermons included in the dataset are more likely to be in urban areas and tend to have larger-than-average congregations (see the Methodology for full details).

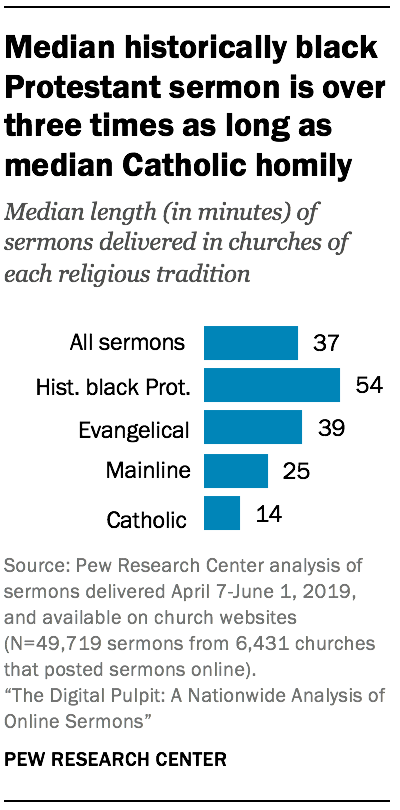
The median sermon scraped from congregational websites is 37 minutes long. But there are striking differences in the typical length of a sermon in each of the four major Christian traditions analyzed in this report: Catholic, evangelical Protestant, mainline Protestant and historically black Protestant.3

Catholic sermons are the shortest, at a median of just 14 minutes, compared with 25 minutes for sermons in mainline Protestant congregations and 39 minutes in evangelical Protestant congregations. Historically black Protestant churches have the longest sermons by far: a median of 54 minutes, more than triple the length of the median Catholic homily posted online during the Easter study period.

What is a median

The median is the middle number in a list of figures sorted in ascending or descending order. For instance, the median of [1, 2, 3, 4, 5] is 3. Medians are often used when describing data that contain a small number of unusually large or small values (“outliers”) that can adversely affect other statistics, such as the mean.

Researchers also conducted a basic exploration of sermons’ vocabulary. Several words frequently appear in sermons at many different types of churches – for instance, words such as “know,” “God” and “Jesus” were used in sermons at 98% or more of churches in all four major Christian traditions included in this analysis.4
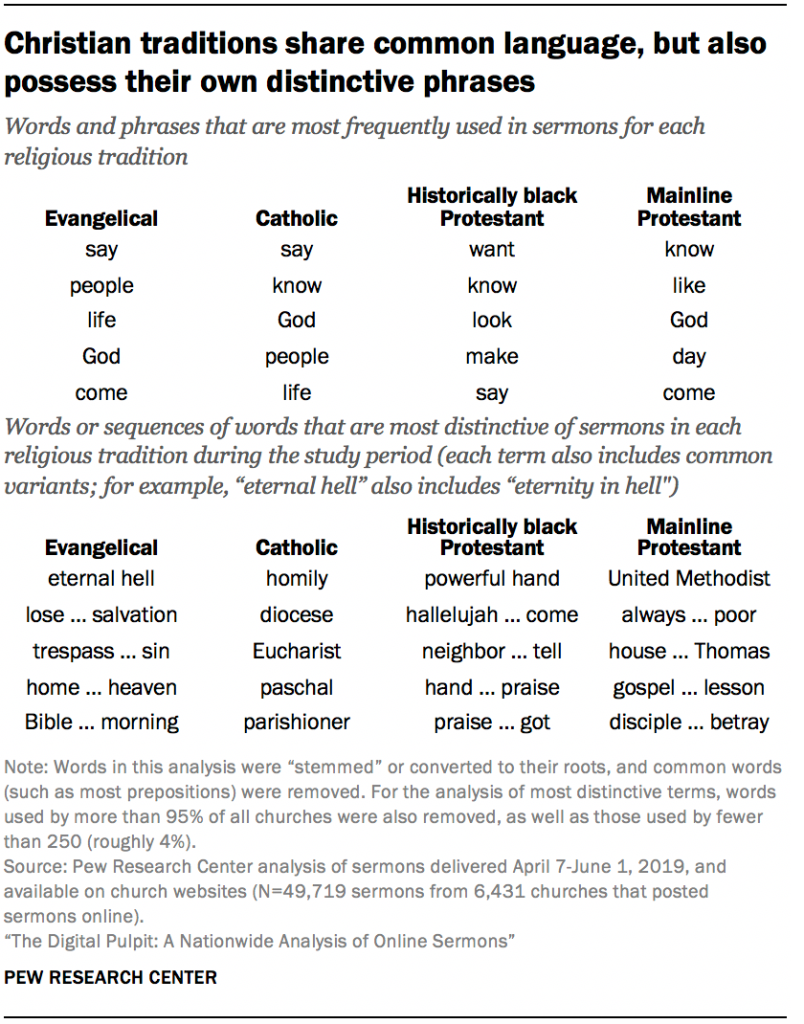
This computational text analysis also found many words and phrases that are used more frequently in the sermons of some Christian groups than others.

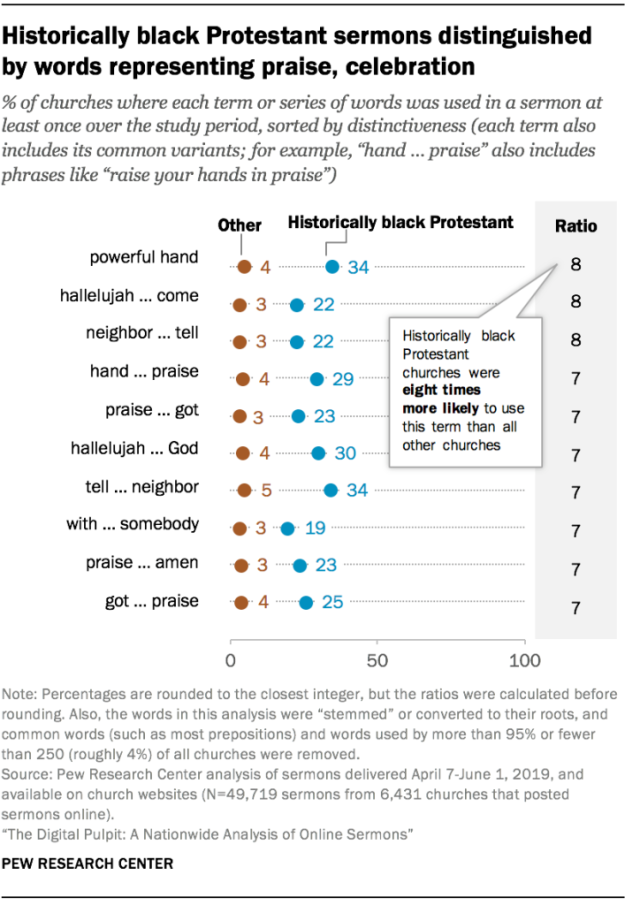
For instance, the distinctive words (or sequences of words) that often appear in sermons delivered at historically black Protestant congregations include “powerful hand” and “hallelujah … come.” The latter phrase (which appears online in actual sentences such as “Hallelujah! Come on … let your praises loose!”) appeared in some form in the sermons of 22% of all historically black Protestant churches across the study period. And these congregations were eight times more likely than others to hear that phrase or a close variant. Although the word “hallelujah” is by no means unique to historically black Protestant services, this analysis indicates that it is a hallmark of black Protestant churches.

Meanwhile, the distinctive vocabulary of Catholic sermons includes “homily” (which is what Catholics typically call a sermon) as well as “diocese” and “Eucharist.”

The two analytic lenses used in this report

This report uses two different comparison groups depending on the focus of the analysis. Some findings are based on the share of all sermons that have certain characteristics (for example, “61% of sermons reference the name of a book from the Old Testament,” or “the median evangelical Protestant sermon is 39 minutes long.”)

Other findings are based on the share of all churches that have certain characteristics (for example, “37% of all Catholic churches used the word ‘homily’ at least once during the study period.”) These analyses aggregate all sermons delivered at a single church and analyze them together, to represent what a consistent attendee at that church would have heard over the duration of the study period.

The findings about the most common or distinctive words are based on the share of churches, because calculating the share of all sermons that use a particular word would give little indication of whether the word was used across a wide swathe of churches or just many times in a few churches. The findings about the median length of sermons and how often they include citations of books of the Old Testament (the Hebrew Bible) and the New Testament (which includes the Christian Gospels) are based on the content of individual sermons.

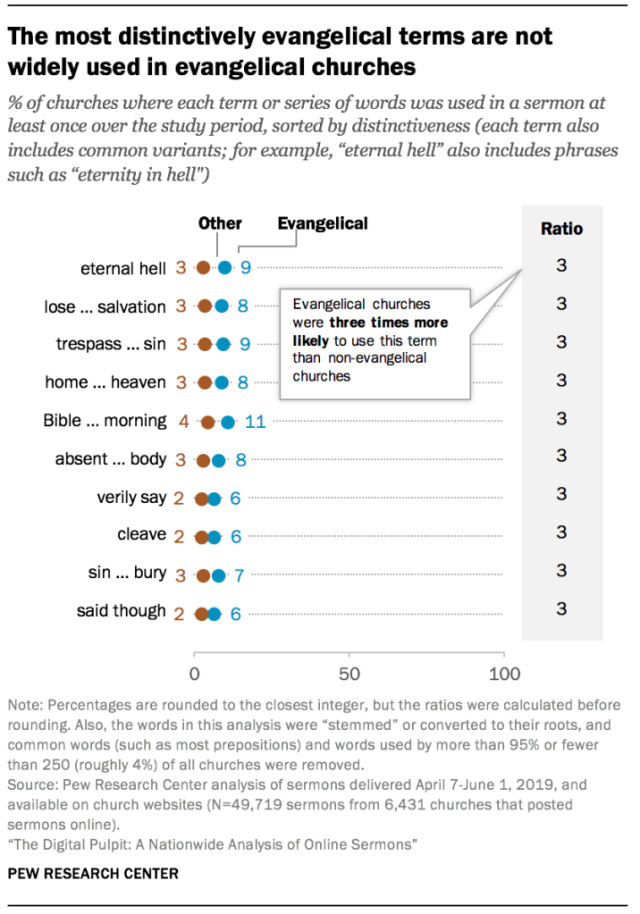
Some terms are distinctive to a religious tradition but are not very common even within that tradition. For example, the three terms most disproportionately used in evangelical sermons include variants of the phrases “eternal hell,” “lose … salvation,” and “trespass … sin” (which appear online in actual sentences such as, “Either allow what he did to pay for your sin, or you are going to pay for your sin in eternity, in hell. That’s the Gospel we have.”). But only one distinctively evangelical phrase (“Bible … morning”) was used in a sermon at more than 10% of evangelical congregations during the study period.

Indeed, a congregant who randomly chose one of the evangelical churches in the study and listened to all the sermons it posted online during the eight-week period would have only a one-in-ten chance of hearing the most distinctive phrase in evangelical sermons – “eternal hell” or a close variant, such as “eternity in hell” – compared with a nearly four-in-ten chance of hearing the most distinctively Catholic term (“homily”) if that listener chose a Catholic church.

Meanwhile, an analysis of which books of the Bible are cited by name suggests that preachers nationwide, across all major Christian traditions, are more likely to refer to books from the New Testament (90% of all online sermons do so) than the Old Testament (61%).

A attachment in the editor

This pattern is especially pronounced in mainline Protestant and Catholic sermons: These two groups are, respectively, 39 percentage points and 40 percentage points more likely to mention a book of the New Testament than to mention a book of the Old Testament by name in any given sermon. This may reflect the fact that most ministers in the mainline Protestant and Catholic traditions preach on the day’s Gospel reading, which is always from the New Testament.

References to books of the Bible also vary over time. For instance, the share of all sermons that mention a book of the Old Testament by name declined by 13 percentage points on the week of Easter Sunday (to 49% from 62% the previous week) and then rebounded the following week.

These are among the key findings of the Center’s initial foray into analyzing the nature and content of online sermons using computational approaches. For more details on how the database was built and the natural language processing tools used in the analysis, see the Methodology.

In interpreting these findings and the ones that follow, several cautions are warranted:

  • The sermons included in this dataset are not necessarily representative of all the sermons delivered in U.S. religious congregations. To begin with, not all congregations are Christian churches. Moreover, not all Christian churches make their sermons publicly available online. And the churches that do place sermons online may choose selectively, posting some but not others.
  • The sermons were collected during an eight-week period in 2019 that included Easter. Sermons delivered around Easter may be different, in content as well as in length, from sermons delivered at other times of year.
  • Some churches include audio or video recordings of other parts of a worship service – such as Bible readings, hymns and prayers – along with the sermons they post online. If a sermon was posted online along with Bible readings, prayers or music, and without a clear separation, the sermon could be counted by the text processing tools as longer than it actually was.
  • By the same token, if a congregation posted only a portion of a worship service online, the parts that were not posted cannot be included in the analysis. For example, if a congregation posted only half of a sermon online, it would be counted as shorter than it really was.

A note on data privacy

All of the sermons analyzed in this report were shared publicly on church websites, or on services – such as YouTube – that were linked from those websites. In some cases, congregational websites made some attempt to prevent the sermons they share online from being viewed or downloaded by nonmembers – for instance, by storing them in a hard-to-reach database or behind a login screen. The Center made absolutely no attempt to access these sermons, even when it would have been possible.

Out of concern for the privacy of congregations and clergy, the data is presented in this report in aggregate form, without citing identifying information such as congregations’ names or addresses.

Nevertheless, the nearly 50,000 sermons collected in this analysis offer a window into the messages that millions of Americans hear from pulpits across the country. The view is limited and does not come close to revealing all the meaningful communications between American clergy and their congregations, but it is an attempt to look systematically and objectively at a large portion of those communications.

This research also builds on earlier computational research on religion, such as a study analyzing the sermons that pastors share in text form on dedicated sermon hosting sites like SermonCentral.com.5 Pew Research Center’s computational analysis brings a new level of comprehensiveness to the study of sermons, beginning with a very large database of U.S. churches – identified using Google Places – and collecting not only sermons that have been posted in plain text form, but also transcribing sermons that were shared in audio and video formats on congregations’ main websites.

The rest of this report takes a closer look at the findings from the new analysis, including differences across major Christian traditions in the content and length of sermons as well as their most common biblical citations.

How Pew Research Center collected and analyzed the online sermons used in this report

To collect the sermons analyzed in this report, data scientists deployed a custom-built computer program (a web scraper) to the public websites of 38,630 American churches. The websites of these churches were identified using the Google Places API. Thus, the churches can be considered representative of all Christian churches with English-language websites listed on Google Maps. Researchers also gathered commercially available information about these churches’ denominations, membership sizes and racial compositions, where possible.

The scraper automatically navigated through the website of each church, using machine learning technology to find any pages with sermons in audio, video or text form. The scraper then downloaded each sermon along with the date it was delivered, and, if necessary, transcribed it from audio to text using automated methods. If churches shared sermons somewhere other than their websites – such as on Facebook accounts or in printed (hard copy) form – those sermons could not be included in this research. Sermons posted to YouTube, Vimeo or common sermon-sharing sites such as SermonAudio.com were collected only if the account was directly linked from the church website.

The resulting database contains the text of 49,719 sermons shared by 6,431 U.S. religious congregations, nearly all of which are Christian churches. All the sermons were delivered between April 7 and June 1, 2019, a period that included some of Lent, Easter Sunday and several weeks following Easter.

Researchers were able to identify a denomination (such as the Southern Baptist Convention), denominational family (for example, Baptist), approximate membership size and predominant race or ethnicity for 5,677 of these 6,431 congregations (88%). Where available, these variables were used to identify each congregation’s religious tradition. U.S. churches belong to a wide range of religious traditions. However, only four broad traditions were numerous enough in the sermons dataset to be analyzed and broken out separately in this report: Catholic, evangelical Protestant, mainline Protestant and historically black Protestant.

The final dataset includes sermons publicly posted on the websites of 2,156 evangelical Protestant congregations, 1,367 mainline Protestant congregations, 422 Catholic parishes and 278 historically black Protestant congregations. The remaining congregations could not be reliably classified, belong to other Christian traditions (such as Orthodox Christian denominations) or belong to other faiths; their sermons are not described separately, though they are included in the overall analysis of all sermons online, and they are counted in the total figures.

To the Center’s knowledge, this research is the most exhaustive attempt to date to catalogue and analyze American religious sermons. It is not, however, representative of all sermons delivered in U.S. churches. See the Appendix for more details on how the congregations included in this study differ from congregations nationwide. See the Methodology for additional technical information on how this study was conducted.

Sermon length varies across religious traditions
A attachment in the editor

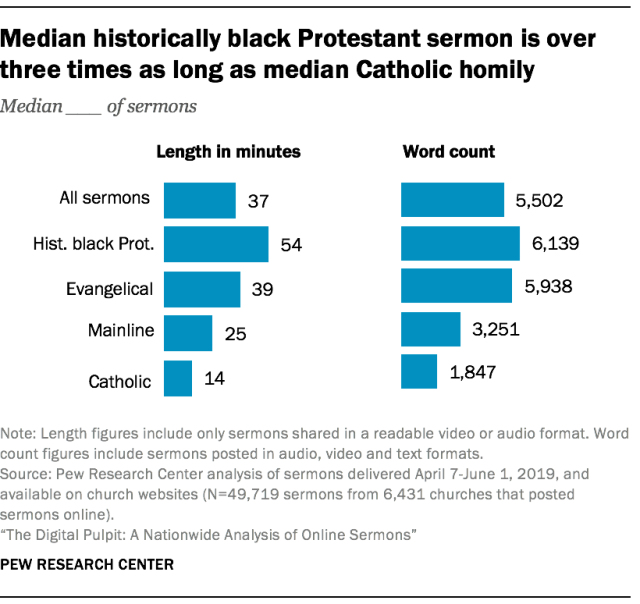
Among sermons shared in video or audio format in a sufficiently high-quality file that the Center could determine their length, the median sermon in this dataset runs 37 minutes in length.6

However, the length of a typical sermon varies widely among churches in different religious traditions. The median sermon collected from the website of a historically black Protestant church (54 minutes) is more than three times as long as the median Catholic homily (which runs just 14 minutes). Evangelical and mainline Protestant sermons fall somewhere in between: Sermons found on the websites of evangelical churches run a median of 39 minutes, fully 14 minutes longer than those collected from mainline Protestant churches (25 minutes).

These findings largely hold true when word count, rather than duration, is used to measure the length of sermons.7 However, there is one notable exception: Historically black Protestant sermons are roughly as long as evangelical Protestant sermons when measured by word count, but 38% longer when measured by duration. This suggests that there may be more time in sermons delivered at historically black Protestant congregations during which the preacher is not speaking, such as musical interludes, pauses between sentences or call and response with people in the pews.

Sermons share common language, but some terms are distinctive
A attachment in the editor

Certain words and phrases appear consistently across the sermons of all Christian traditions, while other expressions are more commonly used in certain traditions. To conduct this analysis, researchers first stripped each sermon of “stop words” (common pronouns, articles, prepositions and other words with little significance on their own).8

To simplify the analysis and to avoid repeated mentions of similar words or phrases, each remaining word was then converted to its root. For instance, “Bible” and “biblical” would both become “bibl.” As a result, words or phrases that are similar but not identical may be shortened to the same piece of text. The phrases “eternity in hell” and “eternal hell,” for instance, would both be shortened to “etern hell.”

The statistics in this section speak to the share of all churches in which a particular word or phrase appeared in a sermon at least once during the study period, rather than the share of all sermons that contain that term. This is because sermon-level statistics would offer few clues as to whether a particular phrase crops up at least occasionally in a large percentage of churches, or whether that phrase appears in a large number of sermons delivered at a small percentage of all churches.

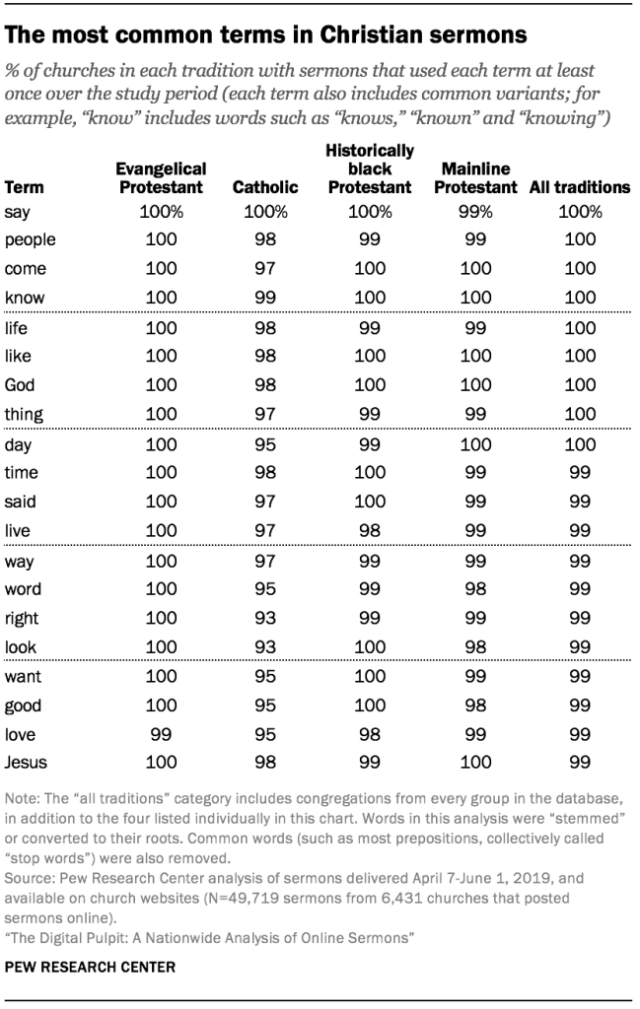
Across the four largest U.S. Christian traditions, the most commonly used words in online sermons are simple, broadly applicable terms. The three words that appear most frequently in sermons are “say,” “people” and “come” – they are included in nearly every church’s sermons. “Know,” “life” and “like” make the next most frequent appearances, again in nearly all churches in the study. “Jesus” is the 20th most common term, used in sermons at 99% of congregations. These rates vary by only a small margin across Christian traditions. Of the top 20 words, all were used in sermons at more than 90% of churches in each major Christian tradition in this analysis.

A attachment in the editor

In addition to calculating the most common terms across Christian traditions, researchers also identified the words and phrases that congregations of each major Christian tradition were disproportionately likely to hear in sermons, compared with congregations in the other traditions. Researchers identified these “most distinctive” terms by calculating the share of all churches in a Christian group with sermons that used a given word or phrase over the study period, as well as the share of all churches not in that group where the word or phrase was used, and then dividing the former by the latter to establish a ratio. In addition to converting each word to its stem, as in the preceding analysis, researchers removed any words used in sermons at fewer than 250 churches (4%) or at more than 95% of all churches (6,109).

Some of the findings are commonsensical. For instance, Catholic congregations were 21 times more likely than others to hear the term “homily” at least once during the study period, and they were 15 times more likely to hear “diocese” and “Eucharist.”9
A attachment in the editor

In other cases, a tradition’s most distinctive terms may reflect some aspect of its teachings or its lectionary (a calendar of weekly readings). For example, Catholic sermons from the study period are more likely than others to contain the word “paschal,” which refers to Easter and to what the Catholic Catechism calls the “paschal mystery” of the passion, death and resurrection of Jesus.

Certain expressions may be distinctive to the sermons of a particular Christian tradition but not especially common even within that tradition. Evangelical sermons are an especially notable example of this phenomenon.

Evangelical sermons contain a number of distinctive words and phrases relating to sin, punishment and redemption. But most of these terms were used in sermons at fewer than 10% of all evangelical churches across the study period. For instance, sermons from evangelical churches were three times more likely than those from other traditions to include the phrase “eternal hell” (or variations such as “eternity in hell). However, a congregant who attended every service at a given evangelical church in the dataset had a roughly one-in-ten chance of hearing one of those terms at least once during the study period. By comparison, that same congregant had a 99% chance of hearing the word “love.”
A attachment in the editor

In addition to being less common overall, the most distinctively evangelical terms also are less distinctive than those of other Christian traditions. For example, evangelical congregations were only three times more likely than others to hear the phrase “eternal hell” in a sermon during the study period, while Catholic congregations were 12 times more likely than others to hear the word “paschal.”

Other distinctively evangelical terms include variations of the phrases “lose … salvation” (used in 8% of all sermons delivered to evangelical congregations over the course of the data collection), “trespass … sin” (9%), and “home … heaven” (8%). In each case, evangelical churches were about three times as likely as others to have these words in their sermons.

Several of the terms that distinguish sermons from historically black Protestant churches include the words “hallelujah” and “neighbor.” Both “neighbor … tell” and “tell … neighbor” rank among the 10 words and phrases most disproportionately used in historically black Protestant sermons. (The actual phrases used in a sermon might be something like “tell your neighbor” but would be shortened in the text processing. Similarly, the exhortation to “lift your hands in praise” would become “hand … praise.”)

The phrase that is most distinctive to historically black Protestant congregations is “powerful hand.” Some 34% of black Protestant churches used some variation of this expression in a sermon during the study period, compared with just 4% of other congregations. Two of the historically black Protestant tradition’s 10 most distinct phrases include the word “hallelujah.”
A attachment in the editor

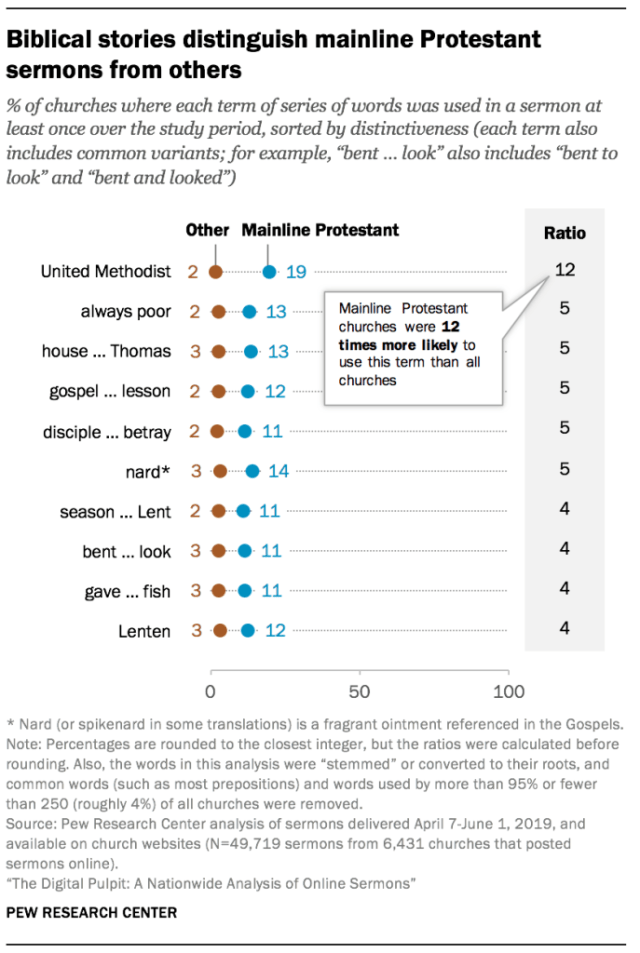
In mainline Protestant churches, the most distinctive phrase is “United Methodist,” which is the name of the largest mainline Protestant denomination in the U.S. This phrase was heard in the sermons of 19% of mainline Protestant congregations during the time period studied. Notably, the 2014 Pew Research Center Religious Landscape Study found that a similar share (about a quarter) of all mainline Protestants belong to the United Methodist Church.

Beyond that, the language that most distinguishes sermons in mainline Protestant churches seems to center around biblical stories. Such phrases include “disciple … betray,” and “bent … look.”

Most sermons mention books from both Old and New Testaments

How Pew Research Center analyzed biblical citations

Researchers identified biblical citations by looking for the names of books, Gospels, or epistles of the Bible. To compile this list of books, the Center used the five versions of the Bible most commonly read aloud in U.S. congregations as of 2012 (excluding congregations that report reading multiple translations), according to the National Congregations Study.

For book names that are not commonly used in other contexts – for instance, “Thessalonians” – researchers simply counted any use of the name. For books such as “John” that have a wider range of uses unrelated to scripture, researchers included extra restrictions to avoid overestimating the rate at which books are cited.

For these books, researchers only included the name if it appeared no further than three words from a one- or two-digit number, the word “book” or “chapter” or its classification in the Bible (such as “epistle” or “Gospel”). These searches were case-insensitive. The word “book” sufficed even for pieces of scripture that are Gospels or epistles.

For example, the phrases “John 14,” “in John chapter 14, verses 1 through 6” and “turn to John, chapter 14” – as well as simply “the Gospel of John” – would all qualify as a mention of the Book of John. “John” alone would not. Books preceded by a volume number (such as II Peter) were counted if preceded by a number (“2 Peter”) or with an ordinal label (“2nd Peter” or “second Peter”).

The sermons that American churches share online are heavily laced with scripture: 95% reference at least one book, Gospel or epistle of the Bible by name, and more than half (56%) cite particular books from both the Old Testament (also known as the Hebrew scriptures) and the New Testament (which includes the Christian Gospels) in the same sermon. These numbers vary across Christian groups, with evangelical churches being the most likely to reference a book, Gospel or epistle of the Bible by name – doing so in 97% of all sermons. Pastors across the country are more likely to reference the New Testament by name (90% do so) than to mention the Old Testament (61%).

In contrast to the preceding analysis, this section of the report is based on sermons, rather than churches. Because almost every congregation in the dataset heard at least one sermon that mentioned books from both the New and Old Testaments during the study period, using the percentage of sermons as a frame of reference allows for a more revealing assessment of differences across religious traditions.

In addition, these findings may be influenced by the method used to identify references to the Old and New Testaments, as well as the ways that different churches share elements of their services online. For example, if a Catholic church posted the scripture reading that generally precedes a Catholic homily, the text processing tools would likely count it as naming a particular book of the Bible. But if the leader of a different church referred to those readings by saying, “in our first reading” or “as we heard in our second reading” – without naming the readings themselves – it would not be counted as a citation of a particular book of scripture.

A attachment in the editor

Books from the New Testament are more commonly cited than books from the Old Testament across every Christian group. At least one book from the New Testament is named in 90% of all sermons, while a book of the Old Testament is cited in 61% of sermons.

Clergy in evangelical and historically black Protestant churches mention the names of books from the Old Testament most frequently. Roughly two-thirds of sermons delivered to these congregations mention specific books of the Old Testament, compared with 43% of mainline Protestant sermons and 28% of Catholic homilies.

Catholic and mainline Protestant sermons have the largest gap between references to the New and Old Testaments – sermons from these two groups are, respectively, 40 percentage points and 39 percentage points more likely to reference a book of the New Testament than a book of the Old Testament. Mainline sermons, however, reference scripture more frequently: 88% of all mainline sermons mention the name of at least one book of the Bible, compared with 73% of Catholic homilies that cite a book of the Bible by name.

By comparison, evangelical sermons are 27 percentage points more likely to reference the New Testament (93%) than the Old Testament (66%). Historically black Protestant sermons exhibit the smallest gap, at 20 points (85% vs. 65%).

Evangelical sermons also are the most likely to name a book from both the Old and New Testaments in the same sermon: 62% of all sermons from evangelical churches did so in the study period, compared with 56% of historically black Protestant sermons, 37% of mainline Protestant sermons and 22% of Catholic homilies.

Scripture citations are likely influenced by calendars such as the common lectionary, which specifies which biblical passages should be read during weekly services for many groups. This influence can be seen most clearly on Easter Sunday, which occurred during the third of the study’s eight weeks for most U.S. Christians. Mentions of books from the Old Testament across all Christian groups dropped by 13 points during the week that began on Easter Sunday (to 49% during the week of Easter Sunday from 62% a week earlier) before rebounding the following week. Mentions of books from the New Testament, however, stayed roughly steady throughout the study period.

Smaller churches more likely to cite books of Old Testament by name

A attachment in the editor

The size of a congregation’s membership also is somewhat related to whether its sermons mention books of the Bible by name. But to the extent that differences exist between smaller and larger congregations, they tend to be dwarfed by the effect of that church’s Christian tradition (for example, evangelical or mainline).

For example, pastors at churches with 200 or fewer members cited specific books from the Old Testament in 6% more of their sermons, on average, than those at churches with more than 200 members. This tendency generally holds true within Christian traditions: For instance, smaller mainline congregations heard a reference to the Old Testament in 45% of their sermons, compared with 39% at larger mainline churches during the study period.

CORRECTION: (Jan. 27, 2020): In the chart “Christian traditions share common language, but also possess their own distinctive phrases,” the “evangelical” column has been edited to correct for a data tabulation error. Changes did not affect the report’s substantive findings.

Acknowledgments

This report was produced by Pew Research Center as part of the Pew-Templeton Global Religious Futures project, which analyzes religious change and its impact on societies around the world. Funding for the Global Religious Futures project comes from The Pew Charitable Trusts and the John Templeton Foundation.

This report is a collaborative effort based on the input and analysis of the following individuals. Find related reports online at pewresearch.org/pewresearch-org/religion.

Primary Researcher

Dennis Quinn, Computational Social Scientist

Research Team

Brian Broderick, Data Science Engineer Gregory A. Smith, Associate Director of Research Emma Remy, Data Science Assistant Besheer Mohammed, Senior Researcher Patrick van Kessel, Senior Data Scientist Aaron Smith, Director of Data Labs Alan Cooperman, Director of Religion Research Claudia Deane, Vice President for Research Andrew Mercer, Senior Research Methodologist Adam Hughes, Associate Director of Research Regina Widjaya, Computational Social Scientist Sono Shah, Computational Social Scientist Claire Gecewicz, Research Associate Rachel Sweeney, Assistant DevOps Engineer Madhu Kumar, Research Assistant Erica Turner, Internet and Science Intern Andrew Perrin, Research Analyst

Editorial and Graphic Design

Michael Lipka, Editorial Manager Aleksandra Sandstrom, Copy Editor Peter Bell, Design Director Bill Webster, Information Graphics Designer           

Communications and Web Publishing

Stacy Rosenberg, Associate Director, Digital Travis Mitchell, Digital Producer Anna Schiller, Communications Manager Rachel Weisel, Senior Communications Manager Andrew Grant, Communications Associate

Others at Pew Research Center also gave valuable feedback on this report, including Kiana Cox, Ruth Igielnik, Bradley Jones, Alycia Kantor, Hannah Klein, Rebecca Schmitt, Elizabeth Podrebarac Sciupac and Galen Stocking. Former Pew Research Center Data Labs Director Solomon Messing also contributed to this report. Outside guidance was provided by Mark Chaves, Professor of Sociology, Duke University.

Methodology

This study is based on an analysis of 49,719 sermons, delivered between April 7 and June 1, 2019, and collected from the websites of 6,431 churches found via the Google Places application programming interface (API), a tool that provides information about establishments, geographic locations or points of interest listed on Google Maps. Pew Research Center data scientists collected these sermons over the course of one month (June 6 to July 2, 2019) using a custom-built computer program that navigated church websites in search of sermons. The program used a machine learning model to identify pages likely to contain sermons and a set of specially designed algorithms to collect media files with dates from those pages, identify the files containing sermons and transcribe those files for further analysis.

Researchers conducted this process on two sets of churches:

  • A sample of every church found on Google Places, which researchers designed to ensure that there were enough cases to analyze sermons from smaller Christian traditions.
  • Every congregation that was nominated for possible participation in the 2018-2019 National Congregations Study (NCS), a representative survey of U.S. religious congregations.10

The following represent the major steps in the data collection process, along with a brief description. Each is described in greater detail in the sections of the methodology that follow.

Finding every church on Google Maps: The Center began by identifying every institution labelled as a church in the Google Places API, including each institution’s website (if it shared one). This yielded an initial pool of 478,699 institutions. This list contained many non-congregations and duplicative records, which were removed in subsequent stages of the data collection process.

Determining religious tradition, size, and predominant race or ethnicity: The churches found via the Google Places API lacked critical variables like denomination, size or predominant racial composition. To obtain these variables, Center researchers attempted to match every church found on Google Places to a database of religious congregations maintained by InfoGroup, a targeted marketing firm. This process successfully matched 262,876 congregations and captured their denomination, size and racial composition – where available – from the InfoGroup database.

Identifying and collecting sermons from church websites: Center data scientists deployed a custom-built software system (a “scraper”) to the websites of a sample of all churches in the initial dataset – regardless of whether they existed in the InfoGroup database – to identify, download and transcribe the sermons they share online. This program navigated to pages that appeared likely to contain sermons and saved every dated media file on those pages. Files dated between April 7, 2019, and June 1, 2019, were downloaded and transcribed. Researchers then coded a subset of these transcripts to determine whether they contained sermons and trained a machine learning model to remove files not containing sermons from the larger dataset.

Evaluating data quality: The resulting database of congregations with sermons online differs from congregations nationwide in critical ways, and it is far smaller than the 478,699 institutions the Center initially found on Google Places. The Center first narrowed this initial set of institutions to only those that shared websites on Google Maps. Of those congregations, 38,630 were selected to have their websites searched for sermons, and of that sample, 6,431 made it into the final sermons dataset – meaning the scraper was able to successfully find and download sermons from their websites. Of these 6,431 churches in the final dataset, the Center was able to match 5,677 with variables derived from InfoGroup data, such as their religious tradition.

In order to properly contextualize these findings, researchers needed to evaluate the extent of these differences and determine the scraper’s effectiveness at finding sermons.

Researchers accomplished both tasks using waves of the National Congregations Study (NCS), a representative survey of U.S. religious congregations. To establish benchmarks describing U.S. congregations as a whole, the Center used the 2012 wave of the NCS, a representative survey of 1,331 U.S. congregations. Researchers also used unweighted preliminary data from the 2018-2019 NCS to confirm the quality of some variables, and to assess how effectively the scraper identified sermons. Because the 2018-2019 NCS data is preliminary and unweighted, it functions here as a rough quality check.

Finding every church on Google Maps

Visualization of how Pew Research Center searched each state for churches

To build a comprehensive database of U.S. churches, Center researchers designed an algorithm that exhaustively searched the Google Places API for every institution labelled as a church in the United States. At the time of searching, Google offered only search labels that hewed to specific groups, such as “church” or “Hindu temple.” As a result, researchers could not choose a more inclusive term, and ultimately used “church” to cover the lion’s share of religious congregations in the United States. Researchers used Google Places because the service provides websites for most of the institutions it labels as churches.

The program searched each state in the country independently. It began by choosing a point within the state’s area, querying the API for churches around that point, and then drawing a circle around those churches. The algorithm then marked off that circle as searched, began again with a new point outside the circle, and repeated this process until the entire state was covered in circles. Researchers dictated that results should be returned in order of distance, regardless of other factors like prominence. This means that for each query, researchers could deduce that there were no omittedresults closer to the center point of the query than the farthest result returned by the API.

In practice, researchers could have used the farthest result to draw the coverage areas, but often used a closer one in an effort to be conservative.11 The algorithm relied on geographic representations of each state – called “shapefiles” – that are publicly available from the U.S. Census Bureau.

Researchers used a previous version of this algorithm in fall 2015 to collect an early version of the database. The early version of the algorithm was less precise than the version used in 2018, but it compensated for that imprecision by plastering each area – in that case counties, not states – with dramatically more searches than were needed. The 2015 data collection yielded 354,673 institutions, while the 2018 collection yielded 385,675. Researchers aggregated these two databases for this study, counting congregations that shared the same unique identifier only once. Excluding these duplicates, the aggregated database included 478,699 institutions.

Determining religious tradition, size and predominant race or ethnicity

This initial search process produced a comprehensive list of institutions labeled as churches on Google Places. But the resulting database contained almost no other information about these institutions – such as their denomination, size or predominant race or ethnicity. To acquire these variables, Center data scientists attempted to find each church listed in Google Places in an outside database of 539,778 congregations maintained by InfoGroup, a targeted marketing firm.

Researchers could not conduct this operation by simply looking for congregations in each database that shared the same name, address or phone number, because congregations may have names with ambiguous spellings or may change their addresses or phone numbers over time. A simple merging operation would fail to identify these “fuzzy” matches. To account for this ambiguity, human coders manually matched 1,654 churches from the Center’s database to InfoGroup’s, and researchers trained a statistical model to emulate that matching process on the remainder of the database.

The matching involved multiple stages:

1. Limiting the number of options coders could examine: As a practical matter, coders could not compare every church in the Center’s database to every church in InfoGroup’s. To reduce the number of options presented to each coder, researchers devised a set of rules that delineated what congregations in the InfoGroup database could plausibly be a match for any given record in the Center’s collection. This process is known as “blocking.”

For any given church in the Center’s database, the blocking narrowed the number of plausible matches from InfoGroup’s database to only those that shared the same postal prefix (a stand-in for region). Next, researchers constructed an index of similarity between each church in the Center’s database and each plausible match in the InfoGroup database. The index consisted of three summed variables, each normalized to a 0-1 range. The variables were:

a. The distance in kilometers between churches’ GPS coordinates.

b. The similarity of their names, using the Jaro distance.

c. The similarity of their addresses, using the Jaro-Winkler distance.

These three variables were then summed, and coders examined the 15 options with the greatest similarity values (unless two churches shared the same phone number and postal prefix, in which case they were always presented to the coders as an option regardless of their similarity value). In the rare event that there were fewer than 15 churches in a postal prefix area, coders were presented all churches in that postal area.

2. Manually choosing the correct match for a sample of churches: A group of five coders then attempted to match a sample of 2,900 congregations from the Center’s database to InfoGroup’s. In 191 cases where coders were unsure of a match, an expert from the Center’s religion team adjudicated. Overall, coders successfully matched 1,654 churches. Researchers also selected a sample of 100 churches to be matched by every coder, which researchers used to calculate inter-rater reliability scores. The overall Krippendorf’s alpha between all five coders was .85, and the individual coders’ alpha scores – each judged against the remaining four and averaged – ranged from 0.82 to 0.87.

3. Machine learning and automated matching: As noted above, this process generated 1,654 matches between the two datasets. It also generated 41,842 non-matches (each option that the coders did not choose was considered a non-match). Center researchers used these examples to train a statistical model – a random forest classifier in Python’s SciKit-Learn – that was then used to match the remaining churches in the collection.

Researchers engineered the model to have equal rates of precision (the share of items identified as a match that were truly matches) and recall (the share of true matches that were correctly identified as such). This means that even while there was an error rate, the model neither overestimated nor underestimated the true rate of overlap between the databases. The model’s average fivefold cross-validated precision and recall were 91%, and its accuracy (the share of all predictions that were correct) was 99%.

To apply the model to the remaining data, researchers had to replicate the blocking procedure for all 478,699 churches in the Center’s database, presenting the model with a comparable number of options to those seen by the coders. Researchers also calculated several other variables (that coders did not have access to), which the model might find to be of statistical value.

The model’s features (variables) were: the distance between each pair of churches (that is, the distance between the Center’s database and each of the 15 possible congregations); the rankeddistance between each pair (whether each was the closest option, the second closest, etc.); the similarity of their names using the Jaro distance; the similarity of their addresses using the Jaro-Winkler distance; a variable denoting whether they shared the same phone number; and one variable each for the most commonly appearing words from church names in Pew Research Center’s database, denoting the cumulative number of times each word appeared across both names.

Pew Research Center data scientists applied this model to each church in the Center’s database, successfully identifying a match for 262,876 in the InfoGroup database. For each matched church, researchers merged the congregation’s denomination, predominant race or ethnicity, and number of members into the database, where these variables were available.

Once the Center merged these variables into the database, researchers categorized InfoGroup’s religious groups into one of 14 groups: evangelical Protestant, mainline Protestant, historically black Protestant, Catholic, Orthodox Christian, Mormon (including the Church of Jesus Christ of Latter-day Saints), Jehovah’s Witness, other Christian, Jewish, Muslim, Hindu, Buddhist, other faiths and unclassifiable.

Protestant congregations with identifiable denominations were placed into one of three traditions – the evangelical tradition, the mainline tradition or the historically black Protestant tradition. For instance, all congregations flagged as affiliated with the Southern Baptist Convention were categorized as evangelical Protestant churches. All congregations flagged as affiliated with the United Methodist Church were categorized as mainline Protestant churches. And all congregations flagged as affiliated with the African Methodist Episcopal Church were categorized as churches in the historically black Protestant tradition.

In some cases, information about a congregation’s denominational affiliation was insufficient for categorization. For example, some congregations were flagged simply as “Baptist – other” (rather than “Southern Baptist Convention” or “American Baptist Churches, USA”) or “Methodist – other” (rather than “United Methodist” or “African Methodist Episcopal”).

In those instances, congregations were placed into categories in two ways. First, congregations were categorized based on the Protestant tradition that most group members identify with. Since most Methodists are part of mainline Protestant churches, a Methodist denomination with an ambiguous affiliation was coded into the mainline Protestant category. Second, if the congregation was flagged by InfoGroup as having a mostly African American membership (and the congregation was affiliated with a family of denominations – for example, Baptist, Methodist or Pentecostal – with a sizeable number of historically black Protestant churches) the denomination was categorized in the historically black Protestant group.

For example, congregations flagged simply as “Baptist – other” were coded as evangelical Protestant congregations (since most U.S. adults who identify as Baptist are affiliated with evangelical denominations, according to the 2014 U.S. Religious Landscape Study), unless the congregation was flagged as having a mostly African American membership, in which case it was placed in the historically black Protestant tradition. Similarly, congregations flagged simply as “Methodist – other” were coded as mainline congregations (since most U.S. adults who identify as Methodist are affiliated with mainline Protestant denominations), unless the congregation was flagged as having a mostly African American membership, in which case it was placed in the historically black Protestant tradition.

Complete details about how denominations were grouped into traditions are provided in the appendix to this report.

Identifying and collecting sermons from church websites

Although the database now contained a list of church websites along with data about the characteristics of each congregation, the Center was faced with the challenge of identifying and collecting the sermons posted by these churches online. Researchers designed a custom scraper – a piece of software – for this task. The scraper was designed to navigate church websites in search of files that appeared to be sermons, download them to a central database and transcribe them from audio to text if needed.

Sampling and weighting

Rather than scrape every church website in the database – which would have taken a great deal of time while offering few statistical benefits – Center researchers scraped the websites of two separate sets of churches: 1) each of the 770 congregations that were newly nominated to the 2018-2019 NCS, were found in Pew Research Center’s database andhad a website; and 2) a sample of the entire database.

The sample was drawn to ensure adequate representation of each major Christian tradition, as well as congregations that did not match to InfoGroup, for which the Center did not have a tradition or denomination. The Center assigned each record in the database to one of seven strata. The strata were:

  • Catholic
  • Historically black Protestant
  • Mainline Protestant
  • Evangelical Protestant
  • Unclassifiable due to limitations with available data.
  • Not matched to InfoGroup
  • Other: a compound category, including Buddhist, Mormon, Jehovah’s Witness, Jewish, Muslim, Orthodox Christian, Hindu, other Christian or other faiths. (This category was not analyzed on its own, because the original search used only the term “church.”)

Researchers then drew a random sample of up to 6,500 records from each stratum. If a stratum contained fewer than 6,500 records, they were all included with certainty. Next, any other records in the database that had the same website as one of the sampled records were also drawn into the sample.

This pool of sampled records was then screened to distinguish between multi-site congregations that share a website and duplicative records, so that duplicative ones could be removed. This was done using the following procedure:

  • First, researchers removed churches that were found only in the first Google Maps collection (see Google Maps section for more details).
  • After that, any records with a website that appeared more than five times in the database were excluded on the grounds that these were likely to include denominational content, rather than that of individual congregations.
  • For any remaining records with matching websites, researchers took steps to identify and remove duplicate records that referred to the same actual congregation. Two records were considered to be duplicates if they shared a website and met any of the following criteria: 1. Both records were matched to the same congregation in the InfoGroup database. 2. Both records had the same street address or census block. 3. One of the two records lacked both a phone number and a building number in its address.

In any of these three instances, the record with the highest match similarity to InfoGroup (as measured by the certainty of the matching model) or, if none matched to InfoGroup, the most complete address information was retained. Congregations that shared a street-address but had different websites were not considered to be duplicates but rather distinct congregations that happened to meet in the same location.

The result was a sample of 38,630 distinct congregations distributed as follows: evangelical (6,649), Catholic (6,098), mainline (6,090), unclassifiable (5,985), unmatched (5,983), historically black Protestant (4,704), and an agglomerated “small groups” category (3,121). These congregations were then weighted to once more represent their prevalence in the database.

Because of the complex nature of the sampling and deduplication process, it was not possible to weight the sample based on each case’s probability of selection. Instead, weights were created using a linear calibration procedure from the R survey package. The weights were computed so that after weighting, the total number of unique churches in each stratum in the sample was proportional to the number of unique churches in that stratum in the original database. Additionally, the weights were constrained so that the total number of records associated with churches in each stratum was proportional to the total number of records associated with churches in the corresponding stratum in the entire database. This was done by weighting each church according to the number of records per unique church with the same URL. This was done so that churches that were associated with multiple records in the database (and consequently, those that had a higher probability of being selected) were not overrepresented in the weighted sample.

Any statements pertaining to all congregations in the analysis have a margin of error of 1.5 percentage points at a 95% confidence level. The 95% confidence interval for the share of all sermons that reference the Old Testament runs from 60% to 62%, around a population mean of 61%. And the 95% confidence interval for the share of all sermons that reference the New Testament runs from 89% to 90%, with a population mean of 90%.

It is important to note that the estimates in this report are intended to generalize only to the population of churches with websites that were in the original database, and not the entire population of all Christian churches in the United States (which also includes churches that do not have a website or were not listed in Google Maps at the time the database was constructed).

Weighted and unweighted makeup of congregations and sermons from each religious tradition

How the scraper worked

Number of cases at each stage of data collection

Researchers made some early decisions about how the scraper should identify sermons:

  1. Every sermon, by definition, had to be associated with a date on the website where it was found. This date was interpreted as its delivery date, an interpretation that generally held true.
  2. Sermons had to be either a) hosted on the church’s website, or b) shared through a service, such as YouTube, that was directly linked from that church’s website. This was to ensure that we did not incorrectly assign a sermon to a church where it was not delivered.
  3. A sermon had to be hosted in a digital media file, rather than written directly into the contents of a webpage. This is because the scraper had no way of determining whether text written into a webpage was or was not a sermon. These files could consist of audio (such as an .mp3 file), text (such as a .pdf) or video (such as a YouTube link).

Identifying sermons involved two main steps: determining which pages to scrape, and then finding media files linked near dates on those pages. These files – digital media files, displayed near dates, on pages likely to contain sermons – were then transcribed to text if needed, and non-sermons were removed.

How we trained a model to identify pages with sermons

To identify pages likely to contain sermons, researchers trained a machine learning classifier – a linear support vector machine – on pages identified by coders as having sermons on them. In September 2018, coders examined a sample of church websites and identified any links that contained sermons dated between July 8 and Sept. 1, 2018. Coders also examined a random sample of links from these same websites and flagged whether the links contained any sermons; most of them did not. Taken together, a set of 906 links was compiled from 318 different church websites, 412 of which were determined to contain sermons and 494 that did not. Using these links, a classifier was trained on the text of each link, along with any text that was associated with the links for those that had been identified by the scraper. Researchers stripped all references to months out of the text for each link before training the model, so it would not develop a bias towards pages containing the words “July,” “August” or “September.”

The model correctly identified pages with sermons with 0.86 accuracy, 0.86 precision (the share of cases identified as positive that were correct), and 0.83 recall (the share of positive cases correctly identified). Researchers calculated these statistics using a grouped fivefold cross validation, where links from the same church were not included in both the test and training sets simultaneously.

Determining which pages to examine

To ensure the scraper navigated to the correct pages, researchers trained a machine learning model that estimated how likely a page was to contain sermons. The model relied on the text in and around a page’s URL to make its estimate. In addition to the model – which produced a binary, yes or no output – the scraper also looked on church webpages for key words specified by researchers, such as “sermon” or “homily.”

Based on a combination of the model’s output and the key word searches, pages were assigned a priority ranging from zero to four. The scraper generally examined every page with a priority above zero, and mostly did so in order of priority.

Finding dated media files on pages flagged for further examination

Once the scraper determined that a page was at least somewhat likely to contain sermons, it visited that page and examined its contents in detail in search of files matching the search criteria described above. In some cases, sermons were housed in a protocol such as RSS – a common means of presenting podcasts – that is designed to feed media files directly to computer programs. In those cases, the sermons were extracted directly, with little room for error. The same was true for sermons posted directly to YouTube or Vimeo accounts.

But in most cases, sermons were embedded or linked directly within the contents of a page. Although these sermons might be easy for humans to identify, they were not designed to be found by a computer. The scraper used three main methods to extract these sermons:

1. Using the page’s structure: Webpages are mostly written in HTML, a language that denotes a page’s structure and presentation. Pages written with HTML have a clearly denoted hierarchy, in which elements of the page – such as paragraphs, lines or links – are either adjacent to or nested within one another. An element may be next to another element – such as two paragraphs in a block of text – and each also may have elements nested inside them, like pictures or lines.

The scraper searched for sermons by examining every element of the page to determine if it contained a single human-readable date in a common date format, as well as a single media file.12

2. Using the locations of dates or media files: In the event that the scraper could not identify a single element with one date and one media file, it resorted to a more creative solution: finding every date and every media file on the page and clustering them together based on their locations on a simulated computer screen.

In this solution, the scraper scanned the entire page for any media files – using a slightly more restrictive set of search terms – and any portions of text that constituted a date.13 The scraper then calculated each element’s x and y coordinates, using screen pixels as units. Finally, each media file was assigned to its closest date using their Euclidean distance, except in cases where a date was found in the URL for the page or media file itself, in which case that date was assumed to be the correct one.

3. Using only the text of the media files: Finally, the scraper also scanned the page for any media files that contained a readable date in the text of their URLs. These were directly saved as sermons.

The scraper used a small number of other algorithms to find sermons. These were tailored to very specific sermon-sharing formats that appeared to be designed by private web developers. These formats were rare, accounting for just 2.8% of all media files found.

In addition to the above rules that guided the scraper, researchers also placed some restrictions on the program. These were designed to ensure that it did not endlessly scrape extremely large websites or search irrelevant parts of the internet:

  • Researchers did not allow the scraper to examine more than five pages from a website other than the one it was sent to search. This rule allowed for limited cases where a church may link to an outside website that hosted its sermons, but prevented the scraper from wandering too far afield from the website in question and potentially collecting irrelevant data.
  • There were three cases in which the scraper stopped scraping a website before it had examined all of the pages with priorities above zero: 1) if it had examined more than 100 pages since finding any sermons; 2) if it had been scraping the same website for more than 10 hours, or 3) if the scraper encountered more than 50 timeout errors.
  • Some pages were explicitly excluded from being examined. These mainly included links to common social media sites such as Twitter, links to the home page of an external website, or media files themselves, such as .mp3 files.
  • The scraper always waited between two and seven seconds between downloading pages from the same website to ensure scraping did not overburden the website.

Finally, the scraper removed duplicative files (those found by multiple methods), as well as those whose dates fell outside the study period (April 7-June 1, 2019).

Validation and cleaning of scraped files

Researchers conducted a number of steps at various stages of the data collection to clean and validate the scraped files, and to convert them to a machine-readable format that could be used in the subsequent analysis. These steps are described in more detail below.

Removing non-sermons from the collected list of media files

Although the initial scraping process collected dated media files from pages likely to contain sermons, there was no guarantee that these files actually contained sermons. To address this problem, researchers tasked a team of human coders with examining 530 transcribed files that were randomly sampled from the database to determine whether they contained sermons. Researchers then trained an extreme gradient boosting model (using the XGBoost package in Python) machine learning model on the results and used that model to remove non-sermons from the remainder of the database. The model achieved 90% accuracy, 92% recall and 93% precision.

In classifying the files used to train the machine learning model, coders were instructed to consider as a sermon any religious lesson, message or teaching delivered by anyone who appears to be acting as a religious leader, to an apparently live audience, in an institution that is at least acting as a religious congregation. They were instructed to not include anything that was clearly marked as something other than a sermon (such as a baptism video, Sunday school lesson or religious concert). They also were instructed to exclude internet-only sermons or radio-only sermons, although sermons meeting the initial criteria but repackaged as a podcast or other form of media would count. Sermons with specific audiences (such as a youth sermon) were classified as sermons.

In determining who qualified as a religious leader, coders could not use the age, gender or race of the speaker, even if there was a reasonable justification for doing so (for instance, a white pastor in a historically black Protestant denomination). Coders were instructed to classify any files that included a sermon along with any other content (such as a song, prayer or reading) as a sermon.

Downloading and transcription

The sermons in the collection varied dramatically in their formatting, audio quality and complexity. Some were complete with podcast-style metadata, while others were uploaded in their raw format. The downloading system attempted to account for this variability by fixing common typographical errors, working around platform-specific formatting or obfuscation and filling in missing file extensions using other parts of the URL or response headers where possible. Any sermon for which the encoding could be read or guessed was then saved.

Once retrieved, PDFs and other text documents were converted to transcripts with minimal processing using open-source libraries. Multimedia sermons were processed using the FFmpeg multimedia framework to create clean, uniform input for transcription. Video sermons occasionally included subtitles or even different audio streams. When multiple audio streams were available, only the primary English stream was extracted; when an English or unlabeled subtitle stream was available, the first such stream was stored as a distinct type of transcript, but the audio was otherwise handled similarly.

Before transcription could be performed, the extracted media files were normalized to meet the requirements of the transcription service, Amazon Web Service’s Amazon Transcribe, which imposed constraints on file encoding, size and length. Researchers transcoded all files into the lossless FLAC format and split them into chunks if the file exceeded the service’s duration limit. Amazon Transcribe then returned complex transcripts, including markup that defines each distinct word recognized, the timestamps of the start and end of the word, and the level of confidence in the recognized word.

Evaluating data quality

Researchers used an outside survey of U.S. religious congregations – the 2018-2019 National Congregations Study (NCS) – to generate approximate answers to two questions: 1) How effectively did the scraper identify and download sermons from church websites and 2) How accurate were the variables obtained from InfoGroup, the targeted marketing firm?14

Beginning with the 1,025 churches that were newly nominated to the 2018-2019 wave of the NCS, researchers first attempted to identify each in the Google Places database, successfully finding 879 (86%). These matched congregations were then used to provide approximate answers to both questions. They are also limited, however, because the NCS’s 2018-2019 wave, at time of writing, had not yet obtained the adjustment variables (weights) needed to create population-wide estimates. As a result, the answers to both of these questions rely on unweighted statistics, and should be interpreted as quality checks, rather than statistical tests.15

Evaluating the scraper’s performance

In order to evaluate the scraper’s performance, Center researchers manually examined the websites of every congregation in the database that also appeared in the National Congregations Study’s sample. Each website was assigned a randomly chosen one-week window within the study period, and researchers identified all sermons within that week. The scraper was then deployed to these same websites, and researchers determined whether it had found each sermon identified by researchers.

Of the 385 sermons found by researchers on these NCS church websites, the scraper correctly identified 212 – of which 194 downloaded and transcribed correctly. This means the system as a whole correctly identified, downloaded and transcribed 50% of all sermons shared on the websites of churches that were nominated to the 2018-2019 NCS. The scraper was determined to have identified the correct delivery date in 75% of cases where it found a sermon, and it was correct within a margin of seven days in 88% of cases.

The Center does not view these performance statistics as validating or invalidating the contents of the research. Rather, they are intended to help the reader understand the nature of this limited but interesting window into American religious discourse.

Evaluating the accuracy of congregation-level variables

Researchers also evaluated the quality of the family, denomination, predominant race or ethnicity and size variables using the linked NCS dataset using the subset of 639 congregations that were newly nominated to the 2018-2019 NCS, were found in Pew Research Center’s database and participated in the 2018-2019 NCS.

Comparison of estimated congregation size to National Congregations Study

Generally speaking, the National Congregations Study’s grouping of religious families aligned with the equivalent variables in the Center’s database. For instance, of the 124 NCS respondent congregations that indicated they were Baptist churches, 95 (76%) were correctly identified as Baptist in the Center’s database, while the Center lacked a religious family variable for 24 (19%). Of the 155 congregations identified as Catholic in the matched NCS data, 136 (88%) were correctly identified in the Center’s database, while 18 (12%) lacked the relevant variable. In other words, most of the congregations in these categories either were correctly identified or lacked the variables in question. Very few were incorrectly identified.

Variables denoting a congregation’s approximate size also roughly corresponded with data from the National Congregations Study, although the two surveys measure membership size with different questions. The Center’s measure of membership size, which speaks to the number of “members” a congregation has, was obtained from InfoGroup (the targeted marketing firm) and includes some imputed data. The NCS’s most directly comparable variable measures the “number of regularly participating adults” that a congregation reports.

The race variable used in this analysis corresponded with the NCS data in most cases where the Center’s data indicated a predominantly African American congregation. However, the Center’s race variable also failed to capture a large share of such congregations in the NCS data. Of the 92 congregations that reported to the NCS that more than 50% of their congregants were African American, only 24 (26%) were identified as predominantly African American in InfoGroup’s data. The other 66 (72% of the total) had no race information available.

Comparing the composition of the Center’s database of churches to national estimates

Churches in the Center’s database are larger, more heavily urban, relative to all U.S. churches

Based on a side-by-side comparison with the results of the 2012 NCS, congregations in the Center’s database are larger than those nationwide: Half (50%) of all churches in the sermons database had more than 200 members, compared with 34% of all congregations nationwide.16

They are also more likely to be located in urban areas than congregations nationwide. Fully 68% of congregations in the sermons database are located in census tracts that the National Congregations Study labelled urban in 2012, compared with 51% of all congregations nationwide.