
Pew Research Center

FOR RELEASE DECEMBER 17, 2018

Gender and Jobs in Online Image Searches

Men are overrepresented in online image search results across a majority of jobs examined; women appear lower than men in such search results for many jobs

BY Onyi Lam, Brian Broderick, Stefan Wojcik and Adam Hughes

FOR MEDIA OR OTHER INQUIRIES:

Communications Department
202.419.4372
www.pewresearch.org

RECOMMENDED CITATION

Pew Research Center, December 2018, "Gender and Jobs in Online Image Searches"

About Pew Research Center

Pew Research Center is a nonpartisan, nonadvocacy fact tank that informs the public about the issues, attitudes and trends shaping the world. It does not take policy positions. The Center conducts public opinion polling, demographic research, computational social science research and other data-driven research. It studies politics and policy; news habits and media; the internet and technology; religion; race and ethnicity; international affairs; social, demographic and economic trends; science; research methodology and data science; and immigration and migration. Pew Research Center is a subsidiary of The Pew Charitable Trusts, its primary funder.

© Pew Research Center 2026

Table of contents

  • About Pew Research Center
  • Gender and Jobs in Online Image Searches
  • Acknowledgments
  • Methodology

Gender and Jobs in Online Image Searches

Men are overrepresented in online image search results across a majority of jobs examined; women appear lower than men in such search results for many jobs

The percentage of women in image search results for common jobs often differs from reality

Online media organizations, social media sites and individuals add vast quantities of images to the web each day. These images can then appear in search engines as users look for pictures representing common phrases or topics. Because the way that men and women are represented in these online search results might be connected to the way people understand gender and society, some academic researchers have specifically focused on the ways women and men are depicted in the workplace in online images.

A new Pew Research Center study extends this line of research by using a computational method – machine vision to analyze a broad sample of images from Google Image Search that depict men and women working common jobs, and then comparing those results with real-world data about the gender composition of the U.S. workforce. The study finds that the share of each gender pictured varies widely across the spectrum of careers tested. But in the majority of jobs examined, women are somewhat underrepresented in online images relative to their actual participation rates in those jobs in the United States, based on 2017 Bureau of Labor Statistics data. Across all individuals shown in the search results, men appear 60% of the time. And, when women appear, they appear lower in the search results than men.

To conduct this analysis, Pew Research Center analyzed over 10,000 images appearing in U.S.-based, English-language search results for 105 common occupations.1 The jobs analyzed in the study include everyday occupations such as hair stylist, librarian, butcher and plumber, among many others. Researchers used a machine vision algorithm to estimate whether each person appearing in a given image was male or female. Next, they calculated the estimated percentages of men and women depicted in the top 100 Google Image Search results for each of those jobs to assess whether the results reflected the actual percentages in each occupation who are men and women.

Key findings of the analysis include:

  • Image results for common job searches somewhat overrepresent men relative to women. Across the sample of image searches for 105 jobs, an estimated 60% of the individuals that appeared in the image results were men (40% were women). According to Bureau of Labor Statistics (BLS) data, men made up 54% of all individuals employed in these jobs.
  • For more than half the tested job categories, images appearing in searches underrepresent women relative to their actual participation in those jobs, according to federal data. When compared with BLS data measuring the actual share of each profession’s workforce that is male and female, women were underrepresented in search results for 57% of the 105 jobs we analyzed. They were overrepresented in 42%.2
  • The underrepresentation of women was concentrated in a few jobs. Across the 10 jobs where women were the most underrepresented in image searches, the average rate they appeared was 33 percentage points lower than the actual rate at which they held those jobs. Across the other 50 jobs where women were underrepresented, the average rate they appeared was just 12 points lower than their real labor force participation rate.
  • Images containing women appear further down the page in search results for many jobs. Images depicting women engaged in jobs tended to appear lower in search results compared with men, no matter their actual share in the labor force. On average, the first image containing a woman appeared about four images from the first result, while on average the first image containing a man appeared two images from the top.
  • Image search results display more gender diversity than actually exists, on average. According to the BLS, 38% of jobs in the study are predominantly held by either men or women (defined as jobs with 80% or more male or female workers). However, across image searches for all jobs, only 21% showed predominantly men or women.
What determines which images are returned in an online search?

When internet users search for images, a complex mix of factors affects what they see. Content searchers and content creators alike can influence which images draw the most attention. But researchers do not have direct access to the underlying image selection process, nor do we know how much any one factor matters when a search algorithm decides what images to select. Search algorithms are often designed to highlight images that the algorithms “expect” will be most relevant for a particular user based on their search history or other browsing behavior. But image creators and other users also can act in ways that at least partially determine the rate at which certain images appear. Algorithms are capable of learning from both content consumers and content producers. So, for example, if content producers often use men to illustrate the term “chief executive,” algorithms might preserve or magnify these tendencies. At the same time, the ways that internet users click on particular images might make those images appear more relevant, and thus more likely to be selected by the algorithm. Since algorithms for image search are proprietary, the Center’s research team could not evaluate them directly in this analysis.
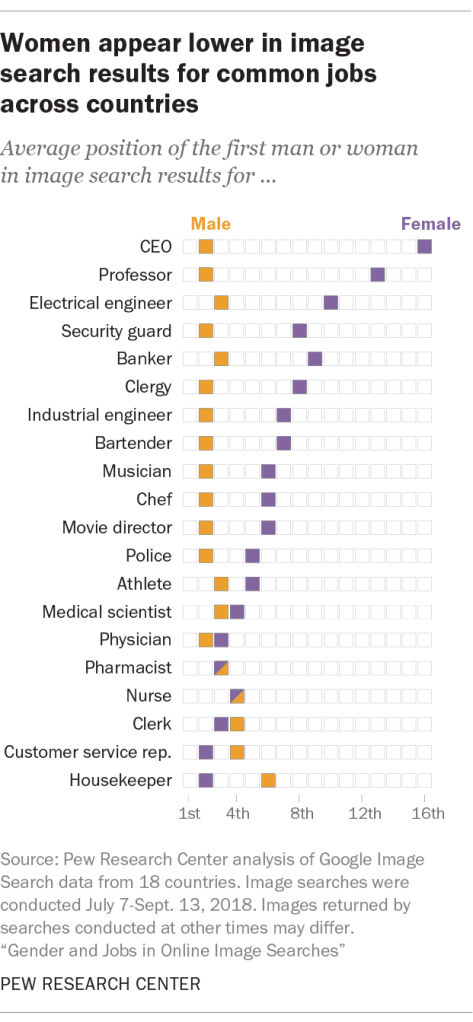
Women appear lower in image search results for common jobs across countries

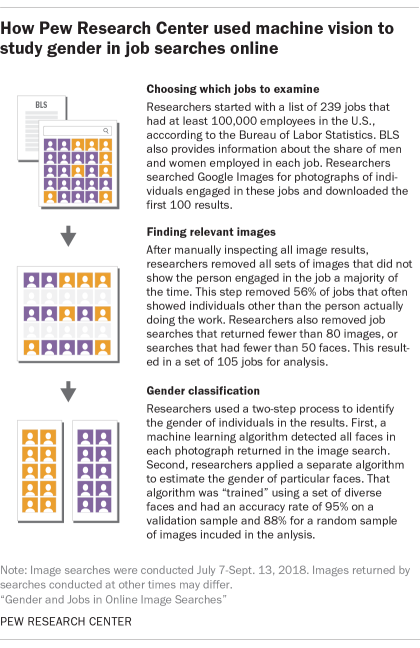
To ensure that the images analyzed in the study depicted people at work in the jobs being searched, researchers checked whether or not the images returned in search results actually showed individuals engaged in the particular occupation of interest. Many searches for jobs did not yield a majority of images actually depicting people working in those jobs. Researchers examined each set of images and found that 44% of image search terms from a broader list of initial occupations returned a majority of images that showed people engaged in the job – rather than other people or objects associated with the job. In other words, for just 106 of the initial list of 239 jobs did the majority of images associated with each job depict the relevant worker.
How Pew Research Center used machine vision to study gender in job searches online

The remaining 56% of searches returned images that did not reliably show a person associated with the searched occupation: Some showed clients or customers, rather than practitioners of the occupation, or depicted non-human objects. These images were not included in the analysis. For example, the majority of image results for the term “physical therapist” showed individuals receiving care rather than individuals engaging in the duties associated with being a physical therapist (see Methodology for additional details). Finally, researchers removed searches for jobs that returned fewer than 80 total images, resulting in an analysis sample of 105 sets of job-relevant images.

The image searches were conducted between July 7 and Sept. 13, 2018, and the specific images examined here may no longer appear. Images with multiple individuals were included in the analysis, and each individual was analyzed separately.

How researchers estimated gender using machine vision

To estimate the gender of individuals in images, this analysis relies on deep learning techniques from the field of computer vision, which focuses on algorithms that identify different objects in images. Researchers used a method called “transfer learning” to repurpose an existing algorithm to the task of recognizing male and female faces.

To train a machine learning system to “learn” the facial traits associated with male and female faces, researchers assembled a set of images that humans had identified as male or female. Previous research has found that image classification algorithms available through commercial vendors suffer from inconsistent accuracy across racial groups. Accurate gender classification across racial groups is especially important in this context because researchers also used the model to classify results across different countries and languages in a separate analysis. One limitation of the machine vision model used here is that it cannot identify nonbinary individuals, since the training data included only images labeled as male or female. In addition, the model’s estimate of gender is based on physical appearance, not how individuals actually identify.

The research team assembled a large and diverse set of images to train the model. Researchers used 26,981 labeled faces from different image sources to achieve a relatively balanced demographic sample from which to train the algorithm. This dataset included individuals from different countries and minority groups. The training images vary in size and image quality, which helped ensure that the classifier would work across many different kinds of images. The training images were also randomly rotated and clipped to maintain accuracy across photos in many orientations.

The gender classification model was trained with 80% of the human-labeled data, and then tested on the remaining 20% of those images. It achieved 95% accuracy on the set of images that were not used to train the model. The model’s performance was broadly consistent across different minority groups (see Methodology).

After researchers tested the model’s accuracy, they began applying it to search queries for particular kinds of jobs. Researchers imposed filtering criteria on the queries, in addition to checking whether the images showed individuals engaged in the job. First, researchers applied Google’s “photo” filter, which is meant to remove animated or computer-generated images from search results. Second, researchers removed all the job searches with fewer than 80 images overall, or with fewer than 50 images containing human faces in the results. See Methodology for additional details.

As a final validation step, researchers tested the model on a sample of actual Google Image Search results, as classified by human coders. Across a random sample of 996 images from those included in the analysis, the model had an 88% accuracy rate. Although 1,000 images were randomly selected, four either had a dead link or were not coded by three coders.

Women are underrepresented in image searches across 57% of jobs

Across the 105 occupations included in the analysis, 40% of the individuals depicted across all search results were women. And for some kinds of jobs, that rate was much lower: Women appeared in search results for chief executive at a rate of 10%, and at a rate of 15% across results for general manager.

These results understate the degree to which women actually hold these jobs in the U.S. According to data from the Bureau of Labor Statistics, 28% of people employed as chief executives are women, as are 34% of those employed as general managers.3 Across all jobs, the rate at which women appear in image searches was 6 percentage points lower than the rate at which they actually hold those jobs.

For 16% of job searches (notwithstanding overall rates of representation, which include any degree of over- or underrepresentation), the results were relatively close to the actual share of women holding those jobs – that is, the results were within 5 percentage points of their actual share of the workforce in that occupation.

Women appear lower in image search results for most jobs

Even in jobs where women were only slightly over- or underrepresented, there are disparities in where images showing women appear within the search results. Researchers found that the average search position of an image depicting a woman tends to be lower in search results compared with images depicting a man. The higher the search position (1 being the highest, 100 the lowest), the earlier it appears in the set of images returned by Google Image Search (position is represented left to right, top to bottom). For this sample of jobs, the average image position of the first woman shown is 3.7, compared with 2.0 for the first man.

To use a concrete example, the image search for head cook (which slightly overrepresented women overall) showed the first woman in the fifth position, while a man appeared in the first position. For engineering technician (which underrepresented women by 5 percentage points), the first woman appeared in the 11th position, while the first man appeared in the first position.

The study also found that image searches for certain gender-dominant jobs had more gender diversity relative to the actual rate at which men and women held those jobs. Researchers classified a job as predominantly held by men or women if at least 80% of those employed in the occupation were either men or women. Overall, 38% of these 105 jobs are predominantly held by men or women, according to BLS data. But when it came to image results for the same 105 jobs, just 21% predominantly featured men or women, using the same 80% threshold. In other words, image results for some predominantly male or female jobs are more gender diverse than would be expected if they perfectly matched the actual rate at which men and women held those jobs.

Examples of image searches that predominantly depict men include general manager and announcer, while in fact these jobs are more often held by women: 34% of general managers are women, but only 15% of individuals in search results for that occupation are women. Similarly, 23% of announcers are women, but 12% of people in search results for “announcer” are women. But for jobs like plumber, machinist and truck driver, which are predominantly held by men, image results show women at rates of 9%, 11% and 15%, respectively. These rates are substantially higher than the actual number of women who work as plumbers (2%), machinists (5%) and truck drivers (6%).

Gendered depictions of some jobs are consistent across countries

A separate Pew Research Center analysis approximated job-related searches for 18 different countries: Argentina, Australia, Brazil, Canada, France, Germany, India, Indonesia, Italy, Japan, Mexico, Russia, Saudi Arabia, South Africa, South Korea, Turkey, the United Kingdom and the United States. These countries were selected because they are members of the Group of 20, and together, their economies account for 63% of the global economy.4

Researchers obtained translations of the top 100 occupations (according to U.S. employment figures) for each of 12 languages, using either the official language of each country or the most prevalent language (if there were multiple official languages). Next, the team restricted the list to occupations that had relevant search results across a wide set of country-language combinations, using the same criteria as the U.S. analysis. For languages with gendered terms for different jobs, researchers used the male form of occupation titles when that form was the generic way to reference people of unknown gender employed in that job. For example, in Spanish, “cocinero” is a generic reference to a chef and is the masculine form of the noun. See the Methodology  for additional details about the global analysis and translation process.5

Researchers set custom search parameters for each language and corresponding country, and then collected up to 100 images for each county-language combination.6 Overall, researchers queried a total of 30,236 images for 307 translated job titles across the 18 countries. Some key findings of this analysis include:

  • The association between gender and certain kinds of jobs is global. Jobs such as housekeeper, customer service representative and nurse had the highest estimated percentage of women across all languages, whereas CEO, clergy and professor had the lowest estimated percentage of women across languages, on average. Searches for nurses, for example, showed women 84% of the time in Japanese results and 80% of the time in English-language searches in the UK. Image searches for professor showed women 19% of the time for Hindi (India), compared with 22% for German (Germany).
  • Images that show women appeared lower in search results than images that show men. The first image that showed a woman in searches for CEO or professor averaged a position of about 16 and 13, respectively, across all country-language combinations, compared with an image position of about 2 for men in both jobs. For housekeeper and customer service representative, images that depict women appear earlier in the results than those that depict men.
  • A lack of real-world comparison data for occupations at the global level limits the conclusions we can make. Because researchers were not able to obtain parallel, real-world data about the percentages of men and women working in each job for all countries, it was not possible to conclude whether the image results overrepresent or underrepresent women in each occupation and country.
Some jobs show similar gender prevalence in image search results across languages


Acknowledgments

This report is a collaborative effort based on the input and analysis of the following individuals. Find related reports online at pewresearch.org.

Primary researchers

Onyi Lam, Computational Social Scientist Stefan Wojcik, Computational Social Scientist Brian Broderick, Data Science Engineer Adam Hughes, Computational Social Scientist

Research team

Emma Remy, Data Science Assistant Skye Toor, Data Science Assistant Patrick van Kessel, Senior Data Scientist Dennis Quinn, Data Science Analyst

Editorial and graphic design

Peter Bell, Design Director David Kent, Copy Editor

Communications and web publishing

Jessica Pumphrey, Communications Associate Rachel Weisel, Communications Manager Hannah Klein, Communications Associate Travis Mitchell, Digital Producer

In addition, the report benefited from feedback provided by the following Pew Research Center researchers: Claudia Deane, Lee Rainie, Ruth Igielnik, Laura Silver, Kim Parker, Juliana Horowitz, Paul Hitlin, Kat Devlin and Patrick Moynihan.

Methodology

To analyze image search results for various occupations, researchers completed a four-step process. First, they created a list of U.S. occupations based on Bureau of Labor Statistics (BLS) data. Second, they translated these occupation search terms into different languages. Third, the team collected data for both the U.S. and international analysis from Google Image Search and manually verified whether or not the image results were relevant to the occupations being analyzed. Finally, researchers deployed a machine vision algorithm to detect faces within photographs, and then estimate whether those faces belong to men or women. The aggregated results of those predictions are the primary data source for this report.

Constructing the occupation list

Because researchers wanted to compare the gender breakdown in image results to real-world gender splits in occupations, the team’s primary goal was to match the terms used in Google Image searches with the titles in BLS as closely as possible.

But the technical language of the BLS occupations sometimes led to questionable search results. For example, searches for “eligibility interviewers, government programs” returned images from a small number of specialized websites that actually used that specific phrase, biasing results toward those websites’ images. So, the research team decided to filter out highly technical terms, using Google Trends to assess relative search popularity, relative to a reference occupation (“childcare worker”).

The query selection process for the U.S. analysis involved the following steps:

  1. Start with the list of BLS job titles in 2017.
  2. Exclude occupations that do not have information about the fraction of women employed. For example, “credit analysts” did not have information about the fraction of women in that occupation.
  3. Filter out occupations that do not have at least 100,000 workers in the U.S.
  4. Remove all occupations with ambiguous job functions (“all other,” “Misc.”).
  5. Split all titles with composite job functions into individual job titles (For example, “models and demonstrators” to “models,” “demonstrators”).
  6. Change plural words to singular (“models” to “model”) to standardize across occupations.7
  7. Manually inspect the list to ensure that the occupations were comprehensible and likely to describe human workers. This involved removing terms that might not apply to humans (such as tester, sorter) based on the researchers’ review of Google results.
  8. Use Google Trends to remove unpopular or highly technical job titles. Highly technical job titles like “eligibility interviewers, government programs” are searched for less frequently than less technical titles, such as “lawyer.” Accordingly, researchers decided to remove technical terms in a systematic fashion by comparing the relative search intensity of each potential job title against that of a reasonably common job title.8 The research team compared the search intensity results for each occupation with the search intensity of “childcare worker” using U.S. search interest in 2017. Any terms with search intensity below “childcare worker” were removed from the list of job titles. The reference occupation “childcare worker” was selected after researchers manually inspected the relative search popularity of various job titles and decided that “childcare worker” was popular enough that using it as a benchmark would remove many highly technical search terms.

The global part of the analysis uses a different list of job titles meant to capture more general descriptions of the same occupations. The steps to create that list include:

  1. Start with the list of BLS job titles that had at least 100,000 people working in the occupation in the U.S.
  2. Remove all occupations with ambiguous job functions (“all other”, “Misc.”).
  3. Split all titles with composite job functions into individual job titles (For example, “models and demonstrators” to “models,” “demonstrators”).
  4. Change plural words to singular (“models” to “model”) to standardize across occupations.
  5. Manually inspect the list to ensure that the occupations were comprehensible and likely to describe human workers. This involved removing terms that might not apply to humans (such as tester, sorter) based on manual review of Google results.
  6. Replace technical job titles with more general ones when possible to simplify translations and better represent searches. For example, instead of searching for “postsecondary teacher,” the team searched for “professor,” and instead of “chief executive,” the team used “CEO.”
  7. Use Google Trends to filter unpopular job titles relative to a reference occupation (“childcare worker”), following the same procedure described above. Any terms with search intensity below the search intensity of the reference occupation were removed.
  8. Select the top 100 terms with the most popular search intensity in Google in the U.S. within the past year.
  9. Translate each job title and determine which form to use when multiple translations were available.

Translations

To conduct the international analysis, the research team chose to examine image results within a subset of G20 countries, which collectively account for 63% of the global economy. These countries include Argentina, Australia, Brazil, Canada, France, Germany, India, Indonesia, Italy, Japan, Mexico, Russia, Saudi Arabia, South Africa, South Korea, Turkey, the United Kingdom and the United States. The analysis excludes the European Union because some of its member states are included separately and China because Google is blocked in the country. Researchers used the official language of each country for each search (or the most popular language if there were multiple official languages), and worked with a translation service, cApStAn, to develop the specific search queries.

To approximate search results for each country, researchers adjusted Google’s country and language settings. For example, to search jobs in India, job titles were queried in the Hindi language with the country set to India. Several countries in the study share the same official language; for example, Argentina and Mexico both have Spanish as their official language. In these cases, researchers executed separate queries for each language and country combination. The languages used in the searches were: Modern Standard Arabic, English, French, German, Hindi, Indonesian, Italian, Japanese, Korean, Portuguese, Russian, Spanish and Turkish.

Many languages spoken in these countries have gender-specific words for each occupation term. For example, in German, adding “in” to the end of the word “musiker” (musician) gives a female connotation to the word. However, the word “musiker” may not exclusively imply “male musician,” and it is not the case that only male musicians can be referred to as “musiker.” In consultation with the translation team, researchers identified the gender form of each job that would be used when a person of unknown gender is referenced, and searched for those terms. The male version is the default choice for most languages and occupations, but the translation team recommended using the feminine form for some cases when it was more commonly used. For example, researchers searched for “nurse” in Italian using the feminine term “infermière” rather than the masculine “infirmier” on the advice of the translation team.

In addition, some titles do not have a directly equivalent title in another language. For example, the job term “compliance officer” does not have an Italian equivalent. Finally, the same translated term can refer to different occupations in some languages. As a result, not all languages have exactly 20 search terms. Jobs lacking an equivalent translation in a given language were excluded.

Data collection

To create the master dataset used for both analyses, researchers built a data pipeline to streamline image collection, facial recognition and extraction, and facial classification tasks. To ensure that a large number of images could be processed in a timely manner, the team set up a database and analysis environment on the Amazon Web Service (AWS) cloud, which enabled the use of graphics processing units (GPUs) for faster image processing. Building this pipeline also allowed the researchers to collect additional labeled training images relatively quickly, which they leveraged to increase the diversity of the training set in advance of classifying the image search results.

Search results can be affected by the timing of the queries: Some photos could be more relevant during the time the query is executed, and therefore have a higher rank in the search results compared with searches at other times.

There are a number of filters users can apply to the images returned by Google. Under “Tools,” for example, users can signal to Google Image Search that they would like to receive images of different types, including “Face,” “Photo” and “Clip Art,” among other options. Users can also filter images by size and usage rights. For this study, researchers collected images using both the “photo” and “face” filter settings, but the results presented in this report use the “photo” filter only. Researchers made this decision because the “photo” filter appeared to provide more diverse kinds of images than the “face” filter, while also excluding clip art and animated representations of jobs.

Removing irrelevant queries

For occupations included across both the U.S. and international analysis term lists, some queries returned images that did not depict individuals engaged in the occupation being examined. Instead, they often returned images that showed clients or customers, rather than practitioners of the occupation, or depicted non-human objects. For example, the majority of image results for the term “physical therapist” showed individuals receiving care rather than individuals engaging in the duties associated with being a physical therapist.

To ensure the relevance of detected faces, researchers reviewed all of the collected images for each language, country and occupation combination. For the U.S. analysis, there were a total of 239 sets of images to review. For the international analysis, there were 1,800 sets of images to review. Queries were categorized into one of four categories based on the contents of the collected images.

  • “Pass”: More than half of collected images depict only individuals employed in the queried occupation. Overall, 44% of jobs in the U.S. analysis and 43% of jobs in the global analysis fell into this category.
  • “Fail”: The majority of collected images do not depict any face or depict faces irrelevant to the desired occupation. In many languages, the majority of collected images for the occupation “barber” depict only people who have been to a barber, rather than the actual barber. In the analysis of international search results, this includes queries that return images of an occupation different from that initially defined by the English translation. For example, the Arabic translation of “janitor” returns images of soccer goalies when queried in Saudi Arabia. Because the faces depicted in these images are not representative of the desired occupation, we categorize these queries as “fail.” A total of 31% of jobs in the U.S. analysis and 37% of jobs in the global analysis fell into this category.
  • “Complicated”: The majority of collected images depict multiple people, some of whom are engaged in the queried occupation and some of whom are not. For example, the term “preschool teacher” and its translations often return images that feature not only a teacher but also students. These queries are categorized as “complicated” because of the difficulty in isolating the relevant faces. A total of 23% of jobs in the U.S. analysis and 17% of jobs in the global analysis fell into this category.
  • “Ambiguous”: Some queries do not fall into the other categories, as there is no clear majority of image type or it is unclear whether the people depicted in the collected images are engaged in the occupation of interest. This may occur if the term has many definitions, such as “trainer,” which can refer to a person who trains athletes or various training equipment, or if the term has other usage in popular culture, such as the surname of a public figure (“baker”) or the name of a popular movie (“taxi driver”). Just 2% of jobs in the U.S. analysis and 3% of jobs in the global analysis fell into this category.

To minimize any error caused by irrelevance of detected faces in collected images, we remove all queries categorized as “fail,” “complicated” or “ambiguous” and only retain those queries categorized as “pass.”

Machine vision for gender classification

Researchers used a method called “transfer learning” to train a gender classifier, rather than using machine vision methods developed by an outside vendor. In some commercial and noncommercial alternative classifiers, “multitask” learning methods are used to simultaneously perform face detection, landmark localization, pose estimation, gender recognition and other face analysis tasks. The research team’s classifier achieved high accuracy for the gender classification task, while allowing the research team to monitor a variety of important performance metrics.

Face detection

Researchers used the face detector from the Python library dlib to identify all faces in the image. The program identifies four coordinates of the face: top, right, bottom and left (in pixels). This system achieves 99.4% accuracy on the popular Labeled Faces in the Wild dataset. The research team cropped the faces from the images and stored them as separate files.

Many images collected do not contain any individuals at all. For example, all images returned by Google for the German word “Barmixer” are images of a cocktail shaker product, even with the country search parameter set to Germany. To avoid drawing inference based on a small number of images, researchers included only queries that have at least 80 images downloaded and 50 images with at least one face detected in the analysis. Across different countries, the number of faces detected in the images varied. Hindi and Indonesian had the most detected faces. This means that their images tend to feature more people in them than other languages.

The table below summarizes the number of queries, number of images and number of faces detected. Overall, researchers were able to collect over 95% of the top 100 images that we sought to download.

Training the model

Image search data by country-language

Recently, research has provided evidence of algorithmic bias in image classification systems from a variety of high-profile vendors.9 This problem is believed to stem from imbalanced training data that often overrepresents white men. For this analysis, researchers decided to train a new gender classification model using a more balanced image training set.

However, training an image classifier is a daunting task because collecting a large labeled dataset for training is very time and labor intensive, and often is too computationally intensive to actually execute. To avoid these challenges, the research team relied on a technique called “transfer learning,” which involves recycling large pretrained neural networks (a popular class of machine learning models) for more specific classification tasks. The key innovation of this technique is that lower layers of the pretrained neural networks often contain features that are useful across different image classification tasks. Researchers can reuse these pretrained lower layers and fine-tune the top layers for their specific application – in this case, the gender classification task.

The specific pretrained network researchers used is VGG16, implemented in the popular deep learning Python package Keras. The VGG network architecture was introduced by Karen Simonyan and Andrew Zisserman in their 2014 paper “Very Deep Convolutional Networks for Large Scale Image Recognition.” The model is trained using ImageNet, which has over 1.2 million images and 1,000 object categories. Other common pretrained models include ResNet and Inception. VGG16 contains 16 weight layers that include several convolution and fully connected layers. The VGG16 network has achieved a 90% top-5 accuracy in ImageNet classification.10

Researchers began with the classic architecture of the VGG16 neural network as a base, then added one fully connected layer, one dropout layer and one output layer. The team conducted two rounds of training – one for the layers added for the gender classification task (the custom model), and subsequently one for the upper layers of the VGG base model.

Researchers froze the VGG base weights so that they could not be updated during the first round of training, and restricted training during this phase to the custom layers. This choice reflects the fact that weights for the new layers are randomly initialized, so if we allowed the VGG weights to be updated it would destroy the information contained within them. After 20 epochs of training on just the custom model, the team then unfroze four top layers of the VGG base and began a second round of training. For the second round of training, researchers implemented an early-stopping function. Early stopping checks the progress of the model loss (or error rate) during training, and halts training when validation loss value ceases to improve. This serves as both a timesaver and keeps the model from overfitting to the training data.

In order to prevent the model from overfitting to the training images, researchers randomly augmented each image during the training process. These random augmentations included rotations, shifting of the center of the image, zooming in/out, and shearing the image. As such, the model never saw the same image twice during training.

Selecting training images

Training datasets
Validation datasets

Image classification systems, even those that draw on pretrained models, require a substantial amount of training and validation data. These systems also demand diverse training samples if they are to be accurate across demographic groups. To ensure that the model was accurate when it came to classifying the gender of people from diverse backgrounds, researchers took a variety of steps. First, the team located existing datasets used by researchers for image analysis. These include the “Labeled Faces in the Wild” (LFW) and “Bainbridge 10K U.S. Adult Faces” datasets. Second, the team downloaded images of Brazilian politicians from a site that hosts municipal-level election results. Brazil is a racially diverse country, and that is reflected in the demographic diversity in its politicians. Third, researchers created original lists of celebrities who belong to different minority groups and collected 100 images for each individual. The list of minority celebrities focused on famous black and Asian individuals. The list of famous blacks includes 22 individuals: 11 men and 11 women. The list of famous Asians includes 30 individuals: 15 men and 15 women. Researchers then compiled a list of the most-populous 100 countries and downloaded up to 100 images of men and women for each nation-gender combination, respectively (for example, “French man”). This choice helped ensure that the training data included images that feature people from a diverse set of countries, balancing out the over-representativeness of white people in the training dataset. Finally, researchers supplemented this list with a set of 21 celebrity seniors (11 men and 10 women) to help improve model accuracy on older individuals. This allowed researchers to easily build up a demographically diverse dataset of faces with known gender and racial profiles.

Some images feature multiple people. To ensure that the images were directly relevant, a member of the research team reviewed each face manually and removed irrelevant or erroneous faces (e.g., men in images with women). Researchers also removed images that were too blurry, too small, and those where much of the face was obscured. In summary, the training data consist of 14,351 men and 12,630 women in images. The images belong to seven different datasets.

Model performance

To evaluate whether the model was accurate, researchers applied it to a subset equivalent to 20% of the image sources: a “held out” set which was not used for training purposes. The model achieved an overall accuracy of 95% on this set of validation data. The model was also accurate on particular subsets of the data, achieving 0.96 positive predictive value on the black celebrities subset, for example.

As a final validation exercise, researched used an online labor market to create a hand-coded random sample of 996 faces. This random subset of images overrepresented men – 665 of the images were classified as male. Each face was coded by three online workers. For the 924 faces that had consensus across the three coders, the overall accuracy of this sample is 88%. Using the value 1 for “male” and 0 for “female,” the precision and recall of the model were 0.93 and 0.90, respectively. This suggests that the model performs slightly worse for female faces, but that the rates of false positives and negatives was relatively low. Researchers found that many of the misclassified images were blurry, smaller in size, or obscured.

Model performance statistics
Comparison of BLS data and image search results

These results are also available in downloadable form here.