Pew Research Center

FOR RELEASE APRIL 9, 2018

Bots in the Twittersphere

An estimated two-thirds of tweeted links to popular websites are posted by automated accounts – not human beings

BY Stefan Wojcik, Solomon Messing, Aaron Smith, Lee Rainie and Paul Hitlin

FOR MEDIA OR OTHER INQUIRIES:

Communications Department
202.419.4372
www.pewresearch.org

RECOMMENDED CITATION

Pew Research Center, April 2018, "Bots in the Twittersphere"

About Pew Research Center

Pew Research Center is a nonpartisan, nonadvocacy fact tank that informs the public about the issues, attitudes and trends shaping the world. It does not take policy positions. The Center conducts public opinion polling, demographic research, computational social science research and other data-driven research. It studies politics and policy; news habits and media; the internet and technology; religion; race and ethnicity; international affairs; social, demographic and economic trends; science; research methodology and data science; and immigration and migration. Pew Research Center is a subsidiary of The Pew Charitable Trusts, its primary funder.

© Pew Research Center 2026

Table of contents

  • About Pew Research Center
  • Bots in the Twittersphere
  • Acknowledgments
  • Methodology

Bots in the Twittersphere

An estimated two-thirds of tweeted links to popular websites are posted by automated accounts – not human beings

CORRECTION (April 2018): In the original report, the words “liberals” and “conservatives” were reversed in one sentence. It has been corrected to read, “Suspected bots share roughly 41% of links to political sites shared primarily by liberals and 44% of links to political sites shared primarily by conservatives – a difference that is not statistically significant.” In another sentence, the word “conservatives” was mistakenly used in place of “liberals.” It has been corrected to read, “By contrast, automated accounts are estimated to share 41% of links to political sites with audiences comprised primarily of liberals, and 44% of those comprised primarily of conservatives.” These corrections do not change the conclusion that automated accounts in the study did not show evidence of a liberal or conservative “political bias” in their overall link-sharing behavior.

The word “substantially” was also removed from the following sentence: “Links associated with Twitter itself are shared by suspected bot accounts about 50% of the time – a substantially smaller share than the other primary categories of content analyzed.” The 50% figure is substantially smaller than only five of the six categories. This correction does not materially change the analysis of the report.

The role of so-called social media “bots” – automated accounts capable of posting content or interacting with other users with no direct human involvement – has been the subject of much scrutiny and attention in recent years. These accounts can play a valuable part in the social media ecosystem by answering questions about a variety of topics in real time or providing automated updates about news stories or events. At the same time, they can also be used to attempt to alter perceptions of political discourse on social media, spread misinformation, or manipulate online rating and review systems. As social media has attained an increasingly prominent position in the overall news and information environment, bots have been swept up in the broader debate over Americans’ changing news habits, the tenor of online discourse and the prevalence of “fake news” online.

In the context of these ongoing arguments over the role and nature of bots, Pew Research Center set out to better understand how many of the links being shared on Twitter – most of which refer to a site outside the platform itself – are being promoted by bots rather than humans. To do this, the Center used a list of 2,315 of the most popular websites1 and examined the roughly 1.2 million tweets (sent by English language users) that included links to those sites during a roughly six-week period in summer 2017. The results illustrate the pervasive role that automated accounts play in disseminating links to a wide range of prominent websites on Twitter.

How does this study define a Twitter bot?

Broadly speaking, Twitter bots are accounts that can post content or interact with other users in an automated way and without direct human input.

Bots are used for many purposes. This study focuses on a particular kind of bot behavior: bots that tweet or retweet links to content around the web. In other words, these are bots that post or promote specific websites or other online content.

Many bots do not identify themselves as bots, so this study uses a tool called Botometer to estimate the proportion of Twitter links to popular sites around the web that are posted by automated or partially automated accounts. One study suggests Botometer is about 86% accurate, and Pew Resesarch Center conducted its own independent validation tests of the Botometer system. To acknowledge the possibility of misclassification, we use the term “suspected bots” throughout this report. For details on how Botometer functions, see the methodology.

Among the key findings of this research:

  • Of all tweeted links2 3 to popular websites, 66% are shared by accounts with characteristics common among automated “bots,” rather than human users.
  • Among popular news and current event websites, 66% of tweeted links are made by suspected bots – identical to the overall average. The share of bot-created tweeted links is even higher among certain kinds of news sites. For example, an estimated 89% of tweeted links to popular aggregation sites that compile stories from around the web are posted by bots.
  • A relatively small number of highly active bots are responsible for a significant share of links to prominent news and media sites. This analysis finds that the 500 most-active suspected bot accounts are responsible for 22% of the tweeted links to popular news and current events sites over the period in which this study was conducted. By comparison, the 500 most-active human users are responsible for a much smaller share (an estimated 6%) of tweeted links to these outlets.
  • The study does not find evidence that automated accounts currently have a liberal or conservative “political bias” in their overall link-sharing behavior. This emerges from an analysis of the subset of news sites that contain politically oriented material. Suspected bots share roughly 41% of links to political sites shared primarily by liberals and 44% of links to political sites shared primarily by conservatives – a difference that is not statistically significant. By contrast, suspected bots share 57% to 66% of links from news and current events sites shared primarily by an ideologically mixed or centrist human audience.

Examples of Twitter bots in action

Bots can be used for a wide range of purposes. Here are some examples of bots that perform various tasks on Twitter:

  • Netflix Bot (@netflix_bot) automatically tweets when new content has been added to the online streaming service.
  • Grammar Police (@_grammar_) is a bot that identifies grammatically incorrect tweets and offers suggestions for correct usage
  • Museum Bot (@museumbot) posts random images from the Metropolitan Museum of Art
  • The CNN Breaking News Bot (@attention_cnn) is an unofficial account that sends an alert whenever CNN claims to have breaking news
  • The New York Times 4th Down Bot (@NYT4thDownBot) is a bot that provides live NFL analysis.
  • PowerPost by the Washington Post (@PowerPost) is a bot that provides news about decision-makers in Washington.

These findings are based on an analysis of a random sample of about 1.2 million tweets from English language users containing links to popular websites over the time period of July 27 to Sept. 11, 2017.4 To construct the list of popular sites used in this analysis, the Center identified nearly 3,000 of the most-shared websites during the first 18 days of the study period and coded them based on a variety of characteristics.5 After removing links that were dead, duplicated or directed to sites without sufficient information to classify their content, researchers arrived at a list of 2,315 websites.

First, these sites were categorized into six different topical groups based on their primary area of focus. The topical groupings included: adult content, sports, celebrity, commercial products or services, organizations or groups, and news and current events. For comparison with these primary categories, researchers put links that redirected to content within Twitter itself into a separate category.

Second, sites categorized as having a broad focus on news and current events (in total, 925 sites met this criteria) were subsequently coded based on three additional criteria:

  • Whether a majority of the site’s content consisted of aggregated or republished material produced by other sites or publications;
  • Whether the site included a politics section, and/or prominently featured political stories in its top headlines; and
  • Whether the site had a contact page (a trait that can serve as a proxy for whether a site offers readers the ability to submit comments and feedback).

Third, the Center identified an additional subset of news and current events sites that featured political stories or a politics section and that primarily serve a U.S. audience. Each of these politically oriented news and current events sites was then categorized as having primarily a liberal audience, a conservative audience or a mixed readership.6

The next step was to examine each tweeted link to those sites and attempt to determine if the link was posted from an automated account. To identify bots, the Center used a tool known as “Botometer,” developed by researchers at the University of Southern California and Indiana University. Now in its second incarnation, Botometer estimates the likelihood that any given account is automated or not based on a number of criteria, including the age of the account, how frequently it posts, and the characteristics of its follower network, among other factors. Accounts estimated as having a relatively high likelihood of being automated based on Pew Research Center’s tests of the Botometer system were classified as bots for the purposes of this analysis.7

Collectively, the data gathering, site coding and bot detection analysis described above provide an answer to the following key research question: What proportion of tweeted links to popular websites are posted by automated accounts, rather than by human users?

This research is part of a series of Pew Research Center reports examining the information environment on social media and the ways that users engage in these digital spaces. Previous studies have documented the nature and sources of tweets regarding immigration news, the ways in which news is shared via social media in a polarized Congress, the degree to which science information on social media is shared and trusted, the role of social media in the broader context of online harassment, how key social issues like race relations play out on these platforms, and the patterns of how different groups arrange themselves on Twitter.

It is important to note that bot accounts do not always clearly identify themselves as such in their profiles, and any bot classification system inevitably carries some risk of error. The Botometer system has been documented and validated in an array of academic publications, and researchers from the Center conducted a number of independent validation measures of its results.8 However, some human accounts may be misclassified as automated, while some automated accounts may be misclassified as genuine. There is therefore a degree of uncertainty in these estimates of the share of traffic by suspected bot accounts.

In addition, the analysis described in this report is based on a subset of tweets collected over a specific period of time. It is not an analysis of all websites or of all media properties, but rather an analysis of popular websites and media outlets as measured by the number of links posted on Twitter to their content. This analysis does not seek to evaluate whether these links were being shared by “good” or “bad” bots, or whether those bots are controlled from inside or outside the U.S. It also did not seek to assess the reach of the tweets in question or to determine how many human users saw, clicked through or otherwise engaged with bot-generated content.

Further details on our bot-classification effort can be found in the methodology of this report.

Automated account activity is prominent across the Twitter ecosystem

Automated accounts play a prominent role in tweeting out links to content across the Twitter ecosystem. The Center’s analysis finds that an estimated 66% of all tweeted links to the most popular websites are likely posted by automated accounts, rather than human users.

Certain types of sites – most notably those focused on adult content and sports – receive an especially large share of their Twitter links from automated accounts. Automated accounts were responsible for an estimated 90% of all tweeted links to popular websites focused on adult content during the study period. For popular websites focused on sports content, that share was estimated to be 76%.

Automated accounts make up a slightly smaller proportion – although in each case still a majority – of link shares for other types of popular sites. Most notably, the Center’s analysis finds that 66% of tweeted links to the most popular news and current events sites on Twitter are likely to have been shared by bot accounts. That figure is identical to the average for the most popular sites as a whole. Suspected automated accounts make up a larger share of links posted to popular sites focused on commercial products or services (73%) and a lesser share of sites focused on celebrity news and culture (62%). The proportion of link shares by automated accounts is the lowest for links associated with Twitter.com – that is, links that stop at Twitter and do not redirect to any external site – compared with the six topical categories in this study. Links associated with Twitter itself are shared by suspected bot accounts about 50% of the time – a smaller share than the other primary categories of content analyzed.

In focus: Popular news and current events websites are linked to in tweets by bots

Automated accounts post a substantial share of links to a wide range of online media outlets on Twitter. As noted above, the Center’s analysis estimates that 66% of tweeted links to popular news and current events websites are posted by bots. The analysis also finds that a relatively small number of automated accounts are responsible for a substantial share of the links to popular media outlets on Twitter. The 500 most-active suspected bot accounts alone were responsible for 22% of all the links to these news and current events sites over the period in which this study was conducted. By contrast, the 500 most-active human accounts were responsible for just 6% of all links to such sites.

The Center’s analysis also indicates that certain types of news and current events sites appear especially likely to be tweeted by automated accounts. Among the most prominent of these are aggregation sites, or sites that primarily compile content from other places around the web. An estimated 89% of links to these aggregation sites over the study period were posted by bot accounts.

Automated accounts also provide a somewhat higher-than-average proportion of links to sites lacking a public contact page or email address for contacting the editor or other staff. This type of contact information can be used to submit reader feedback that may serve as the basis of corrections or additional reporting. The vast majority (90%) of the popular news and current events sites examined in this study had a public-facing, non-Twitter contact page. The small minority of sites lacking this type of contact page were shared by suspected bots at greater rates than those with contact pages. Some 75% of links to such sites were shared by suspected bot accounts during the period under study, compared with 60% for sites with a contact page.

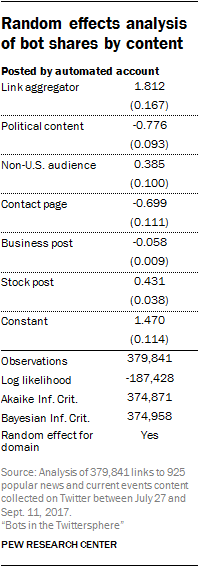
On the other hand, certain types of news and current events sites receive a lower-than-average share of their Twitter links from automated accounts. Most notably, this analysis indicates that popular news and current events sites featuring political content have the lowest level of link traffic from bot accounts among the types of news and current events content the Center analyzed, holding other factors constant. Of all links to popular media sources prominently featuring politics or political content over the time period of the study, 57% are estimated to have originated from bot accounts.

Twitter bots post a greater share of content from centrist Twitter audiences

The question of whether the media sources shared by liberals or conservatives see more automated account traffic has been a topic of debate over the last year. Some have voiced worry that suspected bot accounts are prolific in sharing hyper-partisan political news, either on the left or right of the ideological spectrum.

However, the Center’s analysis finds that automated Twitter accounts actually share a higher proportion of links from sites that have ideologically mixed or centrist human audiences – at least within the realm of popular news and current events sites with an orientation toward political news and issues. By extension, these automated accounts are less likely to share links from sites with ideologically conservative or liberal human audiences. In addition, right-left differences in the proportion of bot traffic are not substantial.

This analysis is based on a subgroup of popular news and current events outlets that feature political stories in their headlines or have a politics section, and that serve a primarily U.S. audience. A total of 358 websites out of our full sample of 2,315 popular sites met these criteria. Researchers isolated the suspected non-automated accounts that shared links to those sites on Twitter over the time period of the study and used a statistical technique known as correspondence analysis to estimate the ideology of each site’s Twitter audience.

Correspondence analysis first measures how consistently individual sites are shared by some users and not others. It then groups them together and quantifies the degree of difference. Based on this analysis, a score of greater than zero suggests that a site’s audience is more consistently conservative, while a score less than zero suggests that a site’s audience is more consistently liberal. This is a technique based on scholarly research that estimates ideological preferences as revealed by behavior. Researchers can use this method to see which sites are shared mostly by a liberal, conservative, or moderate audience, and how many times bots share each kind of site. It is important to note that correspondence analysis produces estimates of audience ideology without any analysis of the content of the website – only the sharing patterns of human users. For more details, see the methodology section.

The Center’s analysis finds that suspected autonomous accounts post a higher proportion of links to sites that are primarily shared by human users who score near the center of the ideological spectrum, rather than those shared more often by either a more liberal or a more conservative audience. Automated accounts share roughly 57% to 66% of the links to political sites that are shared by an ideologically mixed or centrist human audience, according to the analysis. By contrast, automated accounts are estimated to share roughly 41% of links to political sites with audiences comprised primarily of liberals, and 44% of those comprised primarily of conservatives. Sharing rates among sites with liberal audiences are not significantly different from those with conservative audiences. However, differences in sharing rates for sites with centrist audiences compared with those at either end of the spectrum are substantially beyond the margins of error.
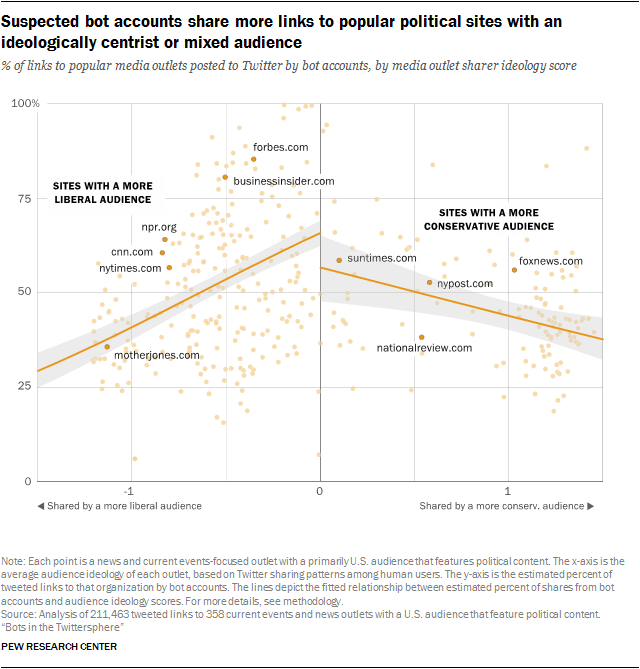
Suspected bot accounts share more links to popular political sites with an ideologically centrist or mixed audience


It is important to note certain caveats in interpreting the findings of this analysis. First, this study only examines major media outlets as measured by the number of shares they receive on Twitter. Second, it does not examine the truthfulness (or lack thereof) of the content shared by humans and the content shared by bots. Finally, it is focused on overall sharing rates and does not account for the subsequent shares or engagement of human users.
Acknowledgments

This report is a collaborative effort based on the input and analysis of the following individuals. Find related reports online at pewresearch.org.

Primary researchers

Stefan Wojcik, Computational Social Scientist Solomon Messing, Director, Data Labs Aaron Smith, Associate Director, Research Lee Rainie, Director, Internet and Technology Research Paul Hitlin, Senior Researcher

Research team

Skye Toor, Data Science Assistant Patrick van Kessel, Senior Data Scientist Adam Hughes, Computational Social Scientist

Editorial and graphic design

Peter Bell, Design Director Travis Mitchell, Copy Editor David Kent, Copy Editor Kim Arias, Video and Motion Graphics Producer

Communications and web publishing

Rachel Weisel, Communications Manager Tom Caiazza, Communications Manager Hannah Klein, Communications Associate Travis Mitchell, Digital Producer Shannon Greenwood, Associate Digital Producer

In addition, the report benefited from feedback provided by Kenny Joseph at Northeastern University, as well as the following Pew Research Center researchers: Amy Mitchell, Claudia Deane, Galen Stocking and Mike Barthel. Special thanks to Spencer Ward and William Tedrick for research assistance.

Methodology

CORRECTION (April 2018): In the table called “Random effects analysis of bot shares by content,” the term “Business site” was changed to “Business post” to match the term used in the report. This correction does not materially change the analysis of the report.

This report examines how often automated accounts share links on social media, using a large collection of links from Twitter users collected between July 27 and Sept. 11, 2017. The report relies upon several sources of data and various measures. This methodology section provides an overview of how data were collected and how measures were generated.

Terminology

Link: A web URL to an article or main page of a website. For this report, all links were collected from public tweets available through Twitter’s Streaming API. When links were found to have been shortened, researchers used an algorithm to determine the long-form destination of the link.

Botometer: A scoring system for determining the likelihood that Twitter accounts are automated, built by researchers at the University of Southern California and the Center for Complex Networks and Systems Research at Indiana University. Scores are based on machine learning techniques. The tool was trained by examining the characteristics of thousands of Twitter accounts determined by humans as being automated or not.

News and current events sites: Websites that feature reports on current events in public life, broadly construed. This excludes web sites that report solely on sports, celebrities, adult content, a specific organization or group (e.g. ACLU), or commercial products or services.

Audience ideology score: A measure of how consistently websites are shared by some groups of non-bot accounts compared to others. Non-bot accounts are grouped by similar behavior – in this case the sharing of links. This measure does not take into account the content of the websites at all. It is based solely on audience sharing behavior.

Support Vector Machine (SVM): A flexible method for classifying data into categories. To use this technique, researchers constructed a training dataset of the URLs of relevant text examples – tweets or link URLs. Researchers then trained the SVM model to differentiate between types of content based on the words in the URL or in the tweet text.

Random effects regression: Researchers used this type of statistical model to estimate the proportion of links posted by automated accounts. This model is appropriate for the structure of the collected Twitter data – links that are associated with websites – and adjusts for unexplained variation in frequency of automated account shares across websites.

Data collection

Data for this report came from three sources:

  1. Tweets collected directly from Twitter through their public Streaming Application Programming Interface (API)
  2. Human coding of websites
  3. Data collected using a specialized algorithm called “Botometer” that detects the likelihood that specific Twitter accounts are automated

Why use Botometer to identify bots?

Researchers investigated several methods of identifying bot accounts accurately on Twitter. Many existing methods for detecting bots use semi-automated methods, which work well on a relatively small scale. However, because researchers sought to examine tens of thousands of accounts, any process that relied on human judgement for each account was impractical.

Few accounts openly reveal the fact that they are automated in their profiles. A small number of self-described bots include phrases such as “I’m a bot,” or “no harm meant, just a simple bot,” or “automatic real-time content creation,” or “numbered tweets are automatic.” However, a text search of profile descriptions discovered that accounts with these types of clear designations were rare. The researchers concluded this by searching across all public-facing profile descriptions in the dataset for the word fragments “bot” or “automat.” The search also omitted confounding word fragments matching “botan,” “phlebot,” “bother,” “robotic,” “automation,” “bottle,” “bottom,” “botox” and “sabotage,” among others.

This search revealed that just 636 accounts (of 140,545 included in the study) featured these words. Even so, not all of the accounts containing these words were automated, though many were. Because so few accounts were clearly labeled as bots, another process was necessary to identify bot accounts.

Detecting Twitter account automation using Botometer

Researchers determined that the most practical method to estimate how many of the accounts were likely automated would be to use a machine learning algorithm that approximates human decision-making, but one that does so at a far greater scale than could be achieved by human coders. Researchers decided to use Botometer automated account-checking tool for this task. This tool was developed by academic researchers at the University of Southern California and the Center for Complex Networks and Systems Research at Indiana University.

Researchers used Botometer for several reasons. Now in its second incarnation, Botometer uses state-of-the-art methods to assign scores to Twitter accounts associated with the likelihood any given account is automated. Botometer’s algorithm was trained on thousands of decisions about whether accounts are automated or not, made by the research group’s own team of human coders. This training data set helped Botometer algorithm approximate human coding decisions.

Botometer extracts over 1,000 pieces of information about each account, including measures of sentiment (mood), time of day, who the account follows, the account’s tweet content and its Twitter network. These variables are used in a “random forest” machine learning algorithm. This algorithm takes into account many attributes when assigning a bot score, such that a complex combination of factors may be used to make the determination about whether or not an account is a bot. For example, the algorithm may use information about whether the account is both tweeting from a personal computer and has a low number of followers when making a prediction. The ability to detect these conditional relationships makes the Botometer method both flexible and accurate.

Botometer assigns scores to accounts on a scale of 0 to 1. For this project, the Center used a score of 0.43 or higher to declare an account is likely automated, based on a series of validation exercises. See the section below on robustness tests for details about how the Center arrived at that threshold.

Collecting tweets for this analysis via Twitter’s public API

Researchers created a list of popular websites by collecting all tweets available via Twitter’s Streaming API from July 27 to Aug. 14, 2017. Twitter’s API allows access to a random sample of public statuses, corresponding to 1% of all public posts each day. Researchers used a Python script to download and save all public posts from this stream that contained URL links (either because the user shared a link or retweeted a previously shared link). From that sample, researchers first identified the 3,000 websites that were shared most often. After removing dead links, duplicate sites, or sites without sufficient information to be coded, they arrived at a list of 2,315 websites which were used in the analysis. Then they identified all tweets linking to this list of most frequently shared websites over the (longer) period of July 27 to Sept. 11, 2017. Within this collection, researchers kept only tweets from users that indicate English as their profile language. The final sample included a total of 1,156,837 tweets from 140,545 different Twitter accounts that included links to the most-shared sites.

Many URL links shared on Twitter use link-shorteners such as Bitly and Ow.ly instead of a full URL. In order to identify the actual sites that those shortened links eventually directed the reader to, researchers used a Python script to determine the intended endpoint and record that destination. This helped ensure that the collection of most shared websites included only websites with some kind of content, rather than redirects. It also helped reduce the risk of underestimating the popularity of sites that are especially likely to be linked to with URL shorteners.

If a link directed the visitor to a missing or since-deleted page, the script identified the domain of the website that the link originally pointed to. At the same time, researchers took any resolved subdomains and extracted the root domains to ensure that links to different parts of the same website were not misclassified as links to different websites.

Categorization of websites by primary subject area

Part of this investigation seeks to determine if levels of bot sharing differed by the subject matter covered by a website. To test this, a team of human content coders determined the primary topical focus for each of the 2,315 websites included in the final sample.

Coders were given a list of 3,000 of the most shared websites appearing in the collection of tweets between July 27 and Aug. 14, 2017 – a shorter time frame than the entire period of data collection. Researchers conducted tests to ensure the domains collected during this two-week time period largely reflected the most-popular domains throughout the entire 47-day period. Fully 96% of the sites collected during this nearly two-week period overlapped with the top 5,000 domains from the entire period.

The content coders made judgments about the content of each website: whether the site provided news and current events or not.

A site was considered to contain information about news and current events if it met two criteria:

  1. The site featured reports on current events in public life
  2. The site was not exclusively writing about or promoting commercial products, non-news organizations, pornography, sports or celebrities.

Of the 2,315 sites that were both frequently shared and still available online, coders identified 925 domains that met these criteria. For each of those sites, researchers classified four additional attributes of the sites. These additional attributes were not mutually exclusive, and took the form of “yes” or “no” decisions regarding each site’s content.

If the site did not meet the criteria for being considered a current events site, coders assigned a different category – either “commercial product or service,” “adult,” “organization,” “celebrities,” or “sports” – based on the content that the site was predominantly writing about or promoting. Links that stopped at Twitter itself – shared links that redirected to content on the Twitter platform – were manually isolated as a separate category rather than be assigned to one of the six topical categories.

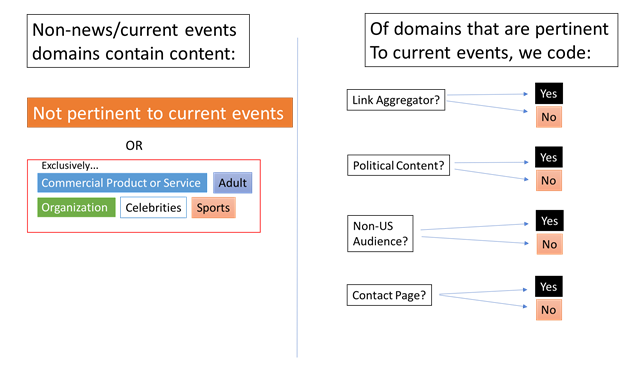
Researchers provided the following flowchart to coders:

Codes for current events sites

When a site was coded as a news and current events site, coders assigned a “yes” or “no” value for each of the following four items: link aggregator, political content, non-U.S. audience and contact page.

Link aggregators includes sites where a majority (more than 50%) of the links on the main page redirect to external sites or feature screenshotted external pages – attributed as the source of the article. To determine if a site was a link aggregator, coders clicked three stories posted at the top of the page, and evaluated whether they linked to, or were attributed to, external media sites. A domain was classified as a link aggregator if at least two out of three top stories were attributable to external sites.

Link aggregators comprised 32,053 links, or 8.4% of the all links among sites coded as focused on news and current events. They were also 8.4% of all domains pertaining to news and current events.

Political content includes sites that dedicate at least some of their content to politics. Coders assessed whether there was a political story on the front page or if the site had a “politics” tab. Political content was broadly defined as content related to political officials, candidates, diplomacy, war or institutions, including politics in the U.S. or globally.

To make the final determination about whether a site featured political content, at least one of two conditions had to be met: Either there was a menu on the main page with a “politics” themed tab, or at least one of the top five headlines (in terms of page position) on the page were about elected officials, candidates, diplomacy, war, political demonstrations or institutions.

Websites featuring political content comprised 291,230 links, or 77% of the all links among sites coded as focused on news and current events, and 70% of the 925 news and current events websites.

The non-U.S. audience tag includes sites that appear to target a non-U.S. or foreign-born audience. While the vast majority of sites were primarily in English, any non-English sites whose primary audience could not be determined were coded as missing. A site was labeled as seeking a non-U.S. audience if the main page was not in English or if the site featured stories including information primarily relevant for a foreign audience.

Links to non-U.S. audience news sites comprised 81,497, or 21%, of the all links among sites coded as focused on news and current events, and 32% of all the 925 news and current events websites.

The contact page code includes sites with a contact or feedback page. Contact pages were often visible from the main page, with a link to a page with a textbox for entering comments. Coders also looked for other ways to get in contact with someone managing the site to raise issues or concerns. For example, coders examined whether there was an email address for an editor or webmaster for sending concerns. A “comment” section at the footer of an article or a Twitter profile link did not count as a contact page.

Links to news sites lacking contact pages comprised 32,860 links, or 8.7% of the all links among sites coded as focused on news and current events, and 9.9% of all news and current events websites.

Inter-coder reliability of human classification decisions

To test the validity of the website coding scheme, two researchers participated in the inter-coder reliability testing process. The results for those tests were as follows:

The rate of agreement between coders was consistently near or above 90%. Another measure of inter-coder reliability is Cohen’s Kappa. A higher Cohen’s Kappa score indicates greater agreement between coders, even accounting for relatively high occurrence of a category. This means that this measure takes into account the possibility that agreement could be high merely by chance.

Random effects analysis of content

Within content coded as “current events and news,” the Center analyzed differences in bot posting rates between link aggregators, political content, U.S.-audience-focused content and sites with contact pages. Researchers used a random effects statistical model to estimate the proportions of links produced by automated accounts conditional on these variables. Researchers used this model to account for the nested nature of the data – where links are associated with (or nested within) domains. A benefit of this method is that it controls for a degree of unexplained heterogeneity or difference in the number of bot shares among the set of current events and news sites.

Posts associated with stock tickers and stock-relevant business tweets presented a potential confound in that these tweets might be especially likely to indicate that the account posting them was a bot, given what has been discussed about automated accounts manipulating rankings.

Whether the tweet included stock tickers was included as a control variable in the random effects regression model. Whether the tweet included business references was also included as a control variable.

In the collected Twitter data, links are associated with websites, and websites have different overall levels of popularity on Twitter. This means that the per-site number of discovered links (sample size) will vary across sites. This is a statistical problem because it may cause sites that appear frequently to seem to have more or less bot activity than they actually do. To address this problem, researchers use a random effects regression model. This method uses the hierarchical structure of the data to improve estimation of bot activity for less popular sites by adding baselines.

Stock and business posts were identified using “regular expressions” – word fragments or patterns that match tweet text – and a Support Vector Machine (SVM). Researchers initially classified tweets as stock-related if they contained a “$” followed by an upper-case character string (length between three to 10 characters) or any tweet containing the fragments: “#stocks”, “#daytrading”, “#trading”, “#mkt”, “#NYSE”, “#NASDAQ” or “#AMEX”.

Alternatively, a set of “soft”, non-stock related tweets was identified using the fragments: “sports,” “entertainment,” “arts,” “fashion,” “style,” “lifestyle,” “leisure,” “celeb,” “movie,” “music,” “gossip,” “food,” “travel,” “horoscope,” “weather” and “gadget.” To create a training dataset, rows not containing either of the fragments were removed, and the tweet text in the training data was then modified so that the fragments were removed. Researchers then trained an SVM to discern between stock and other kinds of posts based on the remaining tweet text. This allowed researchers to uncover other word fragments that frequently co-occur with the initial strings, and classify posts with high precision and recall. Accuracy and precision on the training data were both 0.99 and recall was 0.85, with 10-fold cross-validation.

For business tweets, researchers started with the fragments “forbes,” “business,” “reuters,” “bloomberg,” “ceo” and “profit” to construct a basic list of terms. This list is based on popular sites that report on business news in the data. Researchers then removed these word fragments from tweet text and trained an SVM to learn from the tweet text to discern between business-related posts and all other posts. Precision and recall on the training data were 0.92 and 0.86 with 10-fold cross-validation.

Using this method, researchers uncovered 340,675 business-related posts and 20,095 stock related posts.

The analysis of politically-focused media outlets: How Pew Research Center estimated the ideology of website audiences

Some news and current events websites have audiences that are predominantly liberal or conservative. Researchers decided to estimate the ideological orientation of accounts that shared particular Twitter links in order to understand the relationship between that orientation and the kinds of links a particular account shared. In order to generate an estimate of the ideological leanings of audiences across Twitter, researchers used a statistical technique known as correspondence analysis which examined the behavior of Twitter users in comparison with each other.

For example, if one account shared a set of three links very often, and a second account shared the same three links almost as often, those two accounts would be grouped close together. If a third account shared one of the three links occasionally, alongside two other links that the first two accounts never shared, that third account would be grouped a bit further away. Each media site was given a score on an ideological spectrum from -1.2 (most liberal) to 1.5 (most conservative) based on the media link sharing behavior of their Twitter audience.

Creating a subsample of data

In order to use this method, researchers had to create a smaller sample of the full dataset that accurately reflected overall political link sharing for Twitter users. To do that, certain Twitter accounts and news websites were excluded from the overall sample because they would have been irrelevant for the analysis. In other words, non-political URL shares would not provide any additional useful information about the political orientation of audiences, while adding irrelevant information.

First, only Twitter accounts that met the following criteria were analyzed:

  • Accounts that were determined likely to be non-automated based on Botometer scores
  • Accounts that shared links from at least five different current events websites during the sample period

Second, only websites that met the following criteria were included in the subsample:

  • Sites that featured at least some political content, according to human coders
  • Sites that were primarily targeted at a U.S. audience, according to human coders
  • Sites where at least 50% of tweets linking to their content was considered political news (this decision was based upon a separate machine learning classification algorithm)9
  • Sites that were shared by at least 10 distinct non-automated accounts

Once these criteria were applied, the new dataset consisted of 2,587 unique Twitter accounts and 171 different news and current events websites. The accounts used in this analysis belonged to highly engaged users frequently posting political content.

Researchers used the initial (171) set of audience ideological estimates to infer the audience scores for sites not included in the initial set. First, they estimated the average score across users sharing each site. Researchers then used a random effects regression model to estimate these averages rather than fully disaggregating the data. This reduces variance among less popular sites, similar to the method for estimating content proportions, described above. Then, they used these estimates to generate site-level averages for the remaining 187 sites.

Determining whether sites contained political content

Since one of the above criteria for determining whether sites were politically oriented involved measuring the content on each site, researchers needed a method to determine the general subject matter of articles on each site. To do this, researchers used a machine learning technique called “Support Vector Machines” (SVMs).

To use this technique, researchers constructed a training dataset of the URLs of news and current events articles. Researchers then trained the SVM model to differentiate between political and non-political links based on the words used in the URL and in the tweet text.

To do so, researchers created regular expressions about common political themes, which were compared to the text in each shared URL to identify links as political or not. Researchers included the word fragments: “politi,” “world,” “usnews,” “national,” “state,” “elect,” “vote,” “govern,” “campaign,” “war,” “polic,” “econ,” “unemploy,” “racis,” “energy,” “abortion,” “educa,” “healthcare” and “immigration.”

They generated an alternative non-political set of fragments, including “sports,” “entertainment,” “arts,” “fashion,” “style,” “lifestyle,” “leisure,” “celeb,” “movie,” “music,” “gossip,” “food,” “travel,” “horoscope,” “weather” and “gadget.” They created a training data set that included only tweets that contained the political or non-political fragments (consisting of 112,855 tweeted links). Then, researchers deleted the text of the URLs and trained the SVM to learn new words and phrases from the tweet text that occurred alongside the regular expression fragments of political words. The method achieved cross-validated accuracy of 95.3% on the training set.10 The proportion labeled as political was 31% in the training dataset. According to the model, other words associated with political news were “reuters,” “npr,” “forbes,” “brief,” “politico” and “infowars,” among others. For the full dataset, this method yielded 333,660 links likely to be about politics across all domains.

As an example, the following tweet would be classified as political: “#Iran security forces start crackdown http://iran-hrm.com/index.php/2017/08/18/iran-security-forces-beat-arrest-13-young-sunnis-praying-public/”

Use of correspondence analysis

Once the politically focused subsample of Twitter accounts and current events websites was created, researchers used correspondence analysis to give audience ideology scores to each media outlet in the study.

Correspondence analysis quantifies how consistently websites are shared by some groups of accounts compared to others. Accounts are grouped by similar behavior – in this case the sharing of links. This technique does not take into account the content of the websites at all. It is based solely on audience sharing behavior.

In this process, each Twitter account is given a score ranging roughly between -1.2 to 1.5, based on how their sharing behavior compares with all the other accounts in the sample. Two accounts that only share articles from the exact same websites would have identical scores. These scores are derived by the correspondence analysis, which groups accounts on the scale based on their similarity in sharing patterns.11

Audience scores for each media outlet were derived using the correspondence analysis, specifically by averaging the correspondence analysis scores for each of the Twitter accounts that shared at least one link from that outlet. The latter method was used for media outlets not included in the politically-focused subset of sites that were used in the correspondence analysis.

In the case of this project, the analysis scores for the audiences of media websites correlated strongly with political ideology calculated in other studies. The Center’s estimates were correlated with those from prior academic work at 89%.12

Researchers selected liberal, conservative and center cut-off values based on the distribution of scores in the data. Liberal audience ideology scores were given to sites whose scores were approximately -1 or less, while conservative audience ideology scores were given to sites whose scores were approximately 1 or greater. These cut points are approximately where the bottom and top 75 percentiles of the distribution of the data are located. Scores in the middle bin were approximately zero, corresponding to where the 50 percentile of the data fall.

Robustness tests

In the process of producing this report, researchers performed a number of tests to ensure the robustness of the key findings.

Robustness test: Botometer thresholds

The detection of automation is a burgeoning field. Increasingly sophisticated automation techniques can make reliable detection very difficult indeed. For this project, researchers used several different techniques to validate the Botometer approach and ensure its accuracy.

Selecting the Botometer threshold to classify automated accounts

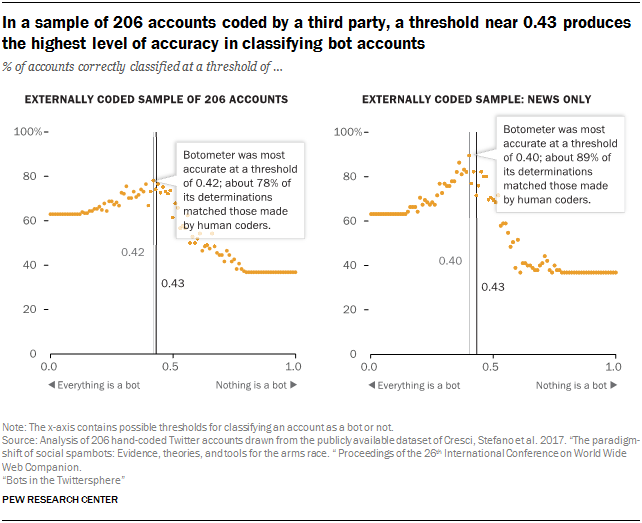
Higher account bot scores (on a scale of 0 to 1) estimated by Botometer indicate a higher likelihood that an account is automated, but researchers must select a specific value as a threshold to determine whether or not a given account is automated. In other words, while Botometer estimates a fine-grained score that provides nuanced information about whether an account is automated, ultimately researchers had to decide if the account was or was not a bot. A low threshold would correctly classify most actual automated accounts as bots (what is defined as high “recall”), but would also incorrectly identify a large number of actually non-automated accounts as bots (what is defined as low “precision”). A high threshold would have the reverse problem – it might be accurate about the accounts it thinks are automated (high precision), but would also incorrectly assign many bots as being non-automated (low recall). Prior work by the Botometer team found thresholds between 0.43 and 0.49 maximized accuracy – the total number of correctly classified accounts divided by the total number of accounts.

For this project, researchers chose a threshold of 0.43 based on both earlier research13 reported by the authors of the Botometer detection system and independent validation work conducted as part of this project. According to the authors of Botometer, a threshold at or near 0.50 is appropriate for some automated accounts, but works more effectively on older, less-sophisticated bot programs. For more modern, sophisticated automated accounts, a threshold of 0.43 has been shown to maximize the accuracy of the system. The Center’s analysis largely aligned with the Botometer results.

Testing Botometer thresholds

Researchers selected a random subset of 100 Twitter accounts and evaluated whether they appeared automated to human coders – assigning an “automated” or “not-automated” label to each account. Researchers then tested all thresholds of the bot score (from 0 to 1), calculating the proportion of all classified accounts that would be given the correct label at each threshold, and then selecting the threshold that yielded the highest accuracy. This test yielded a threshold somewhat lower than what the Botometer team had uncovered: 0.37 instead of 0.43. A threshold this low was estimated to produce a precision of 0.82 and a recall of 0.86 – slightly favoring recall over precision.

When compared with another set of hand-annotated accounts, but assuming the same proportion of bots as the Center’s random sample of accounts, a threshold of 0.42 was the most accurate. Researchers collected the separate list of 206 human-classified accounts coded from two external groups of researchers and matched them to the Twitter accounts collected by the Pew Research Center team. The Center team again tested the accuracy of all thresholds of the Botometer score using these externally coded data. These tests found a threshold of approximately 0.42 maximized accuracy of the classification system – very close to the 0.43 originally uncovered by Botometer researchers. The maximum accuracy in this set of accounts was approximately 78%.

These tests suggest that 0.43 is an accurate threshold for detecting automated accounts when using Botometer scores. The figures above show the 0.43 threshold in black, and the threshold that was found to maximize accuracy in the given sample in grey.

Checking suspended accounts

The Center tested how many accounts identified as bots based on the Botometer score were later suspended by Twitter. To do so, researchers wrote a script to request account details from all 140,545 accounts that posted links to at least one of the 2,315 websites in the study using the Twitter API. They recorded whether the API returned an error message stating that the account had been suspended. They found 7,226 accounts in total were suspended. Accounts identified as bots were 4.6 times more likely to be suspended than accounts identified as human (5,592 bot accounts suspended).

Reducing the impact of time lags during the Botometer measuring process

Determining whether accounts are automated is a time-intensive task. One possible concern was that two accounts posting around the same time could be checked at different times due to occasional latencies in the Botometer system. In order to prevent time lags between when a Twitter account last posted and when the account could be automation-checked by Botometer, researchers ensured that tweets published at different times were all checked after a fixed amount of time had passed, using a dynamic queuing system.

Robustness test: Removing verified automated accounts

How many of these bots are from “verified” accounts and news sites?

To address this concern, researchers conducted some additional tests and found that the number of these types of bots was small, and the results would not change much if these types of automated accounts were removed (see next section).

Results do not change much if verified accounts are excluded

One way to identify the automated accounts that come from established media organizations is to rely on a special class of Twitter accounts known as verified accounts. Account verification includes a formal application that needs to be approved by Twitter, requiring specific documentation. According to Twitter, a verified account “lets people know that an account in the public interest is authentic.” Verification was suspended on Nov. 9, 2017 while Twitter resolved their verification rules. It is unclear if non-automation requirements have ever been a part of Twitter’s verification review process.

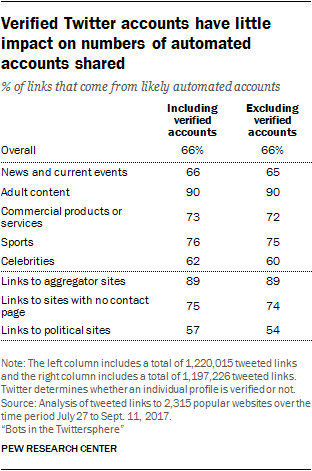
The Center conducted the same analysis in this report while excluding verified accounts to demonstrate that the existence of these accounts had little impact on the overall results.

Researchers uncovered one “news bot” – the “PowerPost” bot – from a list of Washington Post and New York Times news bots provided by Pablo Barbera of the University of Southern California. They also identified 1,980 further accounts marked “verified,” but also classified as “suspected bots” according to the Botometer system. Researchers removed them for the robustness checks described in this section.

Across all the sites in this study, the percent of links coming from automated accounts was virtually identical if these verified accounts were included or excluded (66%). The results were also similar when considering only the sites focused on news and current events (66% to 65%).

Verified automated accounts have little impact on the relationship between audience ideology and the proportion of shares from automated accounts

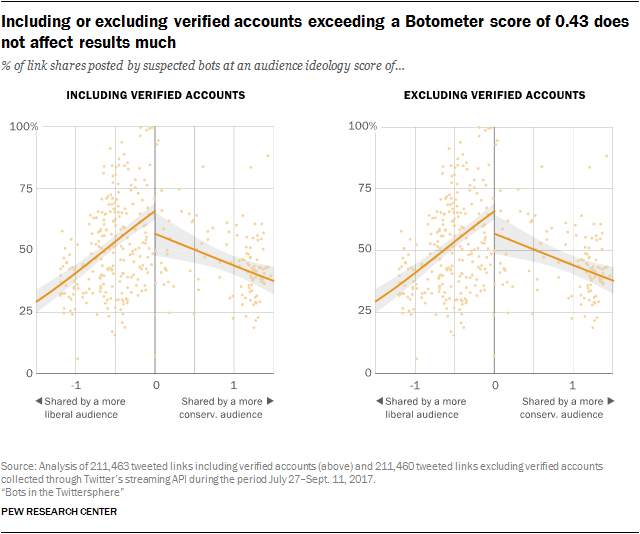
With or without verified automated accounts, researchers discovered the same main finding when comparing audience ideology scores and the proportion of shares from bots: automated accounts include more links to sites with audience ideology scores near the center than at the extremes.

The confidence interval for sites with more conservative audiences sites widens somewhat, but it is otherwise similar to what is presented in the main analysis. The main takeaway remains the same: for individual political websites, the rate of automated account shares declines as a site’s audience becomes primarily liberal or primarily conservative.