
Korean Americans:
A Survey Data Snapshot
These data snapshots are drawn from Pew Research Center’s in-depth research portfolio on Asian Americans. To learn more, visit our Asian Americans topic page. For our latest demographic data on Korean Americans, visit “Facts about Koreans in the U.S.”
More than 1.8 million Korean Americans lived in the United States as of 2022, accounting for 8% of all Asian Americans, according to data from the U.S. Census Bureau.
A majority of Korean Americans (57%) are immigrants, similar to the share among all Asian Americans (54%). And while Korean Americans live all over the U.S., about three-in-ten reside in the Los Angeles (17%) and New York (12%) metropolitan areas.
The median income among Korean American households was $90,000 in 2022, meaning that half of households headed by a Korean American person earned more than that and half earned less. This is less than the median household income among Asian Americans overall ($100,000).
Here’s a closer look at how Korean Americans describe their identities, their political and religious leanings, and their feelings about the American dream. These findings come from a nationally representative Pew Research Center survey of 7,006 Asian adults in the U.S. – including 1,146 Korean Americans – conducted in 2022 and 2023.
Identity
Korean Americans are more likely than some other Asian Americans to describe themselves using their ethnic origin. About two-thirds of Korean Americans (66%) say they most often describe themselves as “Korean” or “Korean American.” By comparison, only about half of all Asian Americans (52%) typically use their ethnic origin to describe themselves.
Meanwhile, 20% of Korean Americans describe themselves most often as “Asian American” or “Asian.” Another 9% typically call themselves “American.”
A quarter of Korean Americans say they’ve hidden part of their heritage – such as cultural or religious practices – from people who are not Asian. This is somewhat higher than the 20% of all Asian Americans who say this.
Views of the U.S. and South Korea
Most Korean Americans have positive views of the U.S. and South Korea, but few say they would move to Korea.
Nearly nine-in-ten (86%) have a very or somewhat favorable opinion of South Korea. This is one of the highest shares for any large Asian American origin group when asked about their ancestral homeland. It’s also higher than the share of Korean Americans with a favorable view of the U.S. (78%).
Still, most Korean Americans (72%) say they would not move to South Korea. Among those who would move, 24% say the main reason would be for better health care and 22% say it would be to be closer to friends and family.
Achieving the American dream
Most Korean Americans believe the American dream is within their reach. Around half (49%) say they’re on their way to achieving the American dream, while a quarter say they’ve already done so. Another 25% say it’s out of reach for them.
Politics
Roughly two-thirds of Korean Americans (67%) who are registered to vote identify as or lean Democratic. Another 28% are Republicans or lean toward the Republican Party.
As of 2022, about 1.1 million Korean Americans – or 62% – were eligible to vote, according to data from the Census Bureau. That means they were at least 18 years old and a U.S. citizen through birth or naturalization.
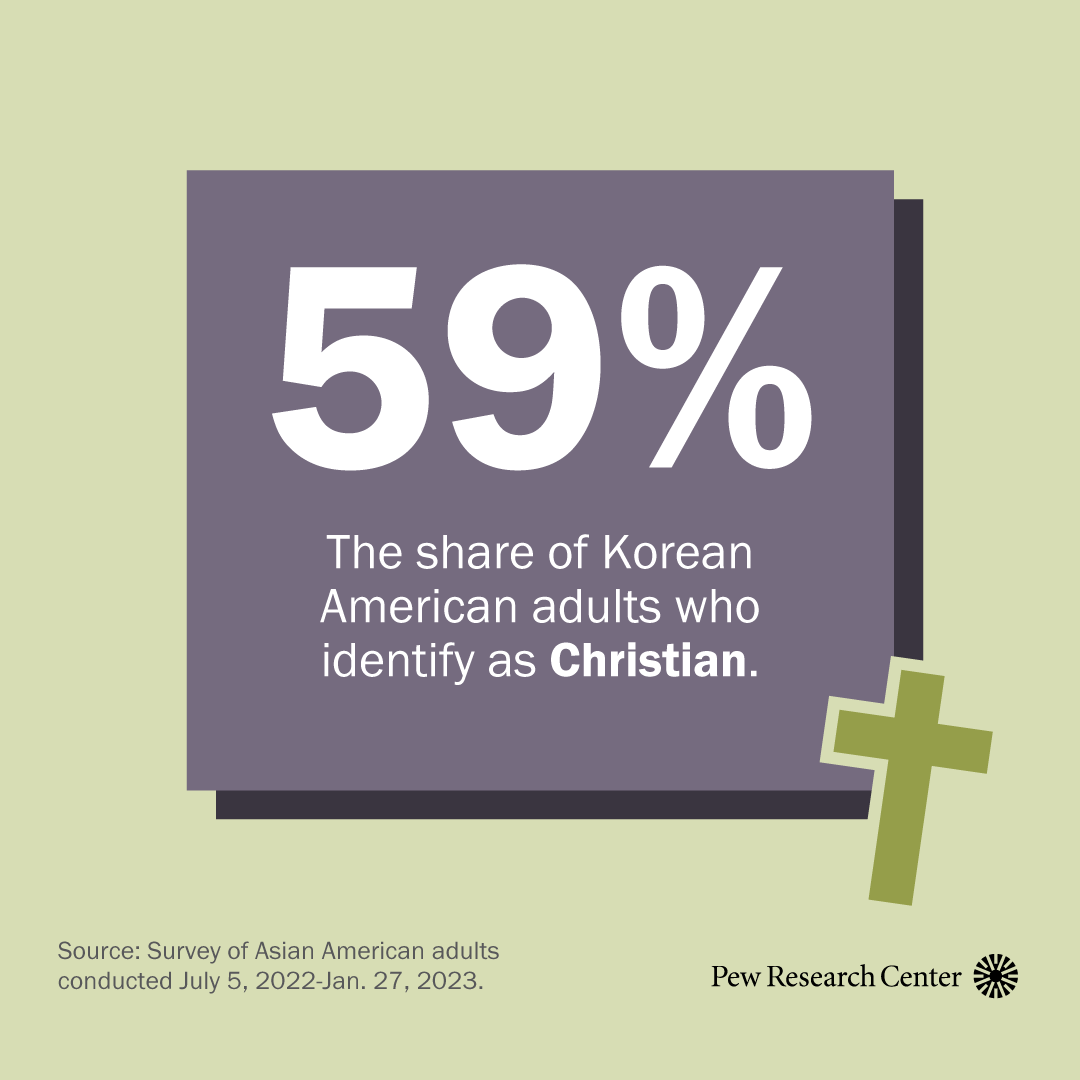
Religion
About six-in-ten Korean Americans (59%) identify as Christian – well above the 34% among Asian Americans overall. Looking at specific denominations among Korean American Christians, 34% are evangelical Protestant, 12% are nonevangelical Protestant and 11% are Catholic.
Another 34% of Korean Americans are not affiliated with any religion.
Photo by Mario Tama/Getty Images
This analysis is one in a seven-part series that explores the identities, views, attitudes and experiences of Asian Americans, including the six largest Asian origin groups in the U.S. In these analyses, Asian Americans include those who identify as Asian, either alone or in combination with other races or Hispanic ethnicity.
The six Asian origin groups highlighted in this series – Chinese, Filipino, Indian, Japanese, Korean and Vietnamese Americans – include those who identify with one Asian origin only, either alone or in combination with a non-Asian race or ethnicity. In this series, Chinese adults do not include those who self-identify as Taiwanese. Other Pew Research Center analyses exploring the attitudes and characteristics of Asian origin groups may use different definitions and therefore may not be directly comparable.
This analysis is based on two data sources. The first is Pew Research Center’s 2022-23 survey of Asian American adults, conducted from July 2022 to January 2023 in six languages among 7,006 respondents. The Center recruited a large sample to examine the diversity of the U.S. Asian population, with oversamples of the Chinese, Filipino, Indian, Korean and Vietnamese populations. These are the five largest origin groups among Asian Americans. The survey also includes a large enough sample of self-identified Japanese adults to make certain findings about them reportable. For more details, read the methodology.
The second data source is the U.S. Census Bureau’s 2022 American Community Survey (ACS) provided through Integrated Public Use Microdata Series (IPUMS) from the University of Minnesota.
Pew Research Center is a subsidiary of The Pew Charitable Trusts, its primary funder. The Center’s Asian American portfolio was funded by The Pew Charitable Trusts, with generous support from The Asian American Foundation; Chan Zuckerberg Initiative DAF, an advised fund of the Silicon Valley Community Foundation; the Robert Wood Johnson Foundation; the Henry Luce Foundation; the Doris Duke Foundation; The Wallace H. Coulter Foundation; The Dirk and Charlene Kabcenell Foundation; The Long Family Foundation; Lu-Hebert Fund; Gee Family Foundation; Joseph Cotchett; the Julian Abdey and Sabrina Moyle Charitable Fund; and Nanci Nishimura.
We would also like to thank the Leaders Forum for its thoughtful leadership and valuable assistance in helping make this survey possible.
The strategic communications campaign used to promote the research was made possible with generous support from the Doris Duke Foundation.