Tipping Culture in America: Public Sees a Changed Landscape
Most U.S. adults say tipping is expected in more places these days, but for many the rules are unclear
BYDrew DeSilver and Jordan Lippert
About Pew Research Center
Pew Research Center is a nonpartisan, nonadvocacy fact tank that informs the public about the issues, attitudes and trends shaping the world. It does not take policy positions. The Center conducts public opinion polling, demographic research, computational social science research and other data-driven research. It studies politics and policy; news habits and media; the internet and technology; religion; race and ethnicity; international affairs; social, demographic and economic trends; science; research methodology and data science; and immigration and migration. Pew Research Center is a subsidiary of The Pew Charitable Trusts, its primary funder.
Tipping Culture in America: Public Sees a Changed Landscape
Most U.S. adults say tipping is expected in more places these days, but for many the rules are unclear
How we did this
Pew Research Center conducted this study to explore Americans’ views of tipping and tipping culture, as well as their tipping practices in a variety of settings. For this analysis, we surveyed 11,945 U.S. adults from Aug. 7 to Aug. 27, 2023.
Everyone who took part in the survey is a member of the Center’s American Trends Panel (ATP), an online survey panel that is recruited through national, random sampling of residential addresses. This way, nearly all U.S. adults have a chance of selection. The survey is weighted to be representative of the U.S. adult population by gender, race, ethnicity, partisan affiliation, education and other categories. Read more about the ATP’s methodology.
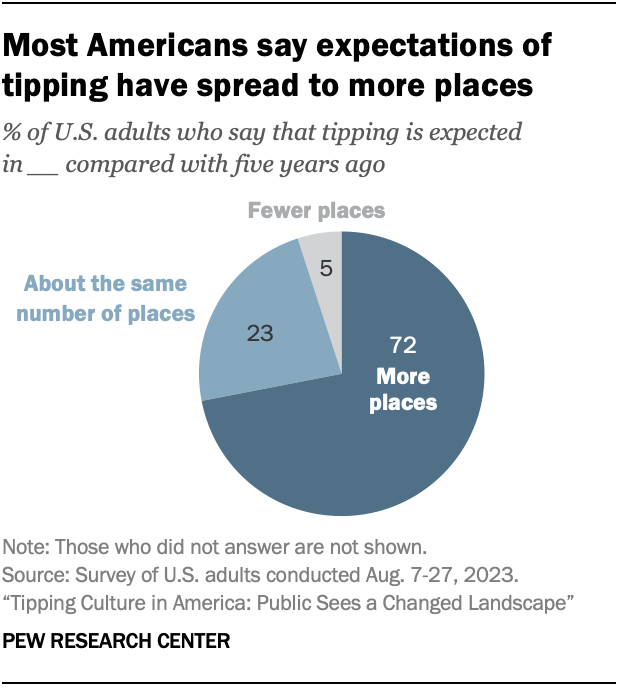
A broad majority of Americans say they’re being asked to tip service workers more frequently than in the past. Around seven-in-ten U.S. adults (72%) say tipping is expected in more places today than it was five years ago, a finding that tracks with anecdotal reporting and has even been dubbed “tipflation.”
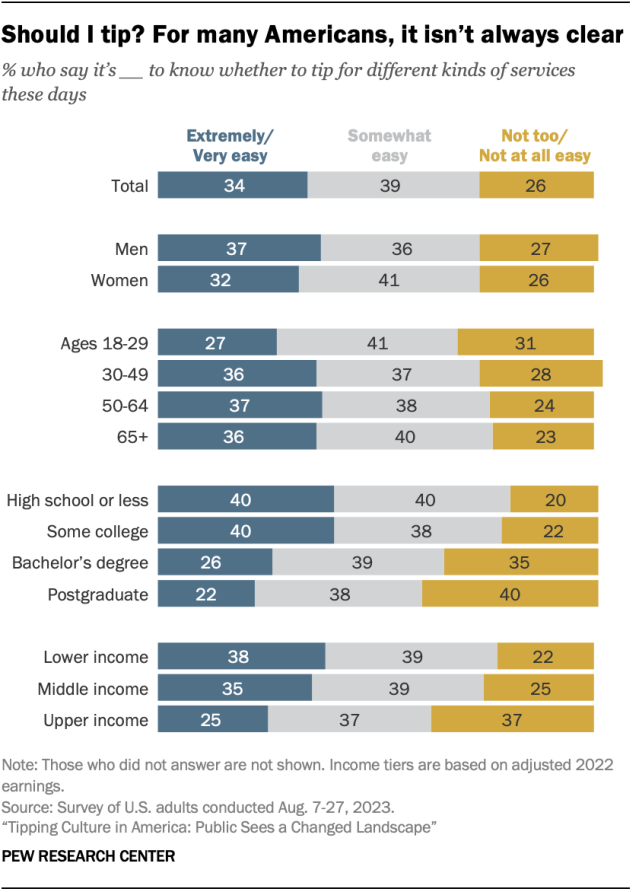
But even as Americans say they’re being asked to tip more often, relatively few have a great deal of confidence about when and how to do so. Only about a third say it’s extremely or very easy to know whether (34%) or how much (33%) to tip for different types of services.
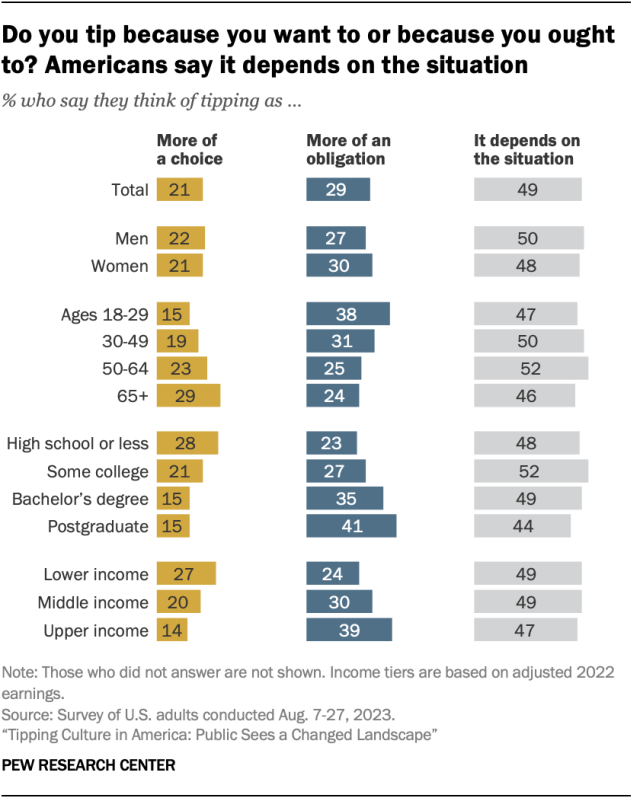
Nor is there consensus on whether tipping – which is built into the pay structures and business models of many service industries – is more of a choice or an obligation for consumers. Around two-in-ten Americans (21%) say it’s more of a choice, while 29% say it’s more of an obligation. The largest share (49%) say it depends on the situation, underscoring the lack of a single set of rules or expectations.
Read more from Pew Research Center’s series on tipping in the U.S.
We surveyed nearly 12,000 U.S. adults to find out how they feel about the common yet sometimes confusing custom of tipping, including whether they themselves would or wouldn’t tip in specific situations. Among our key findings:
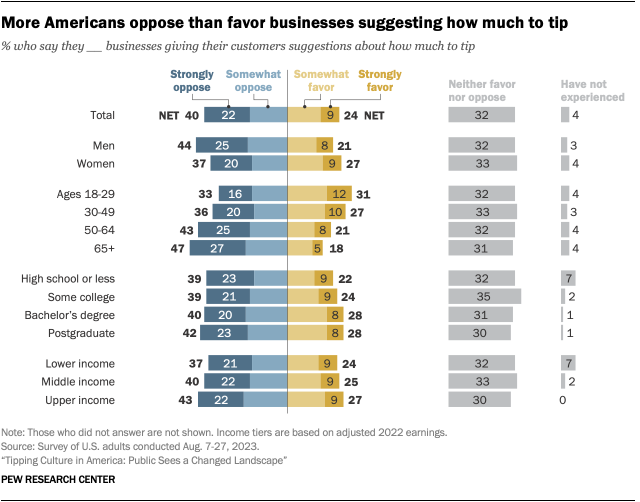
The public is more likely to oppose than favor suggested tip amounts. More Americans oppose (40%) than favor (24%) businesses suggesting tip amounts to their customers – for example, on the bill or on a checkout screen. Another 32% neither favor nor oppose the practice.
Americans broadly oppose automatic service charges. About seven-in-ten adults (72%) say they oppose businesses including automatic service charges or tips on customers’ bills, regardless of group size – including half who strongly oppose the practice. Only 10% favor such charges.
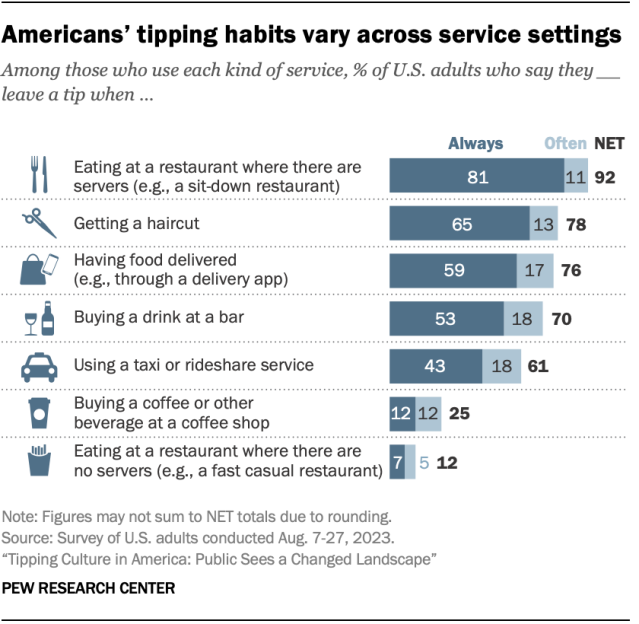
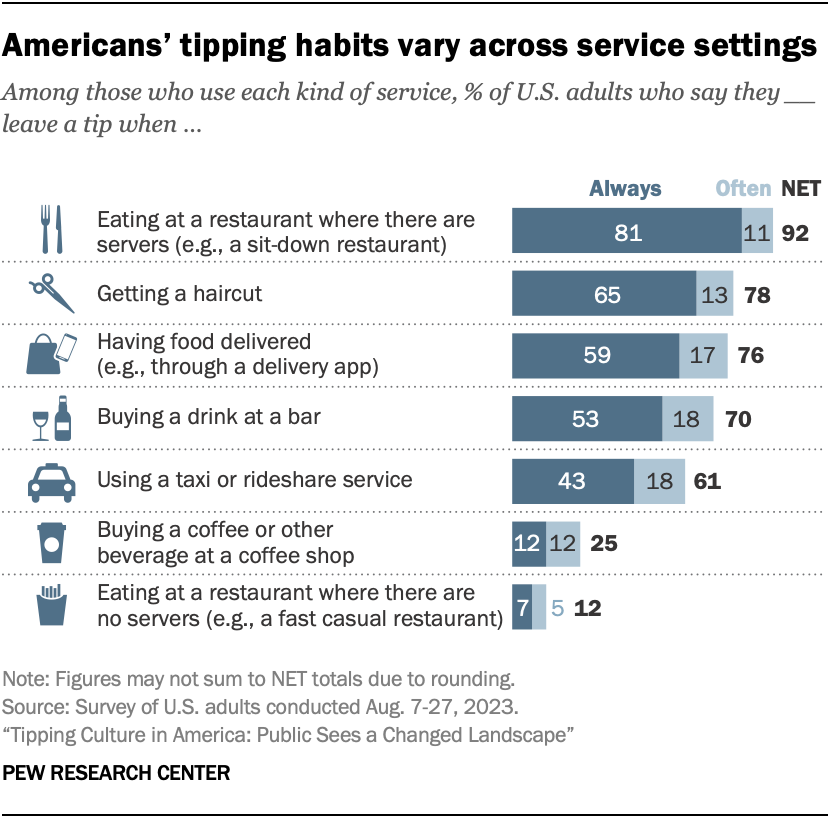
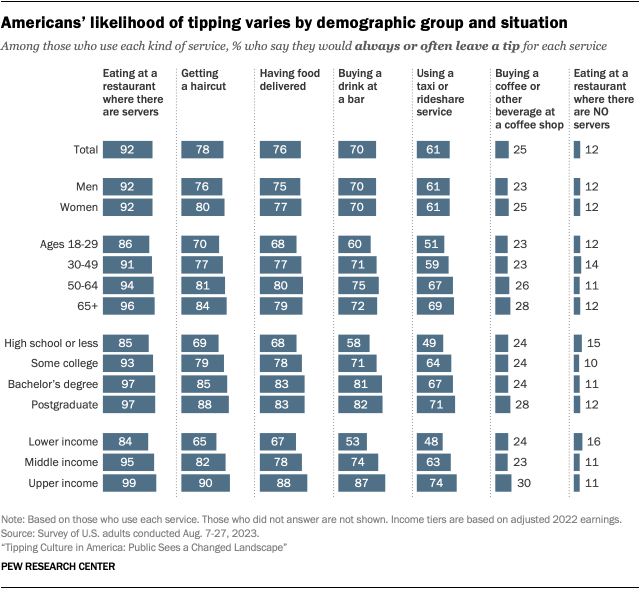
Americans’ tipping behaviors vary widely by situation. About nine-in-ten adults who eat at sit-down restaurants (92%) say they always or often leave a tip in this scenario. Among those using other services, smaller majorities tip when getting a haircut (78%), having food delivered (76%), buying a drink at a bar (70%), or using a taxi or rideshare service (61%). Relatively few Americans always or often tip when buying a coffee (25%) or eating at a fast casual restaurant (12%).
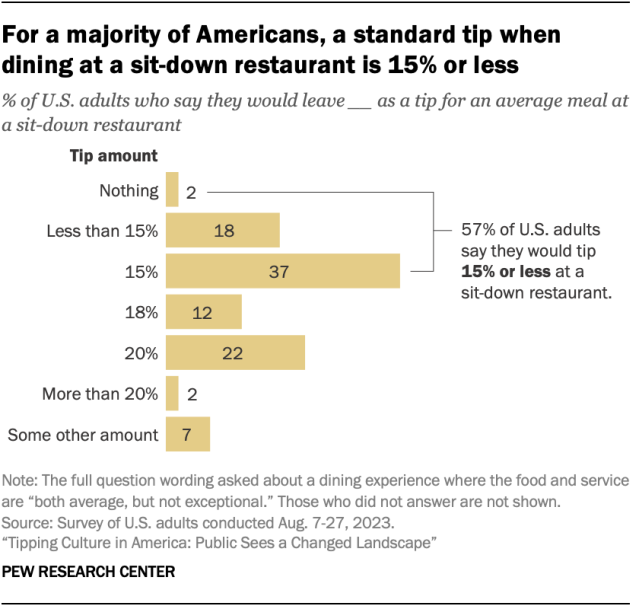
A majority of Americans say they would tip 15% or less for an average meal at a sit-down restaurant. Nearly six-in-ten (57%) say this, including 2% who say they wouldn’t leave any tip. Only a quarter of people say they’d tip 20% or more.
For most people, tipping is first and foremost about service. Around three-quarters of adults (77%) say the quality of the service they receive is a major factor in deciding whether and how much to tip. None of the other factors we asked about comes close.
For this report, Pew Research Center surveyed 11,945 U.S. adults from Aug. 7 to Aug. 27, 2023, using the Center’s nationally representative American Trends Panel. The following chapters take a closer look at:
In the United States, the practice of leaving gratuities began in the late 1800s and was well established by the Roaring Twenties (read “A brief history of tipping in the United States”). Despite this long history with tipping, Americans express ambivalence or uncertainty on a variety of questions related to it.
A brief history of tipping in the United States
Social historians don’t entirely agree about how the custom of tipping originated, but there’s general consensus that it wasn’t common at commercial establishments in the United States, especially outside major cities, until after the Civil War. The practice was spread either by European visitors or by wealthy Americans returning from Europe, where tipping was far more common at the time. (Today, tipping is less common in most of Europe than in North America.)
The practice was reinforced by businesses that employed large numbers of recently freed slaves – most notably, the Pullman railroad sleeping-car company. As tipping critic William R. Scott noted in 1916, nearly all of Pullman’s 6,500 porters were Black men from the South, whose base pay in most cases was $27.50 a month (about $760 in today’s dollars). But the company encouraged passengers to tip, and with tips porters could bring home around $70 to $100 a month or more (roughly $1,900 to $2,800 in today’s dollars).
By the turn of the 20th century, tipping was established enough in the U.S. that some high-end restaurants were actually charging their waiters for the right to work and earn tips. But tipping remained controversial. Some hotel and restaurant managers actively discouraged tips – deeming them essentially bribes for more food or better service, according to business scholar Marc S. Mentzer – and several states tried to ban the practice. Others saw the practice as un-American: Scott wrote that “tipping, and the aristocratic idea it exemplifies, is what we left Europe to escape. It is a cancer in the breast of democracy.”
By the 1920s, financial strains stemming from Prohibition helped solidify tipping’s place in the hospitality industry. Hotels, under pressure to make all aspects of their business self-supporting, switched from the “American Plan,” in which meals are included as part of the room rate, to the “European Plan,” in which meals are paid for separately. Because hotel managers, as Mentzer writes, “were more receptive to their staff receiving tips under [the] European Plan, [their] tendency to respond to Prohibition by switching to the European Plan had the effect of making tipping more common.” They began to view tipping as a way to ease payroll expenses, rather than bribery by customers.
In addition, many hotel bars were turned into “lunch rooms” open to the general public, and a la carte dining grew more common. Tipping became not only tolerated but, before long, widely accepted.
Is tipping more a choice or an obligation?
Take the fundamental question of whether tipping is more of a choice or an obligation, or whether it depends on the situation. Overall, 21% of U.S. adults say it’s more of a choice, 29% say it’s more of an obligation and 49% say it depends.
In nearly every demographic group, the largest share of Americans say tipping depends on the situation. But there are still some differences in the public’s views:
Younger people are likelier than older people to see tipping as more of an obligation. Some 38% of adults under 30 say it’s more of an obligation, compared with smaller shares of older Americans.
Conversely, about three-in-ten among those 65 and older (29%) see tipping as more of a choice, while roughly two-in-ten or fewer say this among younger age groups.
The sense of tipping as an obligation rises with income and education. About four-in-ten upper-income adults (39%) say tipping is more of an obligation, compared with 30% of middle-income people and 24% with lower incomes. Similarly, 41% of Americans with postgraduate degrees say it’s more of an obligation; smaller shares of people with lower levels of educational attainment say this.
When it comes to knowing whether or how much to tip, relatively few Americans express a great deal of confidence. About a third of U.S. adults (34%) say it’s extremely or very easy to know whether to tip for different kinds of services these days, and a similar share (33%) say the same about knowing how much to tip. Here, too, there are some key demographic differences:
People with upper incomes and those with more education are less confident about tipping than those with lower incomes or less education. For example, only about a quarter of upper-income people (25%) and those with bachelor’s degrees (26%) say it’s extremely or very easy to know whether to tip in a given situation.
Greater shares of those with upper incomes (37%) and bachelor’s degrees (35%) instead say it’s not too or not at all easy. The results were similar when we asked how easy it is to know how much to tip. (For demographic differences on this and other questions in the survey, read the Appendix.)
Men express more confidence than women about tipping. Men are modestly more likely than women to say it’s extremely or very easy to know whether to tip (37% vs. 32%) and how much to tip (37% vs. 29%).
How should tips be distributed?
Then there’s the matter of where the tips themselves should go. To assess this, we prompted Americans to think of a restaurant with wait staff who work for tips and asked how those tips should be distributed.
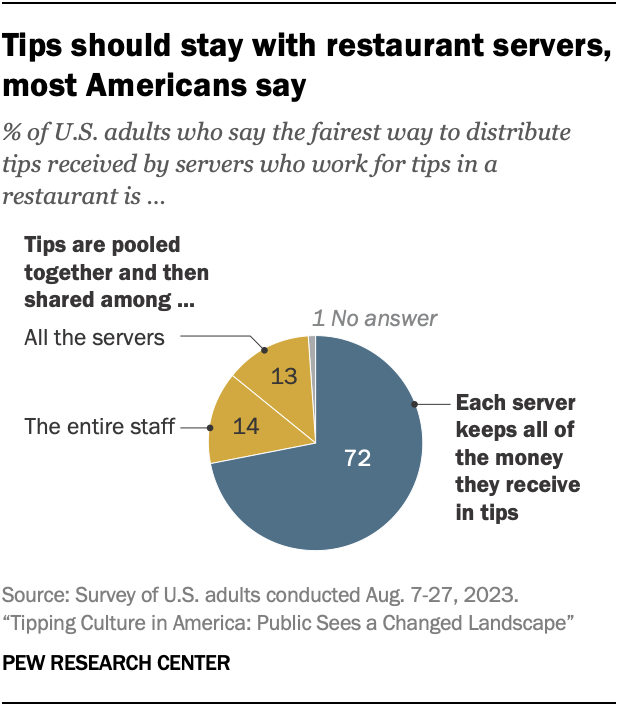
The balance of opinion is clear: A broad majority of Americans (72%) say the fairest way would be for each server to keep all of the money they receive in tips. Far fewer say the fairest way would be for tips to be pooled together and then shared among the entire staff (14%) or among all the servers (13%).
It’s not uncommon for restaurants to require servers (who, by the nature of their jobs, collect the most tips) to share tips with bartenders, food runners, table bussers, hosts and other workers. Such “tip pool” or “tipping out” arrangements are extensively regulated by state and federal law. Certain workers may or may not be eligible to participate, depending on how they’re paid.
2. How Americans see recent developments in tipping
Overall, 72% of U.S. adults say tipping is expected in more places today than it was five years ago. Only 5% say it is expected in fewer places, while 23% say it’s expected in about the same number of places. Across demographic groups, majorities say tipping is expected in more places now compared with five years ago.
Whether Americans actually are tipping more frequently is difficult to say. There’s no official data on how many U.S. businesses rely on tips to compensate their workers or what share of workers are regularly tipped.1
The public is more negative than positive about such automated tip suggestions, whether listed on a bill or shown on a screen when checking out. Four-in-ten U.S. adults strongly or somewhat oppose suggested tips, while 24% strongly or somewhat favor them and 32% neither oppose nor favor them. Attitudes differ somewhat by age and gender:
Older Americans tend to feel most negatively about tip suggestions. Nearly half of people ages 65 and older (47%) strongly or somewhat oppose them. Adults under 30 are more split in their views: Roughly equal shares say they favor tip suggestions (31%), oppose them (33%), or neither favor nor oppose them (32%).
Men are more likely than women to oppose suggested tip amounts: 44% of men strongly or somewhat oppose them, compared with 37% of women.
Feelings are much more negative when it comes to businesses – mostly restaurants – adding fixed-rate service charges to customers’ bills. Overall, 72% of U.S. adults strongly or somewhat oppose businesses including an automatic service charge or tip on the bill, while only 10% strongly or somewhat favor this. Another 13% neither oppose nor favor it.
What service charges are and aren’t
Restaurants have imposed automatic service charges for years, but they typically did so only on larger parties. In recent years, particularly since the COVID-19 pandemic, more restaurants have begun imposing such charges – which now can sometimes exceed 20% of the check – on all customers.
But service charges are distinct from tips, and not just because they’re mandatory. Since service charge revenue goes directly to the restaurant, in most cases the owners can use the money however they see fit. Despite the name, there’s generally no requirement that any of the money be distributed to workers.
Tips, on the other hand, are voluntary on the part of customers, who can determine whether and how much to give. Whether shared or not, tips must stay with the employees. By law, owners or managers cannot keep any tips. This is why some restaurants that impose service charges also include a tip option on the bill.
Across demographic groups, majorities of Americans say they oppose automatic service charges or tips on customers’ bills. But there are again some differences by age and income:
Older adults are more likely than younger Americans to oppose automatic service charges or tips. About eight-in-ten (79%) of those ages 65 and older oppose such charges, compared with six-in-ten adults under 30.
People with lower incomes are somewhat less likely than those with higher incomes to oppose automatic service charges or tips. Still, 66% of lower-income adults oppose such charges.
3. Services Americans do and don’t tip for – and how much
The largest share of Americans (49%) say the decision about whether to tip or not depends on the situation. To explore this sentiment further, we asked Americans whether they’d leave a tip in seven specific scenarios that are common in daily life.
Americans report tipping at sit-down restaurants more regularly than in any other scenario we asked about. Some 92% of U.S. adults who dine at sit-down restaurants – that is, one where a server takes their order – say they always or often tip in this situation. That includes 81% who say they always tip in this situation.
Roughly eight-in-ten Americans who get haircuts (78%) say they always or often tip when doing so. A similar share of Americans who have food delivered (76%) report always or often tipping in this situation.
Seven-in-ten U.S. adults who buy drinks at bars say they always or often leave a tip when doing so. And about six-in-ten adults who use taxi or rideshare services (61%) always or often leave a tip.
Tipping is much less common in two other scenarios we asked about. Only a quarter of Americans who buy coffee or other beverages at a coffee shop say they always or often tip in this situation. And just 12% of those who dine at fast casual restaurants – that is, restaurants where there are no servers – always or often leave a tip.
The public’s tipping habits, among those who use each service, vary somewhat by demographic group:
In most scenarios, upper-income Americans are more likely than those with middle or lower incomes to tip always or often. An exception: Respondents with lower incomes are most likely to report tipping at fast casual restaurants. Even so, only 16% say they always or often do this.
Americans with at least a bachelor’s degree are more likely to say they always or often tip in nearly all scenarios asked about. But similar shares of those with and without college degrees say they usually tip at coffee shops and fast casual restaurants.
Tipping rates over time
What constitutes an acceptable tip has risen over time, much like the prices of goods and services generally. According to the first (1922) edition of Emily Post’s etiquette book, the rule was 10% for a meal in a “first class hotel,” with a 25-cent minimum. “Tipping is undoubtedly a bad system, but it happens to be in force,” Post wrote, “and that being the case, travelers have to pay their share of it – if they like the way made smooth and comfortable.”
By the latter part of the 20th century, a typical restaurant tip in the U.S. was 15%, according to a historical sketch by economist Ofer Azar. The 1997 edition of Post’s book, cited by Azar, stated, “It wasn’t long ago that 15 percent of the bill, excluding tax, was considered a generous tip in elegant restaurants. Now the figure is moving toward 20 percent for excellent service. In ordinary family-style restaurants 15 percent is still the norm.”
We consulted more than three dozen tipping guides – from food and travel publications to etiquette experts, personal-finance sites and other sources – to get a sense of the current guidance. While specific recommendations vary, 15% is widely deemed the minimum acceptable tip for restaurant service, and 18% to 20% or beyond is frequently advised. One guide, for example, says a tip of 15% to 20% is the norm in sit-down restaurants, but isn’t required at fast-food eateries. Another says the “standard expectation” is 20% at sit-down restaurants and that “10% is now the norm” for quick-service restaurants.
A guide on tipping in the U.S. from the Australian airline Qantas advises 20% to 25% in restaurants and 10% for quick-service, except fast-food chains. The airline adds: “In Australia, where workers are paid a fair minimum wage, a tip is just that – a bonus for great service. Paying extra on top of the bill at a restaurant may seem unnecessary to us but … [t]aking a seat at a restaurant in the US means you’re entering a social contract with your waiter – you can’t apply Australian standards here.”
How much do people tip for a sit-down meal?
Since a large majority of Americans say they usually tip when eating at a sit-down restaurant, we also wanted to know how much of a tip they’d leave. So, we gave our respondents a hypothetical scenario in which they went to a restaurant and had average – but not exceptional – food and service.
In this situation, a majority of Americans (57%) say they would tip 15% or less, including 2% who wouldn’t leave a tip at all. Another 12% of adults say they would leave a tip of 18%, while a quarter say they would tip 20% or more.
Tip amounts vary by income, age and other factors:
Americans with upper incomes tend to tip more. Upper-income adults are more likely than middle- and lower-income adults to tip 18% or 20% for an average dining experience at a sit-down restaurant. Conversely, those with middle or lower incomes are more likely than upper-income adults to tip 15% or less in this situation.
Older Americans are slightly more likely than younger adults to tip 15% or less. Among those 65 and older, 61% would leave a tip of 15% or less. That compares with 54% of adults under 30.
4. Factors affecting whether and how much Americans tip
Above all, tipping is a question of service for most Americans. Around three-quarters of adults (77%) say the quality of the service is a major factor when deciding whether and how much to tip, while 18% say it is a minor factor. Only 5% don’t consider it a factor at all.
Far smaller shares point to other potential factors. For example, only about three-in-ten adults say a service worker’s pre-tip wages are a major factor when deciding whether and how much to tip.
About a quarter of Americans say social pressure to leave a tip is a major factor in deciding whether and how much to tip. And similar shares say a major factor in these decisions is how much the tip will cost them as the customer.
In every demographic and partisan group examined, Americans are more likely to point to the quality of the service than to any other factor when deciding whether to leave a tip or not. But there are still some demographic and partisan differences over this and other factors:
Service quality is by far the most cited factor across all age groups, but younger Americans are more likely than older people to consider certain other factors. For example, adults under 30 are more likely than those 65 and older to point to workers’ pre-tip wages, social pressure and cost as major factors when deciding whether to leave a tip.
Upper-income Americans are more likely than those with middle and lower incomes to say social pressure is a major factor in deciding whether to tip. Conversely, the cost of the tip is more likely to be a major factor in this decision for middle- and lower-income Americans than for upper-income adults.
Republicans and Republican-leaning independents are more likely than Democrats and Democratic leaners to see quality of service as a major factor. Democrats, in turn, are more likely than Republicans to cite some other factors. For example, 35% of Democrats – compared with 27% of Republicans – say a worker’s pre-tip wages are a major factor when deciding whether to leave a tip or not. Liberal Democrats are especially likely to see this as a major factor (41% do so).
These demographic patterns are broadly similar when Americans are asked about the factors they take into account when deciding how much to tip.
Acknowledgments
This report is made possible by The Pew Charitable Trusts. It is a collaborative effort based on the input and analysis of the following individuals.
Primary research team
Drew DeSilver, Senior Writer/Editor Jordan Lippert, Research Assistant John Gramlich, Associate Director Rebecca Leppert, Copy Editor Anna Jackson, Editorial Assistant Katherine Schaeffer, Research Analyst Jenn Hatfield, Writer/Editor
Editorial and graphic design
David Kent, Senior Copy Editor Alissa Scheller, Senior Information Graphics Designer
Communications and web publishing
Julia O’Hanlon, Communications Manager Jayme Link, Communications Assistant Beshay Sakla, Digital Producer
In addition, the project benefited greatly from the guidance of the Pew Research Center methodology team: Courtney Kennedy, Andrew Mercer, Ashley Amaya, Dorene Asare-Marfo, Dana Popky, Anna Brown and Arnold Lau. We also received valuable input from Senior Survey Advisor Scott Keeter, Associate Director of Research Jocelyn Kiley, Senior Writer/Editor Dalia Fahmy, Research Analyst Ted Van Green and Research Associate Luis Noe-Bustamante.
Methodology
The American Trends Panel survey methodology
Overview
The American Trends Panel (ATP), created by Pew Research Center, is a nationally representative panel of randomly selected U.S. adults. Panelists participate via self-administered web surveys. Panelists who do not have internet access at home are provided with a tablet and wireless internet connection. Interviews are conducted in both English and Spanish. The panel is being managed by Ipsos.
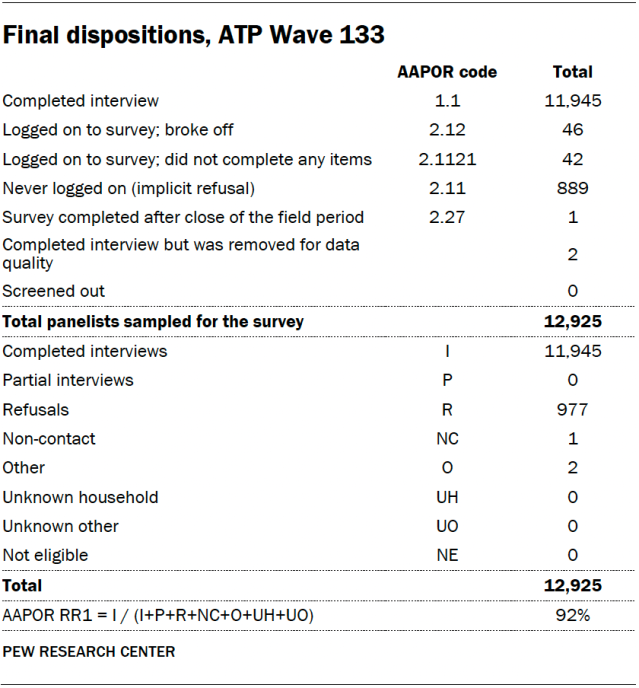
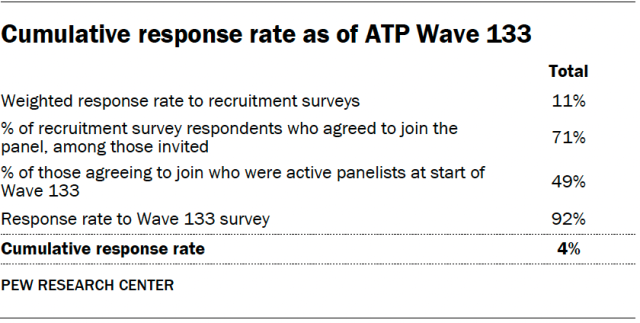
Data in this report is drawn from ATP Wave 133, conducted from Aug. 7 to Aug 27, 2023. A total of 11,945 panelists responded out of 12,925 who were sampled, for a response rate of 92%. The cumulative response rate accounting for nonresponse to the recruitment surveys and attrition is 4%. The break-off rate among panelists who logged on to the survey and completed at least one item is less than 1%. The margin of sampling error for the full sample of 11,945 respondents is plus or minus 1.4 percentage points.
Panel recruitment
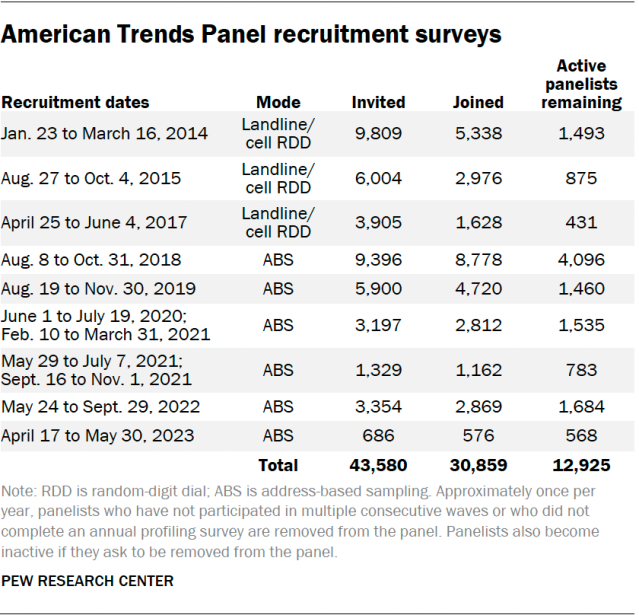
The ATP was created in 2014, with the first cohort of panelists invited to join the panel at the end of a large, national, landline and cellphone random-digit-dial survey that was conducted in both English and Spanish. Two additional recruitments were conducted using the same method in 2015 and 2017, respectively. Across these three surveys, a total of 19,718 adults were invited to join the ATP, of whom 9,942 (50%) agreed to participate.
In August 2018, the ATP switched from telephone to address-based sampling (ABS) recruitment. A study cover letter and a pre-incentive are mailed to a stratified, random sample of households selected from the U.S. Postal Service’s Delivery Sequence File. This Postal Service file has been estimated to cover as much as 98% of the population, although some studies suggest that the coverage could be in the low 90% range.2 Within each sampled household, the adult with the next birthday is asked to participate. Other details of the ABS recruitment protocol have changed over time but are available upon request.3
We have recruited a national sample of U.S. adults to the ATP approximately once per year since 2014. In some years, the recruitment has included additional effort (known as an “oversample”) to boost sample size with under-represented groups. For example, Hispanic adults, Black adults and Asian adults were oversampled in 2019, 2022 and 2023, respectively.
Across the six address-based recruitments, a total of 23,862 adults were invited to join the ATP, of whom 20,917 agreed to join the panel and completed an initial profile survey. Of the 30,859 individuals who have ever joined the ATP, 12,925 remained active panelists and continued to receive survey invitations at the time this survey was conducted.
The American Trends Panel never uses breakout routers or chains that direct respondents to additional surveys.
Sample design
The overall target population for this survey was noninstitutionalized persons ages 18 and older living in the U.S., including Alaska and Hawaii. All active panel members were invited to participate in this wave.
Questionnaire development and testing
The questionnaire was developed by Pew Research Center in consultation with Ipsos. The web program was rigorously tested on both PC and mobile devices by the Ipsos project management team and Pew Research Center researchers. The Ipsos project management team also populated test data that was analyzed in SPSS to ensure the logic and randomizations were working as intended before launching the survey.
Incentives
All respondents were offered a post-paid incentive for their participation. Respondents could choose to receive the post-paid incentive in the form of a check or a gift code to Amazon.com or could choose to decline the incentive. Incentive amounts ranged from $5 to $20 depending on whether the respondent belongs to a part of the population that is harder or easier to reach. Differential incentive amounts were designed to increase panel survey participation among groups that traditionally have low survey response propensities.
Data collection protocol
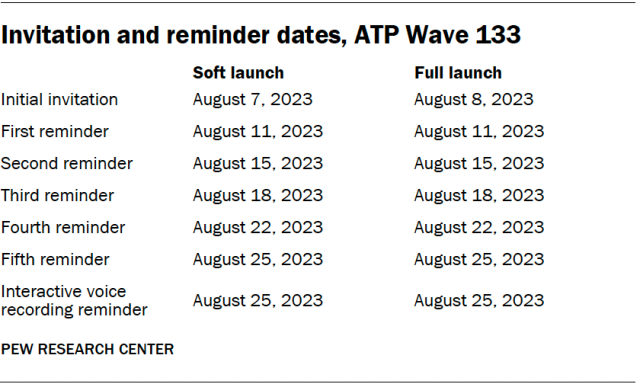
The data collection field period for this survey was Aug. 7 to Aug. 27, 2023. Postcard notifications were mailed to all ATP panelists with a known residential address on Aug. 7.
Invitations were sent out in two separate launches: soft launch and full launch. Ninety panelists were included in the soft launch, which began with an initial invitation sent on Aug. 7. The ATP panelists chosen for the initial soft launch were known responders who had completed previous ATP surveys within one day of receiving their invitation. All remaining English- and Spanish-speaking sampled panelists were included in the full launch and were sent an invitation on Aug. 8.
All panelists with an email address received an email invitation and up to five email reminders if they did not respond to the survey. All ATP panelists who consented to SMS messages received an SMS invitation and up to five SMS reminders. On Aug. 25, interactive voice recording reminder calls were made to 39 tablet households that previously provided consent to receive these reminders.
Data quality checks
To ensure high-quality data, the Center’s researchers performed data quality checks to identify any respondents showing clear patterns of satisficing. This includes checking for very high rates of leaving questions blank, as well as always selecting the first or last answer presented. As a result of this checking, two ATP respondents were removed from the survey dataset prior to weighting and analysis.
Weighting
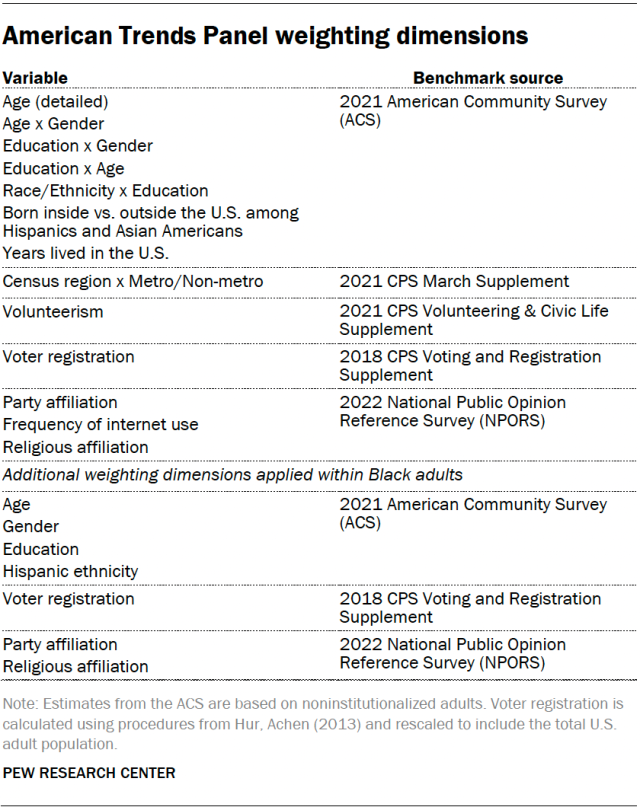
The ATP data is weighted in a multistep process that accounts for multiple stages of sampling and nonresponse that occur at different points in the survey process. First, each panelist begins with a base weight that reflects their probability of selection for their initial recruitment survey. These weights are then rescaled and adjusted to account for changes in the design of ATP recruitment surveys from year to year. Finally, the weights are calibrated to align with the population benchmarks in the accompanying table to correct for nonresponse to recruitment surveys and panel attrition. If only a subsample of panelists was invited to participate in the wave, this weight is adjusted to account for any differential probabilities of selection.
Among the panelists who completed the survey, this weight is then calibrated again to align with the population benchmarks identified in the accompanying table and trimmed at the 1st and 99.5th percentiles to reduce the loss in precision stemming from variance in the weights. Sampling errors and tests of statistical significance take into account the effect of weighting.
The following table shows the unweighted sample size and the error attributable to sampling that would be expected at the 95% level of confidence for different groups in the survey.
Sample sizes and sampling errors for other subgroups are available upon request. In addition to sampling error, one should bear in mind that question wording and practical difficulties in conducting surveys can introduce error or bias into the findings of opinion polls.
Dispositions and response rates
How family income tiers are calculated
Family income data reported in this study is adjusted for household size and cost-of-living differences by geography. Panelists then are assigned to income tiers that are based on the median adjusted family income of all American Trends Panel members. The process uses the following steps:
First, panelists are assigned to the midpoint of the income range they selected in a family income question that was measured on either the most recent annual profile survey or, for newly recruited panelists, their recruitment survey. This provides an approximate income value that can be used in calculations for the adjustment.
Next, these income values are adjusted for the cost of living in the geographic area where the panelist lives. This is calculated using price indexes published by the U.S. Bureau of Economic Analysis. These indexes, known as Regional Price Parities (RPP), compare the prices of goods and services across all U.S. metropolitan statistical areas as well as non-metro areas with the national average prices for the same goods and services. The most recent available data at the time of the annual profile survey is from 2021. Those who fall outside of metropolitan statistical areas are assigned the overall RPP for their state’s non-metropolitan area.
Family incomes are further adjusted for the number of people in a household using the methodology from the Center’s previous work on the American middle class. This is done because a four-person household with an income of say, $50,000, faces a tighter budget constraint than a two-person household with the same income.
Panelists are then assigned an income tier. “Middle-income” adults are in families with adjusted family incomes that are between two-thirds and double the median adjusted family income for the full ATP at the time of the most recent annual profile survey. The median adjusted family income for the panel is roughly $71,700. Using this median income, the middle-income range is about $47,800 to $143,400. Lower-income families have adjusted incomes less than $47,800 and upper-income families have adjusted incomes greater than $143,400 (all figures expressed in 2022 dollars and scaled to a household size of three). If a panelist did not provide their income and/or their household size, they are assigned “no answer” in the income tier variable.
Two examples of how a given area’s cost-of-living adjustment was calculated are as follows: The Anniston-Oxford metropolitan area in Alabama is a relatively inexpensive area, with a price level that is 16.2% less than the national average. The San Francisco-Oakland-Berkeley metropolitan area in California is one of the most expensive areas, with a price level that is 19.8% higher than the national average. Income in the sample is adjusted to make up for this difference. As a result, a family with an income of $41,900 in the Anniston-Oxford area is as well off financially as a family of the same size with an income of $59,900 in San Francisco.